
- This strategy exploits the anomaly that equities perform best from November to April, and less so from May to October during most years.
- ETFs (XLV, XLI, XLY, XLB) have historically performed best from November to April, and ETFs (XLK, XLP, XLU, QQQ) have done better than the first group from May to October.
- The super-sector models termed “aggressive” and “defensive” combine, respectively, the Top5(Sector)Select models for ETFs (XLV, XLI, XLY, XLB) and ETFs (XLK, XLP, XLU, QQQ), all previously published on Seeking Alpha.
- This strategy invests alternatingly in the aggressive- and defensive super-sector models during their respective “good” 6-month periods.
- From Jan-2000 to Nov-2020 a backtest shows that this strategy would have outperformed the SPDR S&P 500 ETF Trust (SPY), producing an annualized return of 23.3% versus 6.1% for SPY.
- NOTE: Elsewhere we refer to the “aggressive” season as the winter season, and conversely the “defensive” as the summer season. This model switches all holdings bi-annually end of April and end of October.
This article “Profiting from a Seasonal Super-Sector Investment Strategy” (later referred to as the referenced article) shows that switching between “aggressive” and “defensive” ETF super-sectors at the end of April and October each year would have been a profitable strategy since 1999. Here we replace the ETFs used in the referenced article with their respective Top5(Sector)Select stock models. This entails, of course, more trading, but also produces much higher returns.
The super sector models
Our super-sector classification divides stocks into aggressive and defensive super-sectors:
The aggressive super sector model combines (equal value weighted) all the stocks that each of following sector-select models holds (20 positions total):
- The Materials Select Sector SPDR Fund (XLB) (article-1);
- the Industrial Select Sector SPDR Fund (XLI) (article-2);
- the Healthcare Select Sector SPDR Fund (XLV) (article-3); and
- the Consumer Discretionary Select Sector SPDR Fund (XLY) (article-4) ;
The defensive super sector model combines (equal value weighted) all the stocks that each of following sector-select models holds (20 positions total):
- The Innovation Invesco QQQ Trust (article-5).
- the Technology Select Sector SPDR Fund (XLK) (article-6);
- the Consumer Staples Select Sector SPDR Fund (XLP) (article-7); and
- the Utility Select Sector SPDR Fund (XLU) (article-8);
The seasonal super-sector investment strategy
This strategy requires holding the aggressive super-sector combination model from end of October to end of April, and holding the defensive super-sector combination model from end of April to end of October.
Historic performance of the super-sector combination models
The analysis was performed on the on-line portfolio simulation platform Portfolio 123 which provides historic financial data for stocks, bonds and ETFs. The constituent models are held equal weight and rebalanced every four weeks allowing for an asset tolerance of 2%.
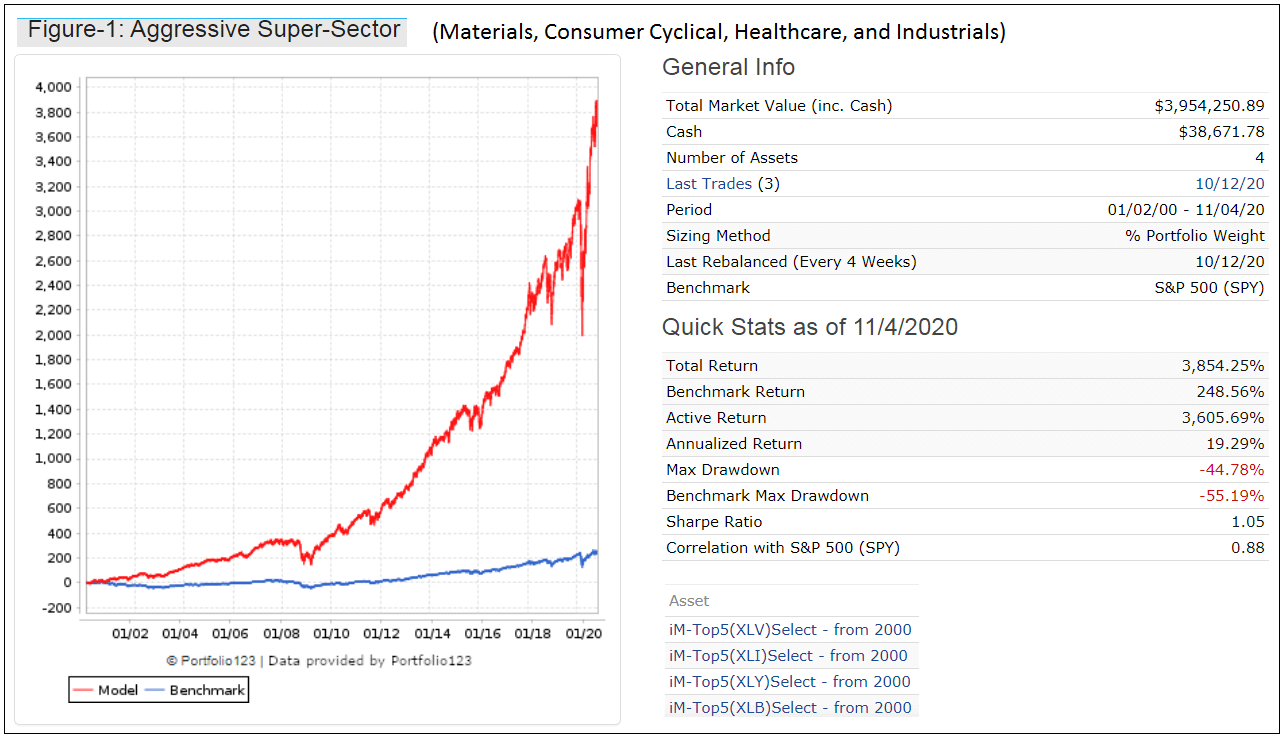
Figure-1 shows the simulated performance from Jan-2000 to Nov-2020 of the aggressive super-sector combination model with Top5(Sector)Select models from the sectors Materials, Consumer Cyclical, Healthcare, and Industrials. The annualized return would have been 19.3% with a maximum drawdown of -45%.
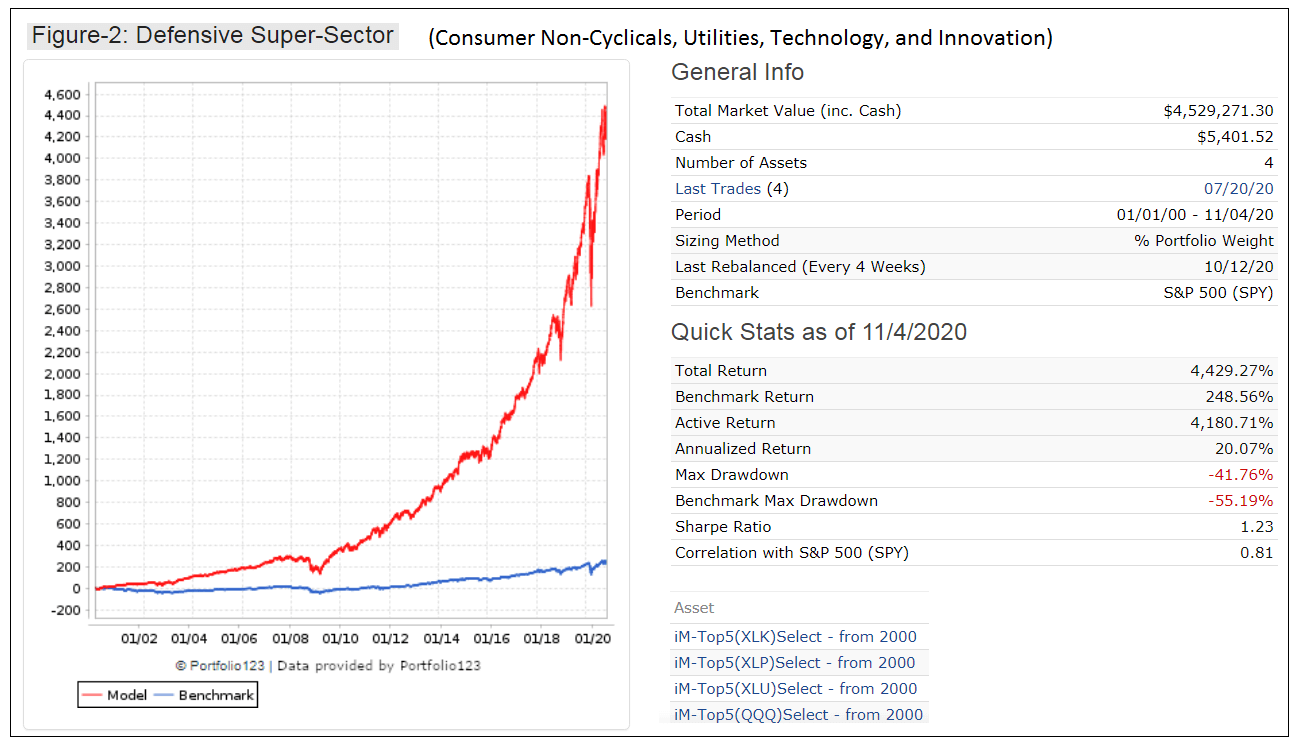
Figure-2 shows the simulated performance from Jan-2000 to Nov-2020 of the defensive super-sector combination model with Top5(Sector)Select models from sectors Consumer Non-Cyclicals, Utilities, Technology, and Innovation. The annualized return would have been 20.1% with a maximum drawdown of -42%.
It is evident that there is no significant difference between the aggressive- and defensive super-sector models’ returns and maximum drawdowns.
Performance with seasonal super-sector switching
Presently Portfolio 123 has no provision allowing switching between combination models according to a rebalancing formula. Thus, the analysis was performed in excel with data input from the performance of the two super-sector models shown in figures-1 and 2.
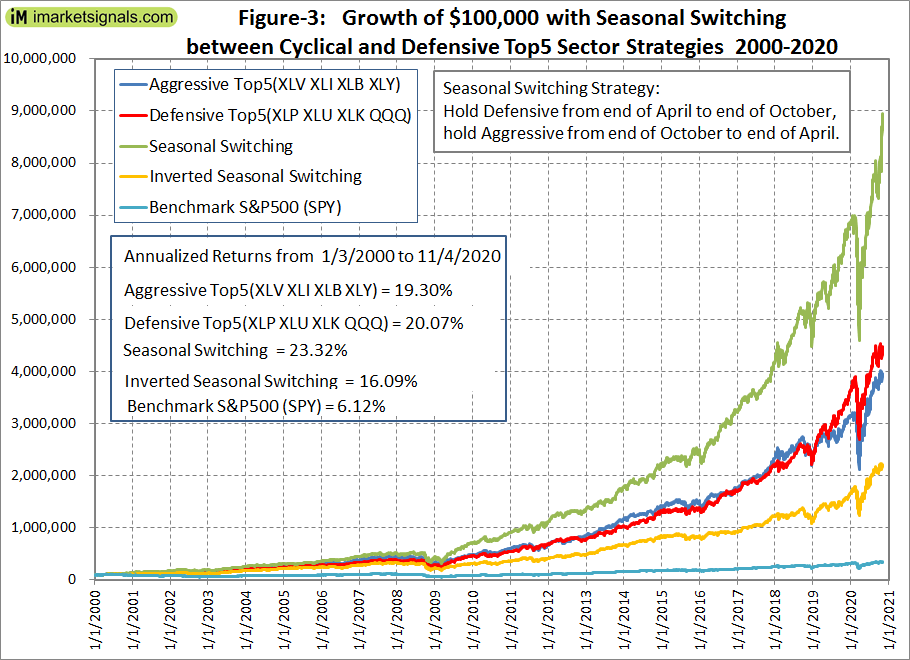
Figure-3 shows the simulated performance from 1/2/200 to 11/4/2020 for the seasonal switching strategy which switches occurring on the first trading day of the last week in April and October each year. The annualized return would have been 23.3% (6.1% for SPY) with a maximum drawdown of -40% (-55% for SPY).
Also in figure-3 the performance of an inverted switching strategy is shown when holding the defensive super-sector combination model from end of October to end of April, and the aggressive super-sector combination model from end of April to end of October. The annualized return would have been 16.1% with a maximum drawdown of -47%.
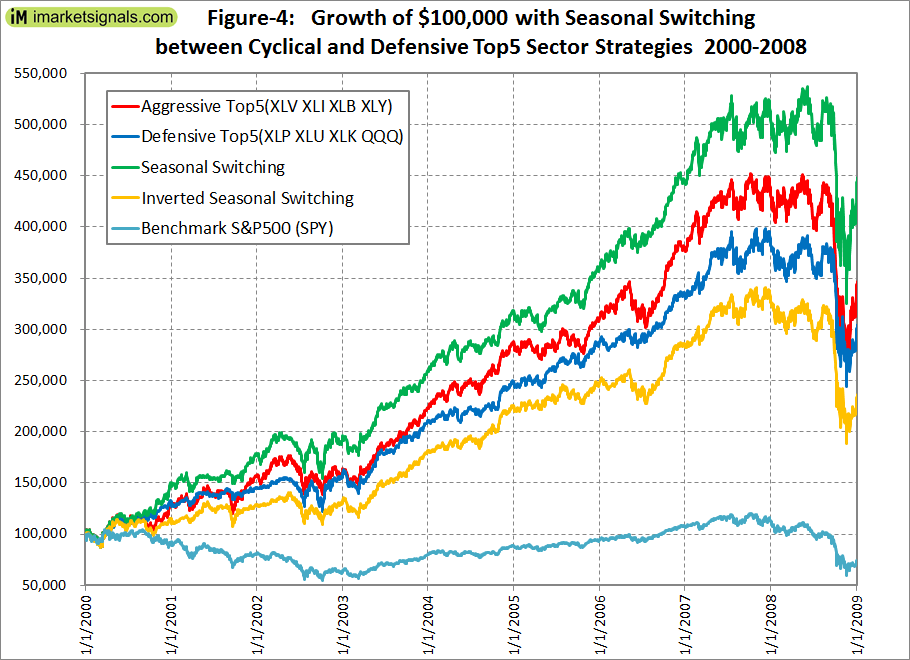
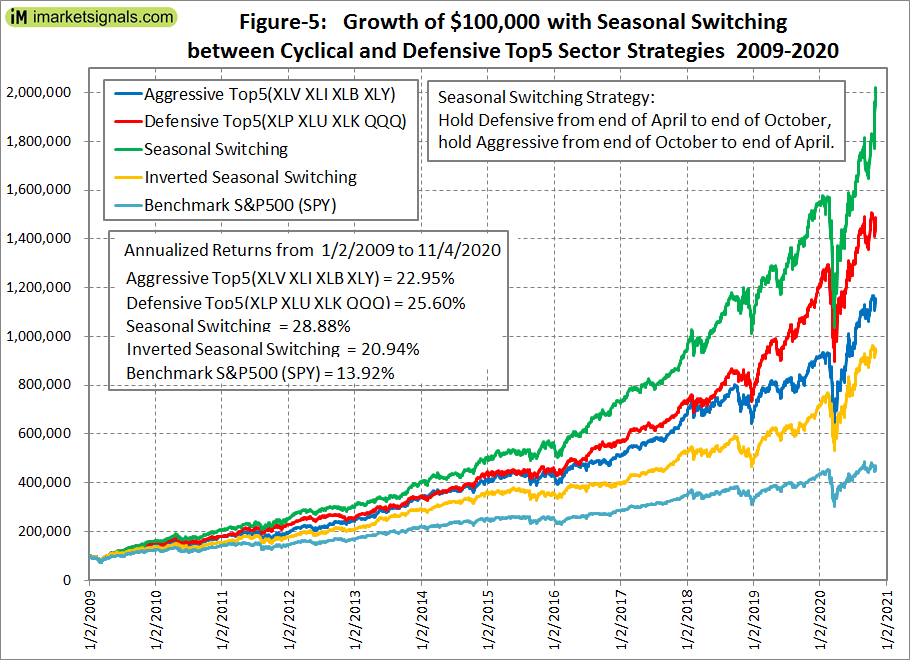
In the appendix are figures-4 and 5 which show in greater detail the performance for the periods 2000-2008 and 2009-2020, respectively. It is evident that the seasonal super-sector switching strategy out-performed a non-switching strategy. For the 2009-2020 period the annualized return would have been 28.9% (13.9% for SPY).
Risk Measurements
| Basic Statistics | Model | S&P500 (SPY) |
| CAGR= | 23.32% | 6.12% |
| Max D/D = | -39.39% | -55.19% |
| Annualized Standard Deviation | 15.91% | 14.97% |
| Sharpe Ratio | 1.31 | 0.37 |
| Sortino Ratio | 1.60 | 0.49 |
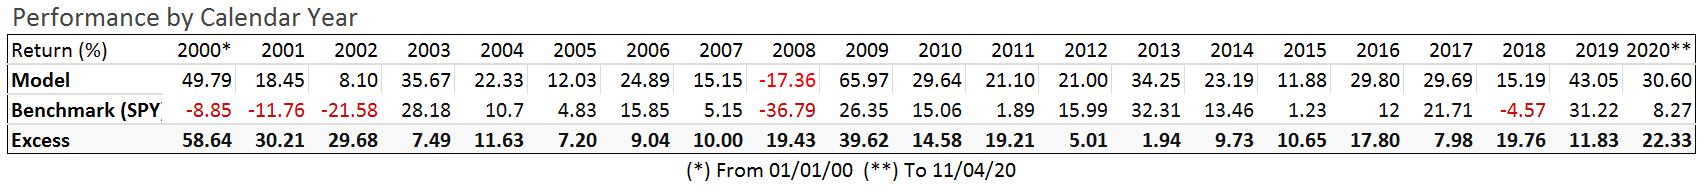
Calendar year performance
Except for 2008 the model would have had only positive calendar year returns and positive excess returns over SPY for every year.
Conclusion
Nobody knows which sector will perform best over any period. However, the seasonality of the stock market has been observed for many years. The fact that there is such a large difference in performance between the seasonal- and inverted seasonal strategies confirms this. It should be advantageous to follow the Seasonal Super-Sector Investment Strategy which does not rely on the performance of a single sector model, but uses two groups of four Top5(Sector)Select models.
The analysis shows that such a strategy would have produced good returns, much preferable to a buy-and-hold investment in the stock index fund SPY, or in any of the individual sector ETFs on which the Top5(Sector)Select models are based.
Apart from switching super-sectors at the end of April and October there is some stock trading needed to track the trading activity of the component Top5(Sector)Select models. At iMarketSignals one can follow this strategy where trades and performance will be updated weekly. The current twenty stock holdings (five for each component model) are listed in the appendix.
Appendix
Holdings as of 11/16/2020 |
||||
Ticker |
Name |
MktCap |
Yield % |
Sector |
| BBY | Best Buy Co Inc | 31 B | 1.85% | CYCLICALS |
| DHI | D.R. Horton Inc. | 27 B | 1.07% | CYCLICALS |
| HD | Home Depot Inc. (The) | 292 B | 2.21% | CYCLICALS |
| TSCO | Tractor Supply Co | 15 B | 1.22% | CYCLICALS |
| EBAY | eBay Inc. | 34 B | 1.29% | CYCLICALS |
| ABBV | AbbVie Inc | 176 B | 5.22% | HEALTHCARE |
| GILD | Gilead Sciences Inc | 76 B | 4.49% | HEALTHCARE |
| HOLX | Hologic Inc | 18 B | 0.00% | HEALTHCARE |
| MTD | Mettler-Toledo International Inc | 27 B | 0.00% | HEALTHCARE |
| WAT | Waters Corp | 14 B | 0.00% | HEALTHCARE |
| EMR | Emerson Electric Co. | 46 B | 2.62% | INDUSTRIAL |
| GD | General Dynamics Corp | 43 B | 2.93% | INDUSTRIAL |
| ITW | Illinois Tool Works Inc. | 65 B | 2.20% | INDUSTRIAL |
| LMT | Lockheed Martin Corp | 105 B | 2.76% | INDUSTRIAL |
| SNA | Snap-On Inc | 9 B | 2.87% | INDUSTRIAL |
| AVY | Avery Dennison Corp | 12 B | 1.69% | MATERIALS |
| IFF | International Flavors & Fragrances Inc | 12 B | 2.75% | MATERIALS |
| LEG | Leggett & Platt Inc | 6 B | 3.70% | MATERIALS |
| PKG | Packaging Corp Of America | 12 B | 2.43% | MATERIALS |
| SEE | Sealed Air Corp | 7 B | 1.43% | MATERIALS |
Figures-4 and 5 which show in greater detail the performance for the periods 2000-2008 and 2009-2020, respectively.
Disclaimer
All results shown are hypothetical and the result of backtesting over the period 1999 to 2020. No claim is made about future performance.
Am I reading this right, you flip flopped XLK and XLV in “The iM Seasonal ETF Switching Strategy”. Honestly made more sense to me before, having Health Care as defensive and Tech as Cyclical.
Also, using the select QQQ does not seem right, it is made up of all types of sectors (though mostly tech).
This strategy seems to partly go against your original “iM Seasonal ETF Switching Strategy”.
The rational for interchanging the seasons applicable to XLK and XLV in “The iM Seasonal ETF Switching Strategy” comes from “Profiting from a Seasonal Super-Sector Investment Strategy”.
https://imarketsignals.com/2020/profiting-from-seasonal-investment/
The terms “defensive” and “aggressive” refer to the business cycle.
We should have named them summer and winter super-sectors instead, since the allocation has nothing to do with the business cycle but only to the seasons of the year.
We will provide a revision to the “The iM Seasonal ETF Switching Strategy” model’s description to show the simulated historic performance with XLV and XLK switched. The simulation with the revision from 1999 shows almost identical returns and slightly higher Sharpe Ratio than the original version. For later starting dates the revised model always out-performs the original.
The revised model shows current holding as XLI instead of XLK.
Georg,
Thanks for developing the model which I’ve been using for a couple of months now and have a few comments/questions:
-The model has both XLK and QQQ, which, for the past few years, track almost identically to each other because of the shift in QQQ towards technology being the predominant component.
-There is no Super-Sector model for XLF. Why is that and would it make sense to add XLF in place of QQQ?
-Have you looked at whether an ETF switching strategy using one of the business cycle models would improve the results compared to a winter-summer switching?
We did not find any seasonal anomaly for XLF and XLE. That is why they have been omitted.
So far we have not investigated a super-sector switching strategy based on the business cycle. We will look into it though. Thanks for the suggestion.
Georg,
Thanks for your reply. Just the same, be good to have an iM-Top5(XLF)Select – factors other than seasonality may be more dominant in sector selection, especially these days where Covid seems to be having the effect of throwing seasonality out the window.