  |
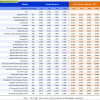
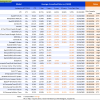
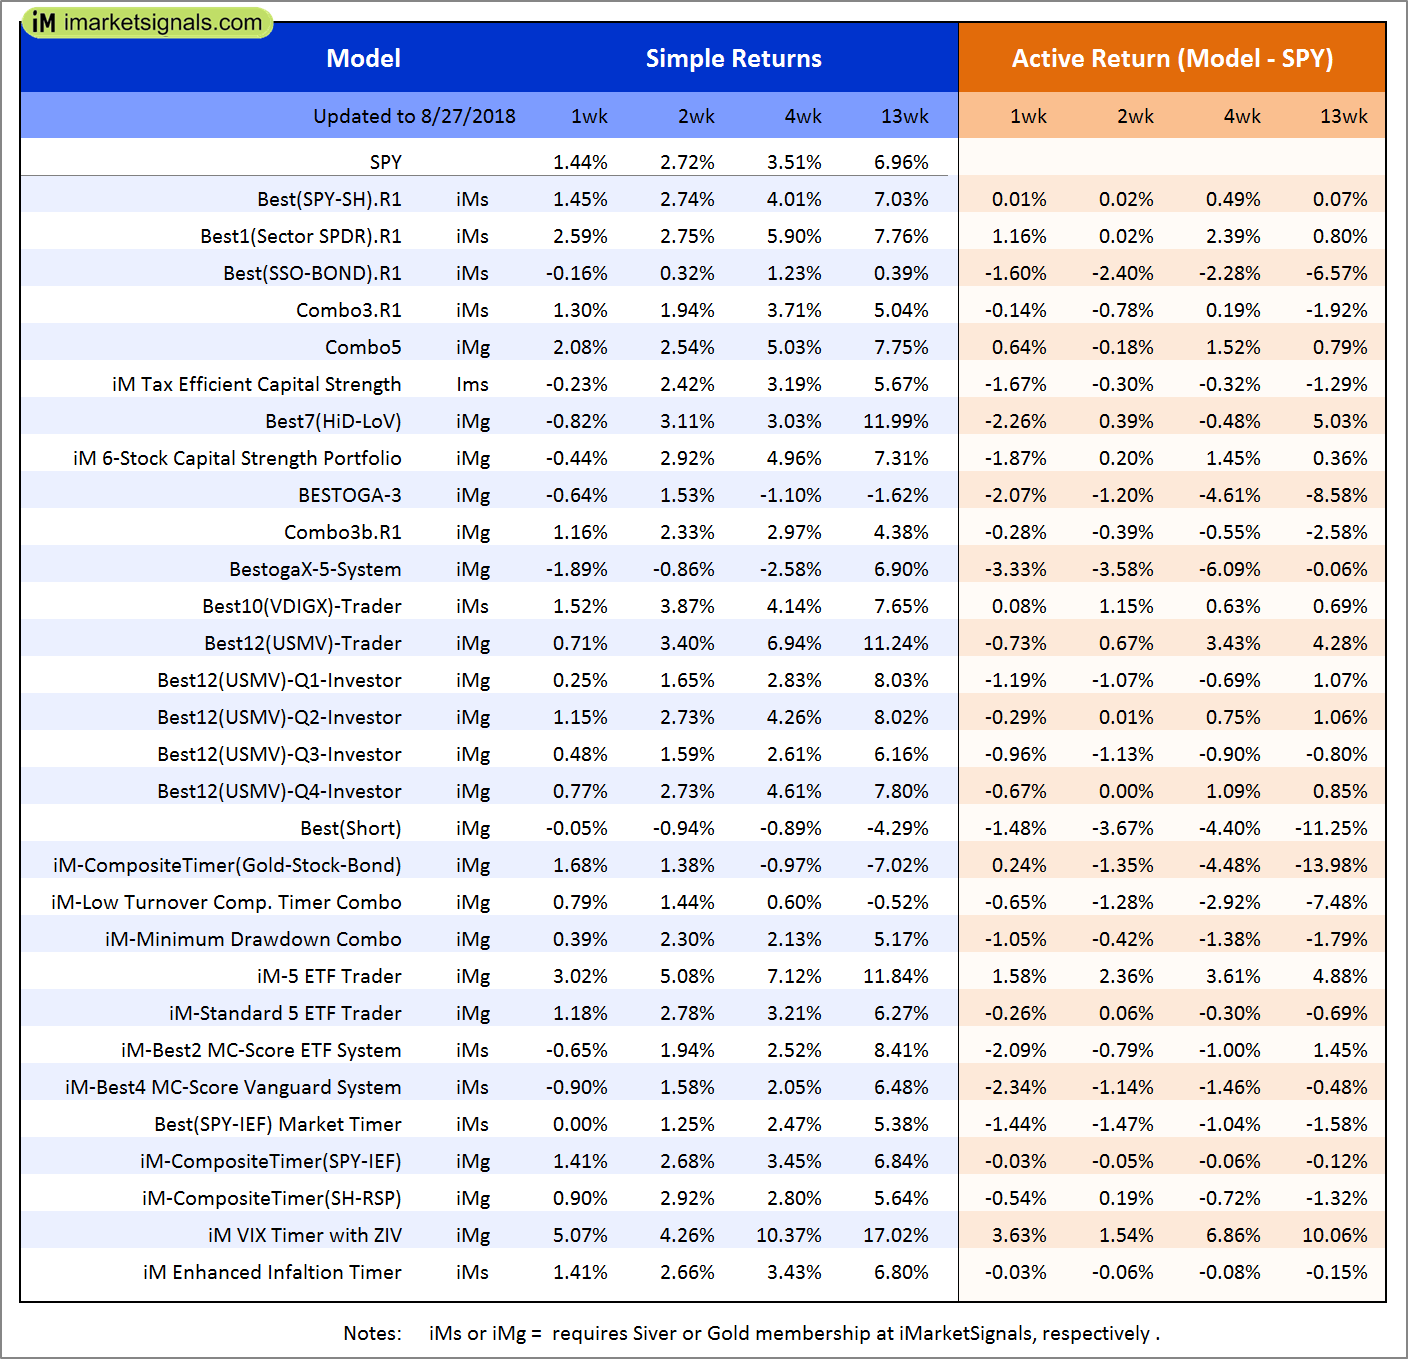
Out of sample performance summary of our models for the past 1, 2, 4 and 13 week periods. The active active return indicates how the models over- or underperformed the benchmark ETF SPY. Also the YTD, and the 1-, 3-, 5- and 10-year annualized returns are shown in the second table |
|
|
iM-Best(SPY-SH).R1: The model’s out of sample performance YTD is 9.1%, and for the last 12 months is 20.1%. Over the same period the benchmark SPY performance was 9.5% and 20.7% respectively. Over the previous week the market value of Best(SPY-SH) gained 1.45% at a time when SPY gained 1.44%. A starting capital of $100,000 at inception on 1/2/2009 would have grown to $616,363 which includes -$4,925 cash and excludes $17,694 spent on fees and slippage. |
|
|
iM-Combo3.R1: The model’s out of sample performance YTD is 10.1%, and for the last 12 months is 25.6%. Over the same period the benchmark SPY performance was 9.5% and 20.7% respectively. Over the previous week the market value of iM-Combo3.R1 gained 1.30% at a time when SPY gained 1.44%. A starting capital of $100,000 at inception on 2/3/2014 would have grown to $173,927 which includes -$1,649 cash and excludes $4,008 spent on fees and slippage. |
|
|
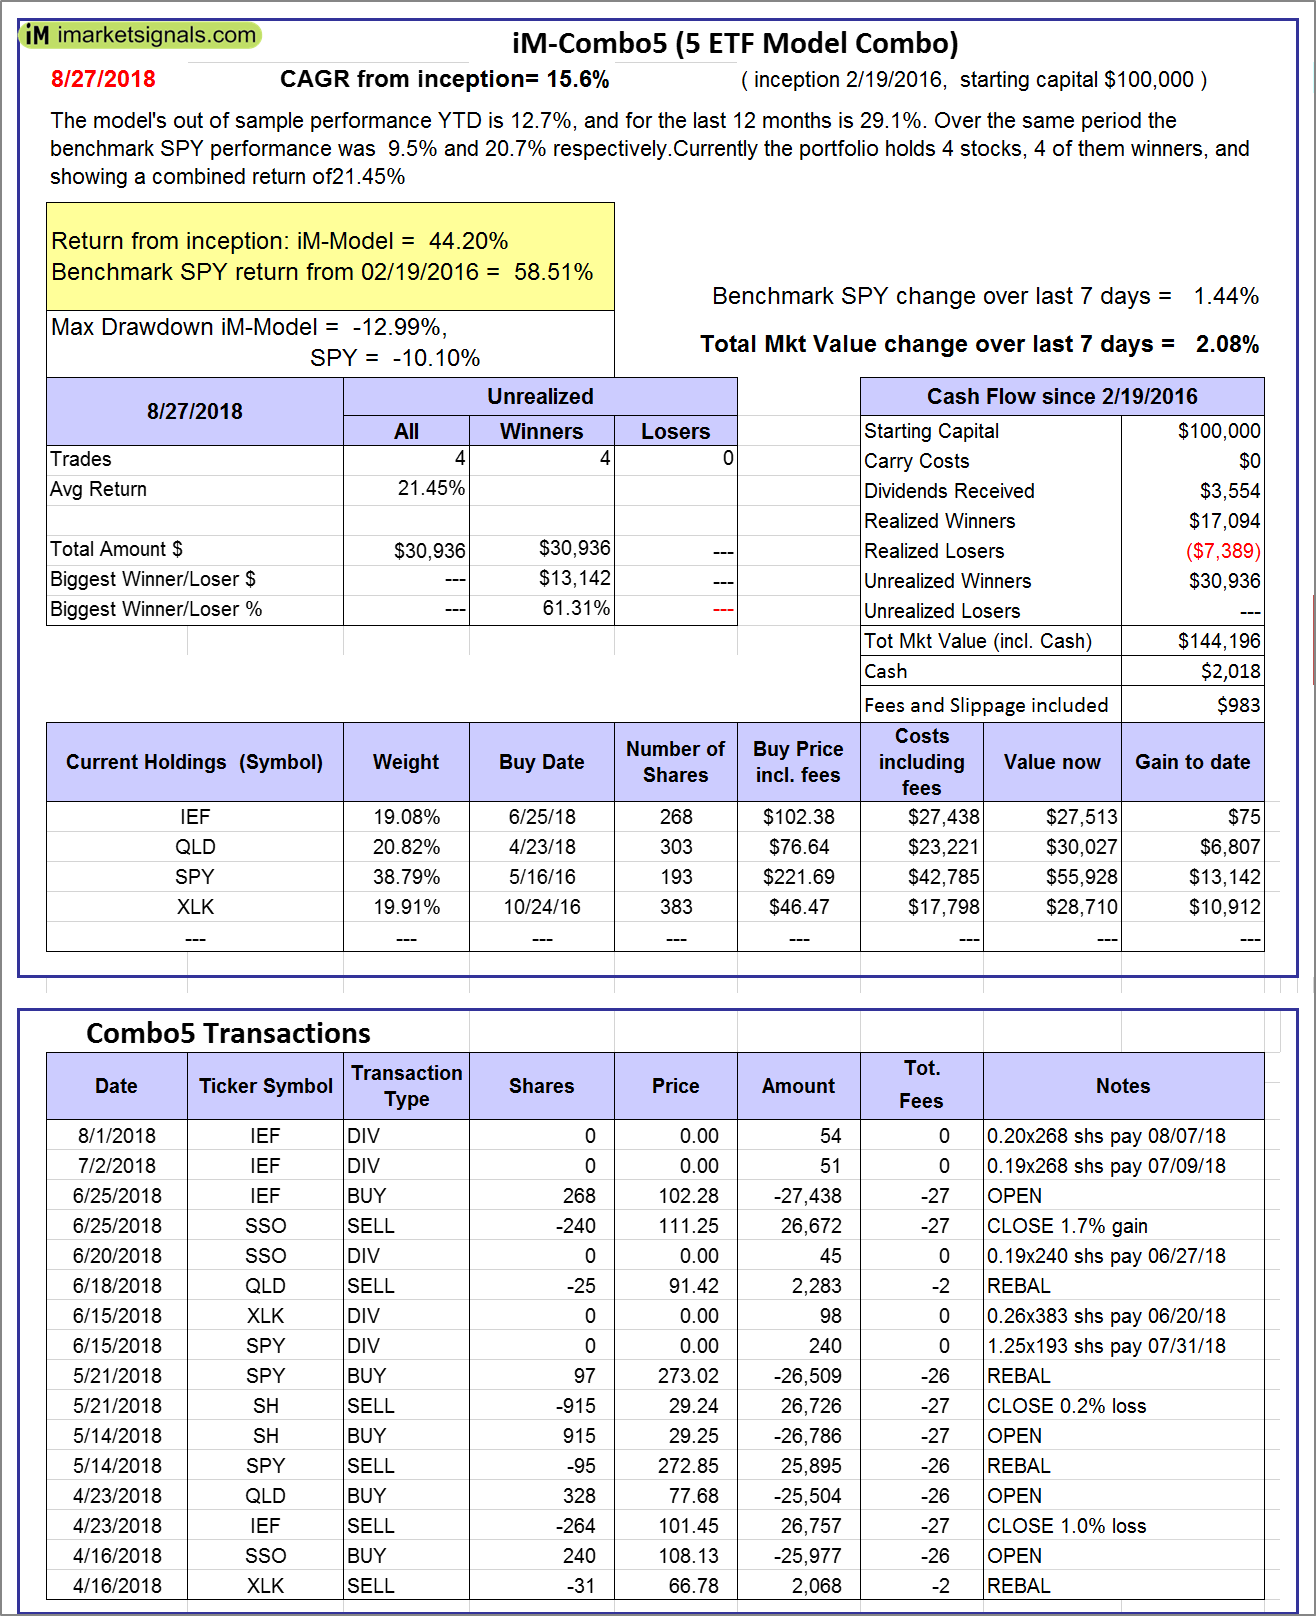
iM-Combo5: The model’s out of sample performance YTD is 12.7%, and for the last 12 months is 29.1%. Over the same period the benchmark SPY performance was 9.5% and 20.7% respectively. Over the previous week the market value of iM-Combo5 gained 2.08% at a time when SPY gained 1.44%. A starting capital of $100,000 at inception on 2/22/2016 would have grown to $144,196 which includes $2,018 cash and excludes $983 spent on fees and slippage. |
|
|
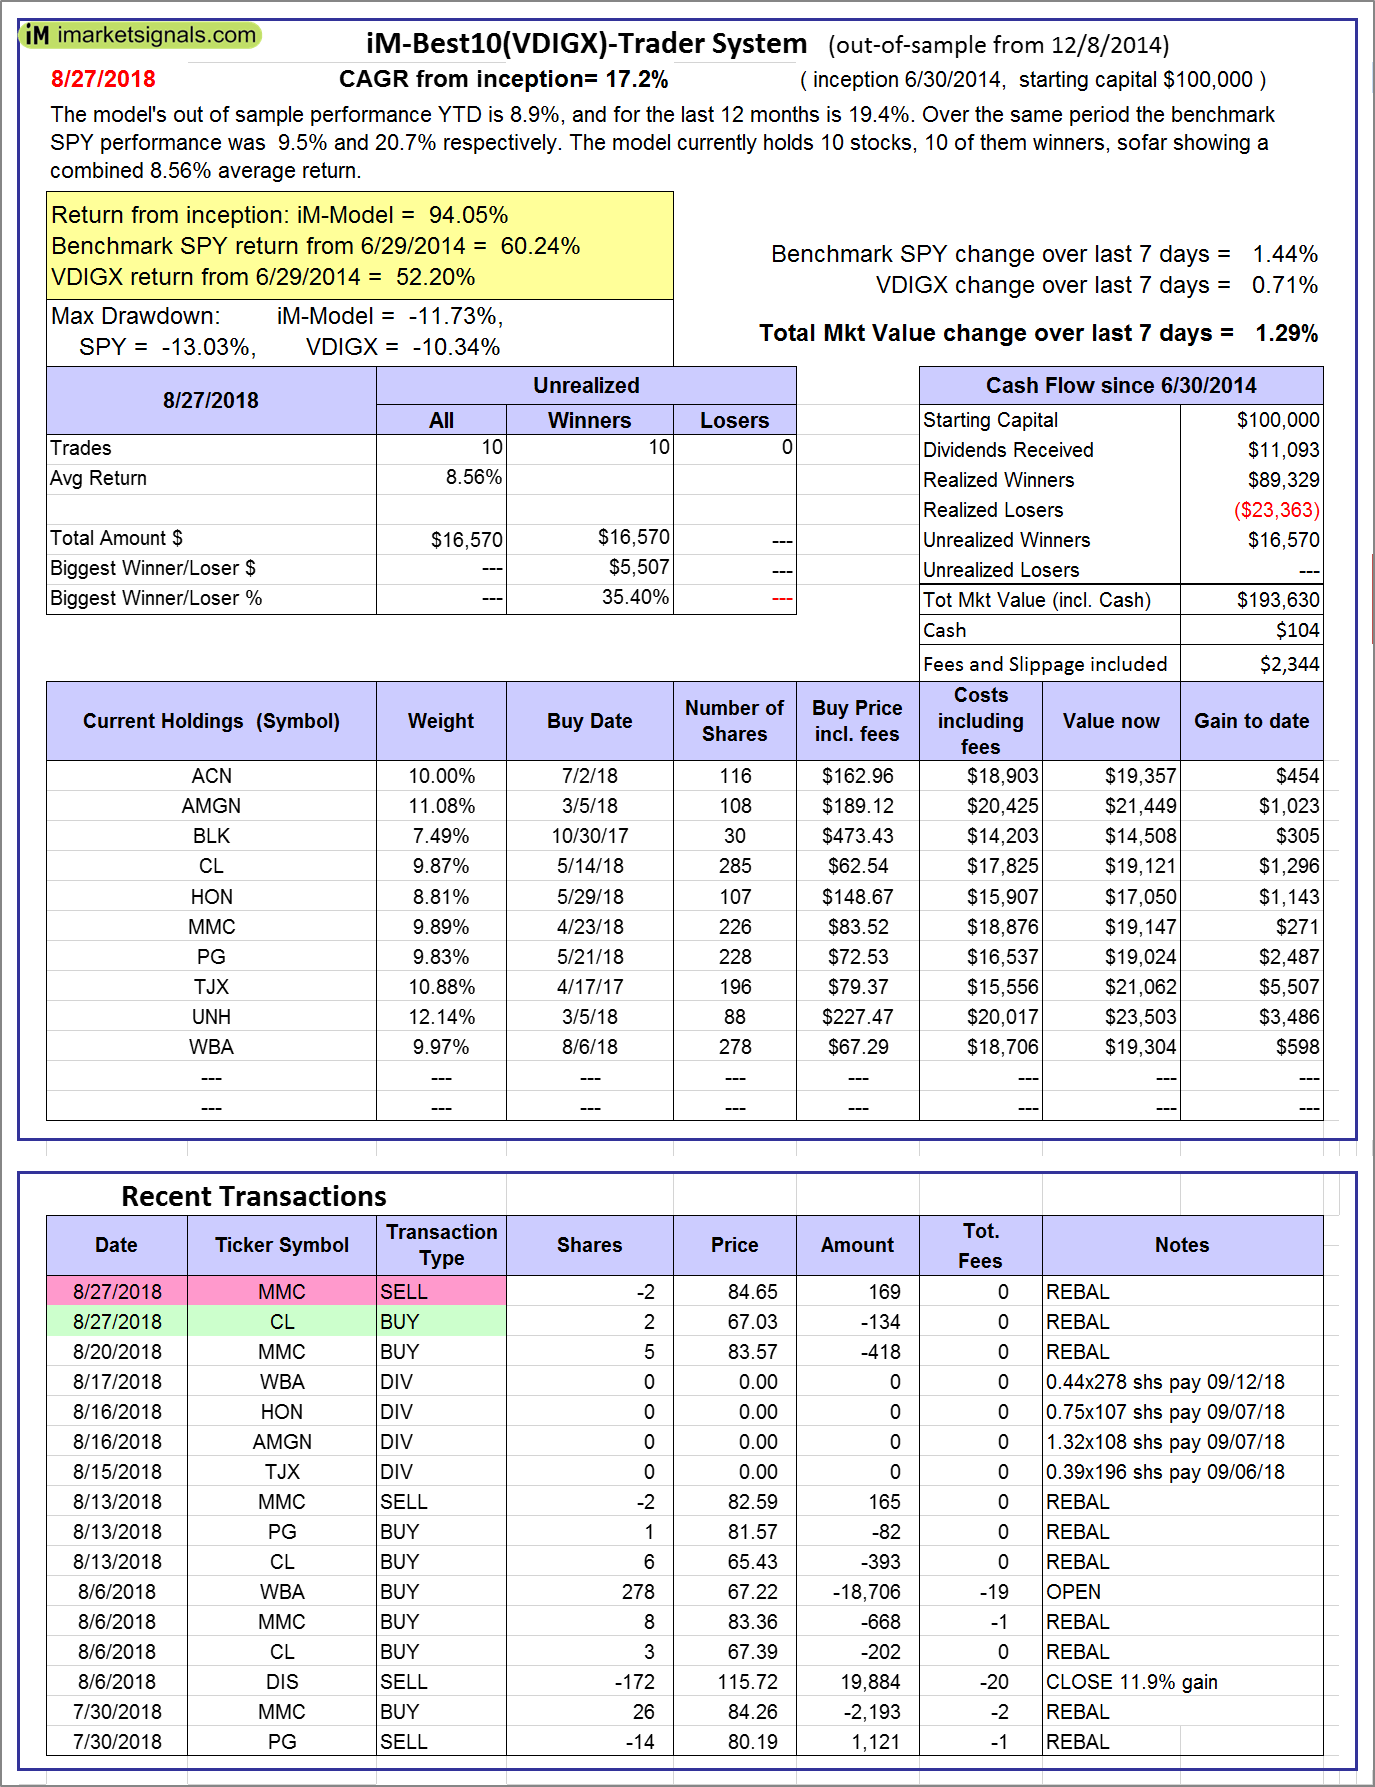
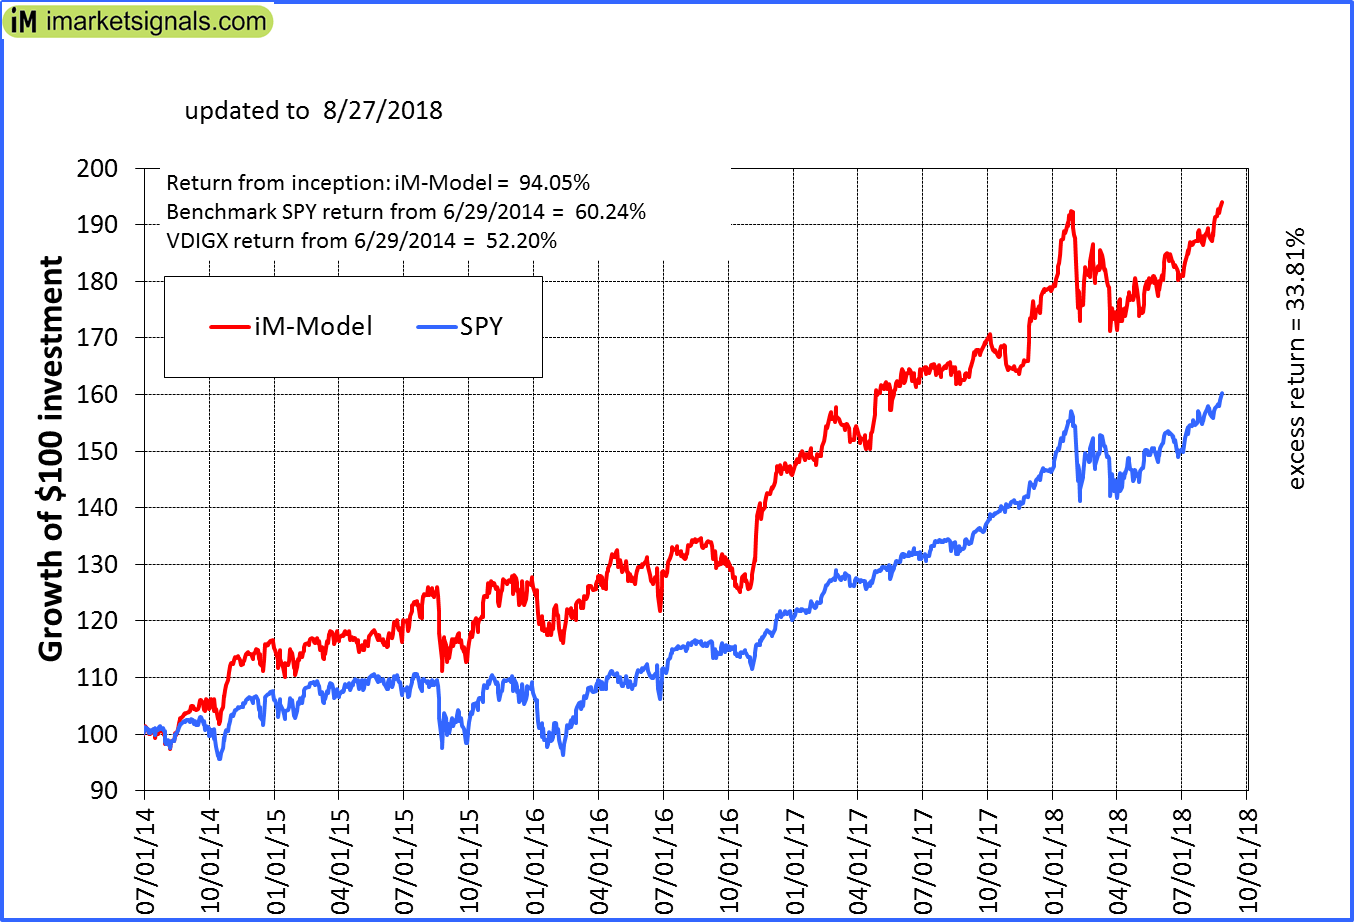
iM-Best10(VDIGX)-Trader: The model’s out of sample performance YTD is 8.9%, and for the last 12 months is 19.4%. Over the same period the benchmark SPY performance was 9.5% and 20.7% respectively. Since inception, on 7/1/2014, the model gained 94.05% while the benchmark SPY gained 60.24% and VDIGX gained 52.20% over the same period. Over the previous week the market value of iM-Best10(VDIGX) gained 1.29% at a time when SPY gained 1.44%. A starting capital of $100,000 at inception on 7/1/2014 would have grown to $193,630 which includes $104 cash and excludes $2,344 spent on fees and slippage. |
|
|
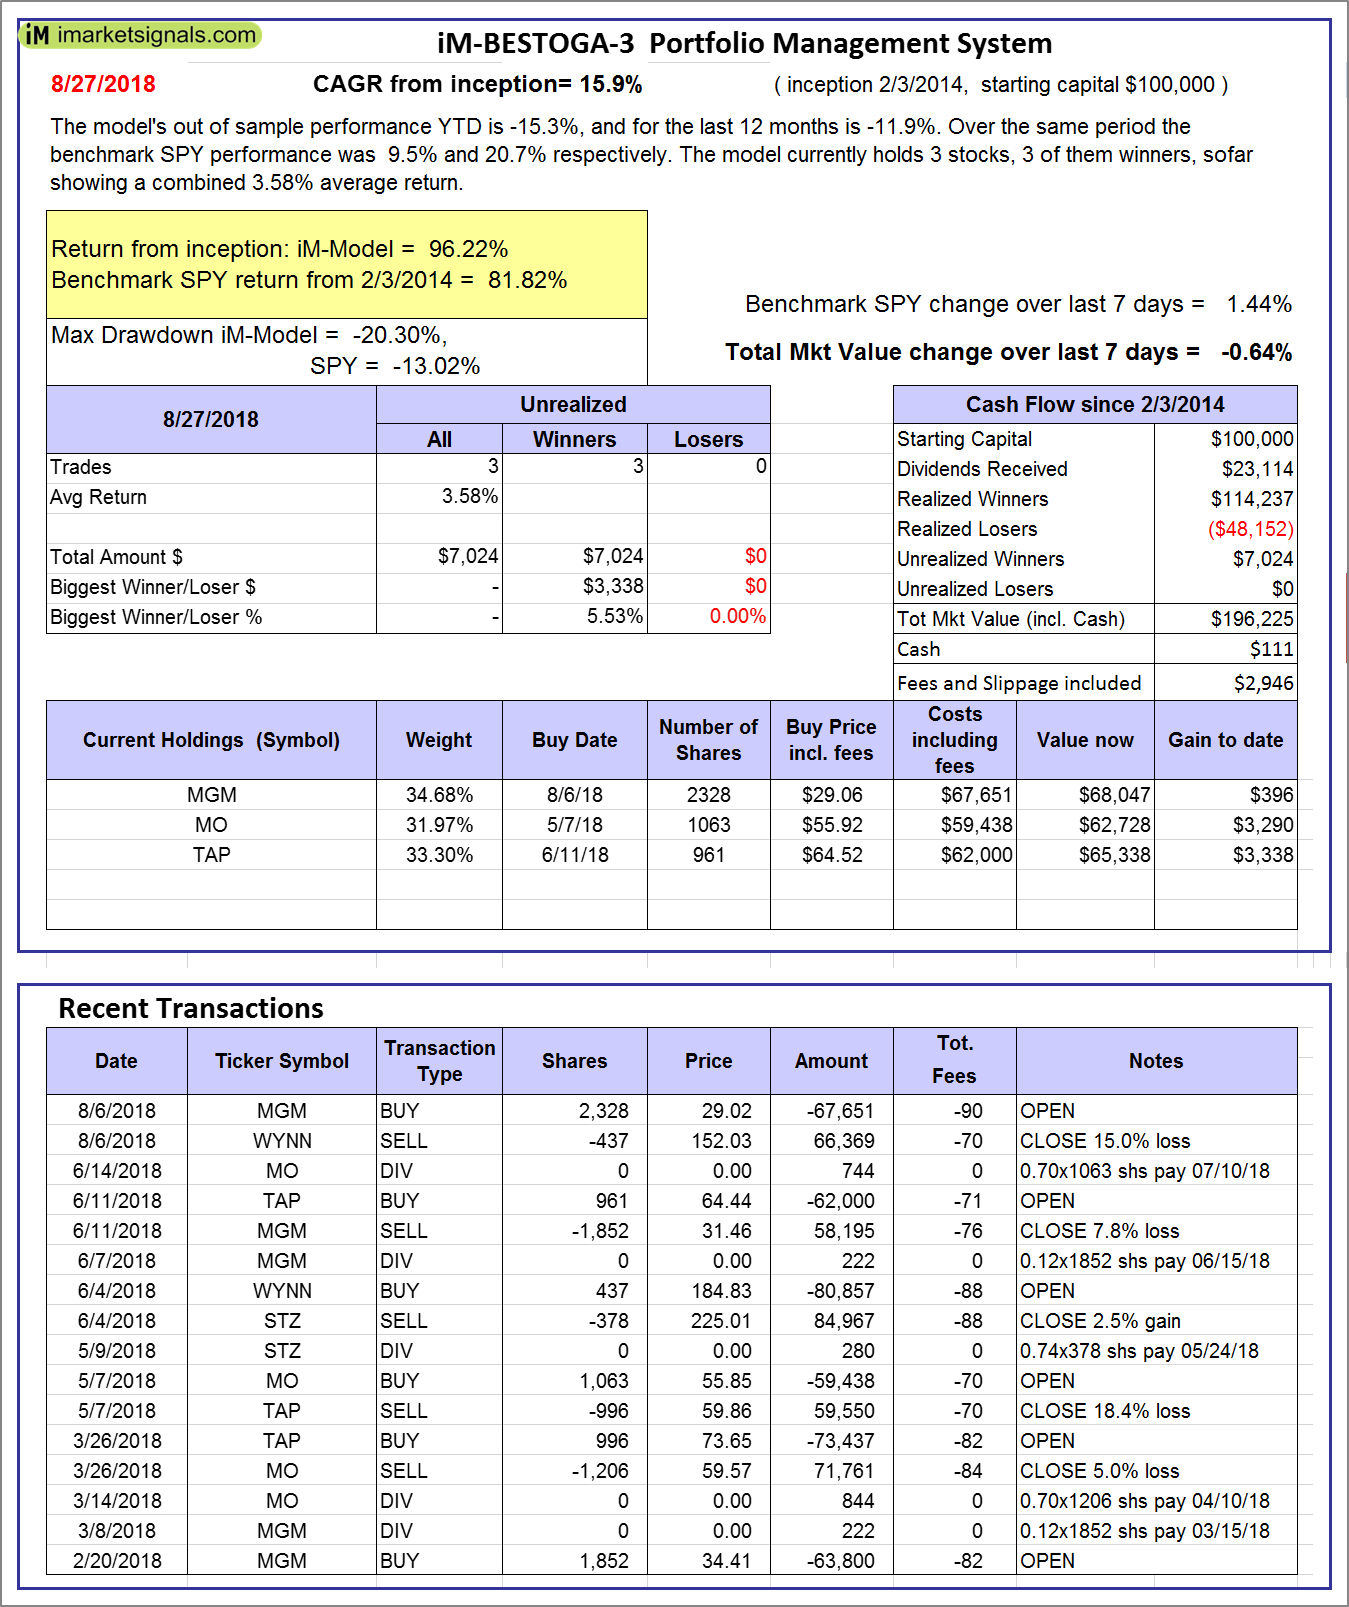
iM-BESTOGA-3: The model’s out of sample performance YTD is -15.3%, and for the last 12 months is -11.9%. Over the same period the benchmark SPY performance was 9.5% and 20.7% respectively. Over the previous week the market value of iM-BESTOGA-3 gained -0.64% at a time when SPY gained 1.44%. A starting capital of $100,000 at inception on 2/3/2014 would have grown to $196,225 which includes $111 cash and excludes $2,946 spent on fees and slippage. |
|
|
iM-Best7(HiD-LoV): The model’s out of sample performance YTD is 4.8%, and for the last 12 months is 6.5%. Over the same period the benchmark SPY performance was 9.5% and 20.7% respectively. Over the previous week the market value of iM-BESTOGA-3 gained -0.94% at a time when SPY gained 1.44%. A starting capital of $100,000 at inception on 6/30/2016 would have grown to $118,622 which includes $220 cash and excludes $2,166 spent on fees and slippage. |
|
|
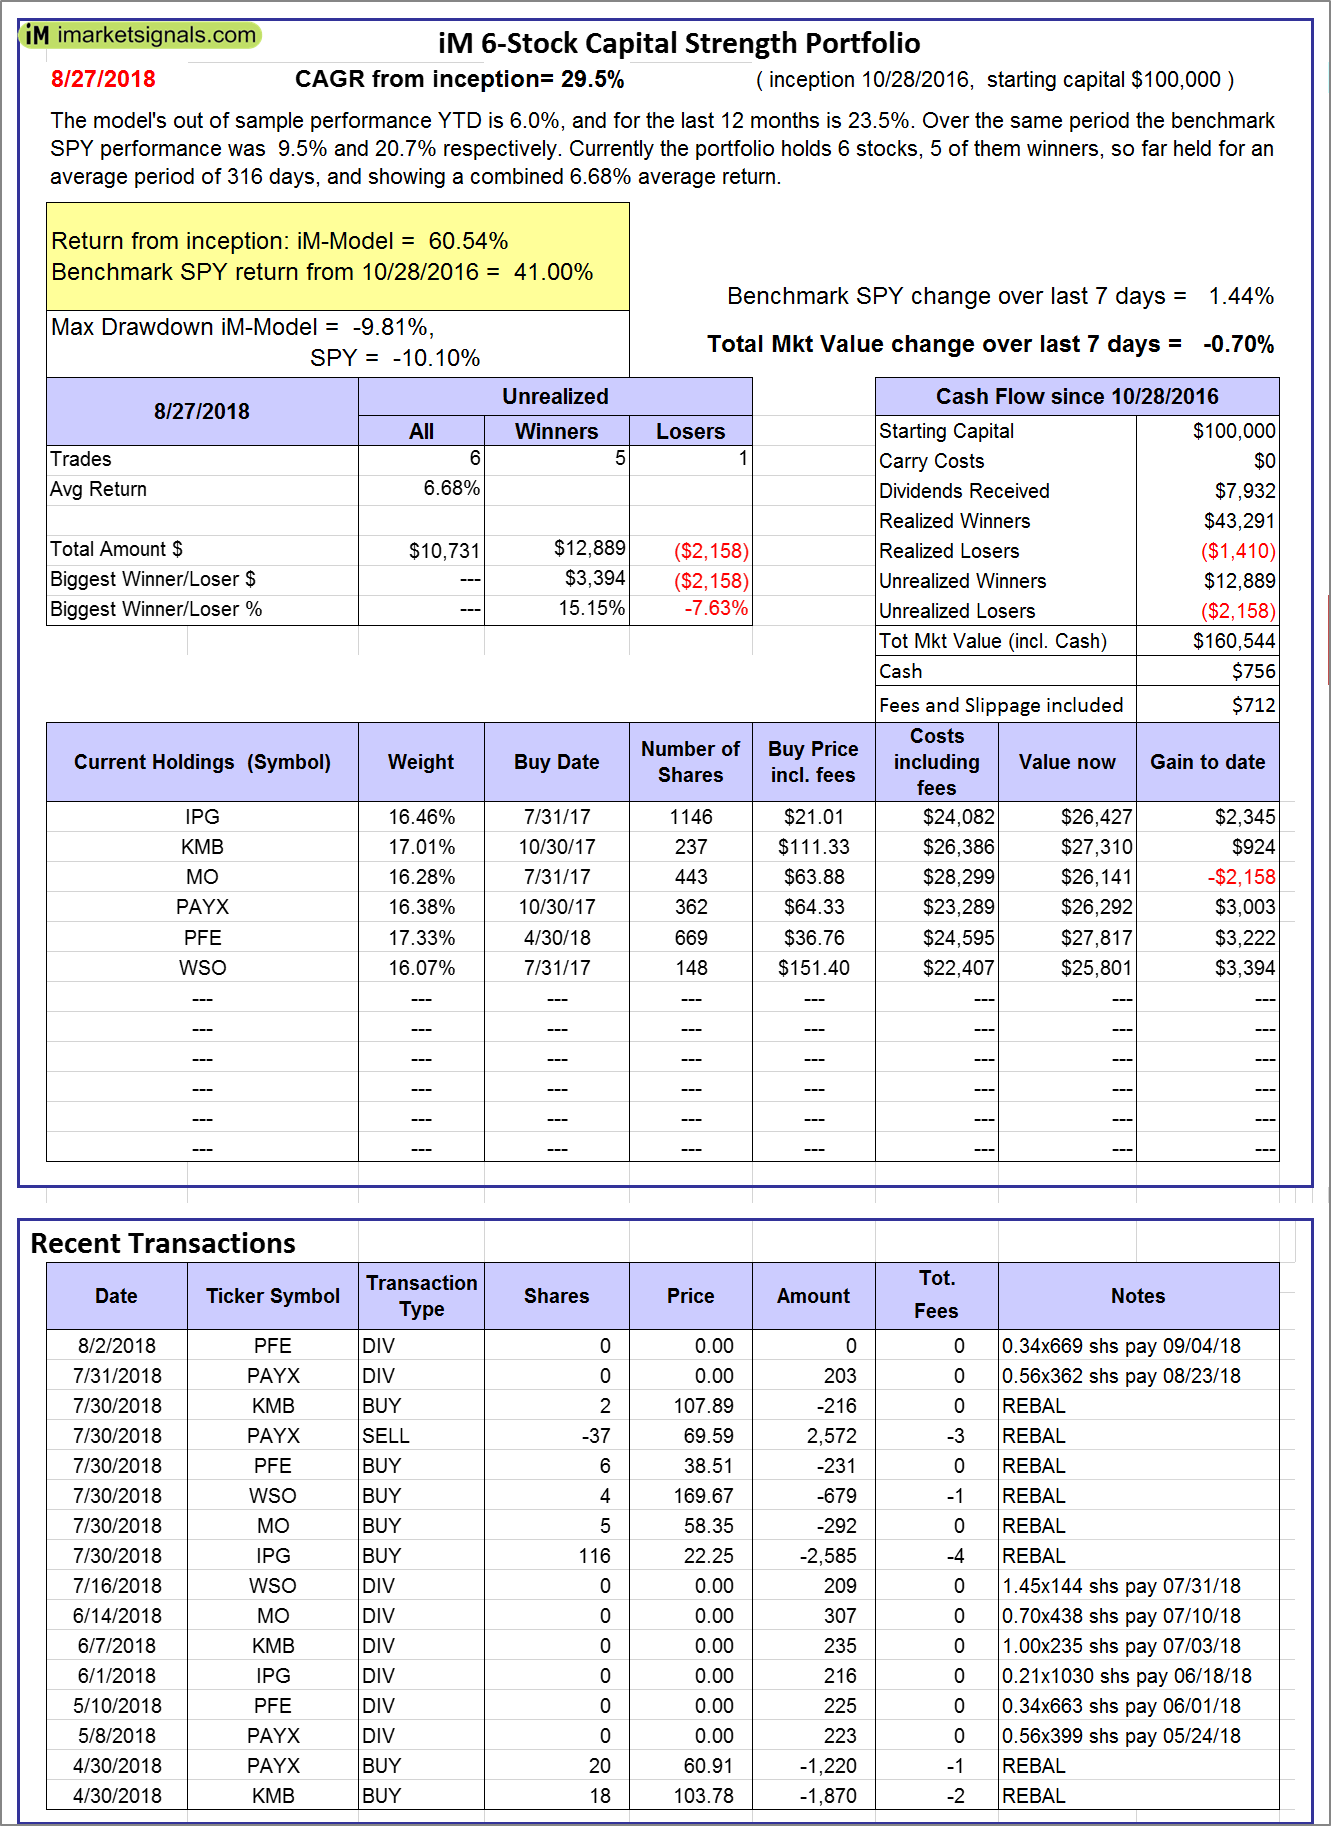
iM 6-Stock Capital Strength Portfolio: The model’s out of sample performance YTD is 6.0%, and for the last 12 months is 23.5%. Over the same period the benchmark SPY performance was 9.5% and 20.7% respectively. Over the previous week the market value of the iM 6-Stock Capital Strength Portfolio gained -0.70% at a time when SPY gained 1.44%. A starting capital of $100,000 at inception on 10/28/2016 would have grown to $160,544 which includes $756 cash and excludes $712 spent on fees and slippage. |
|
|
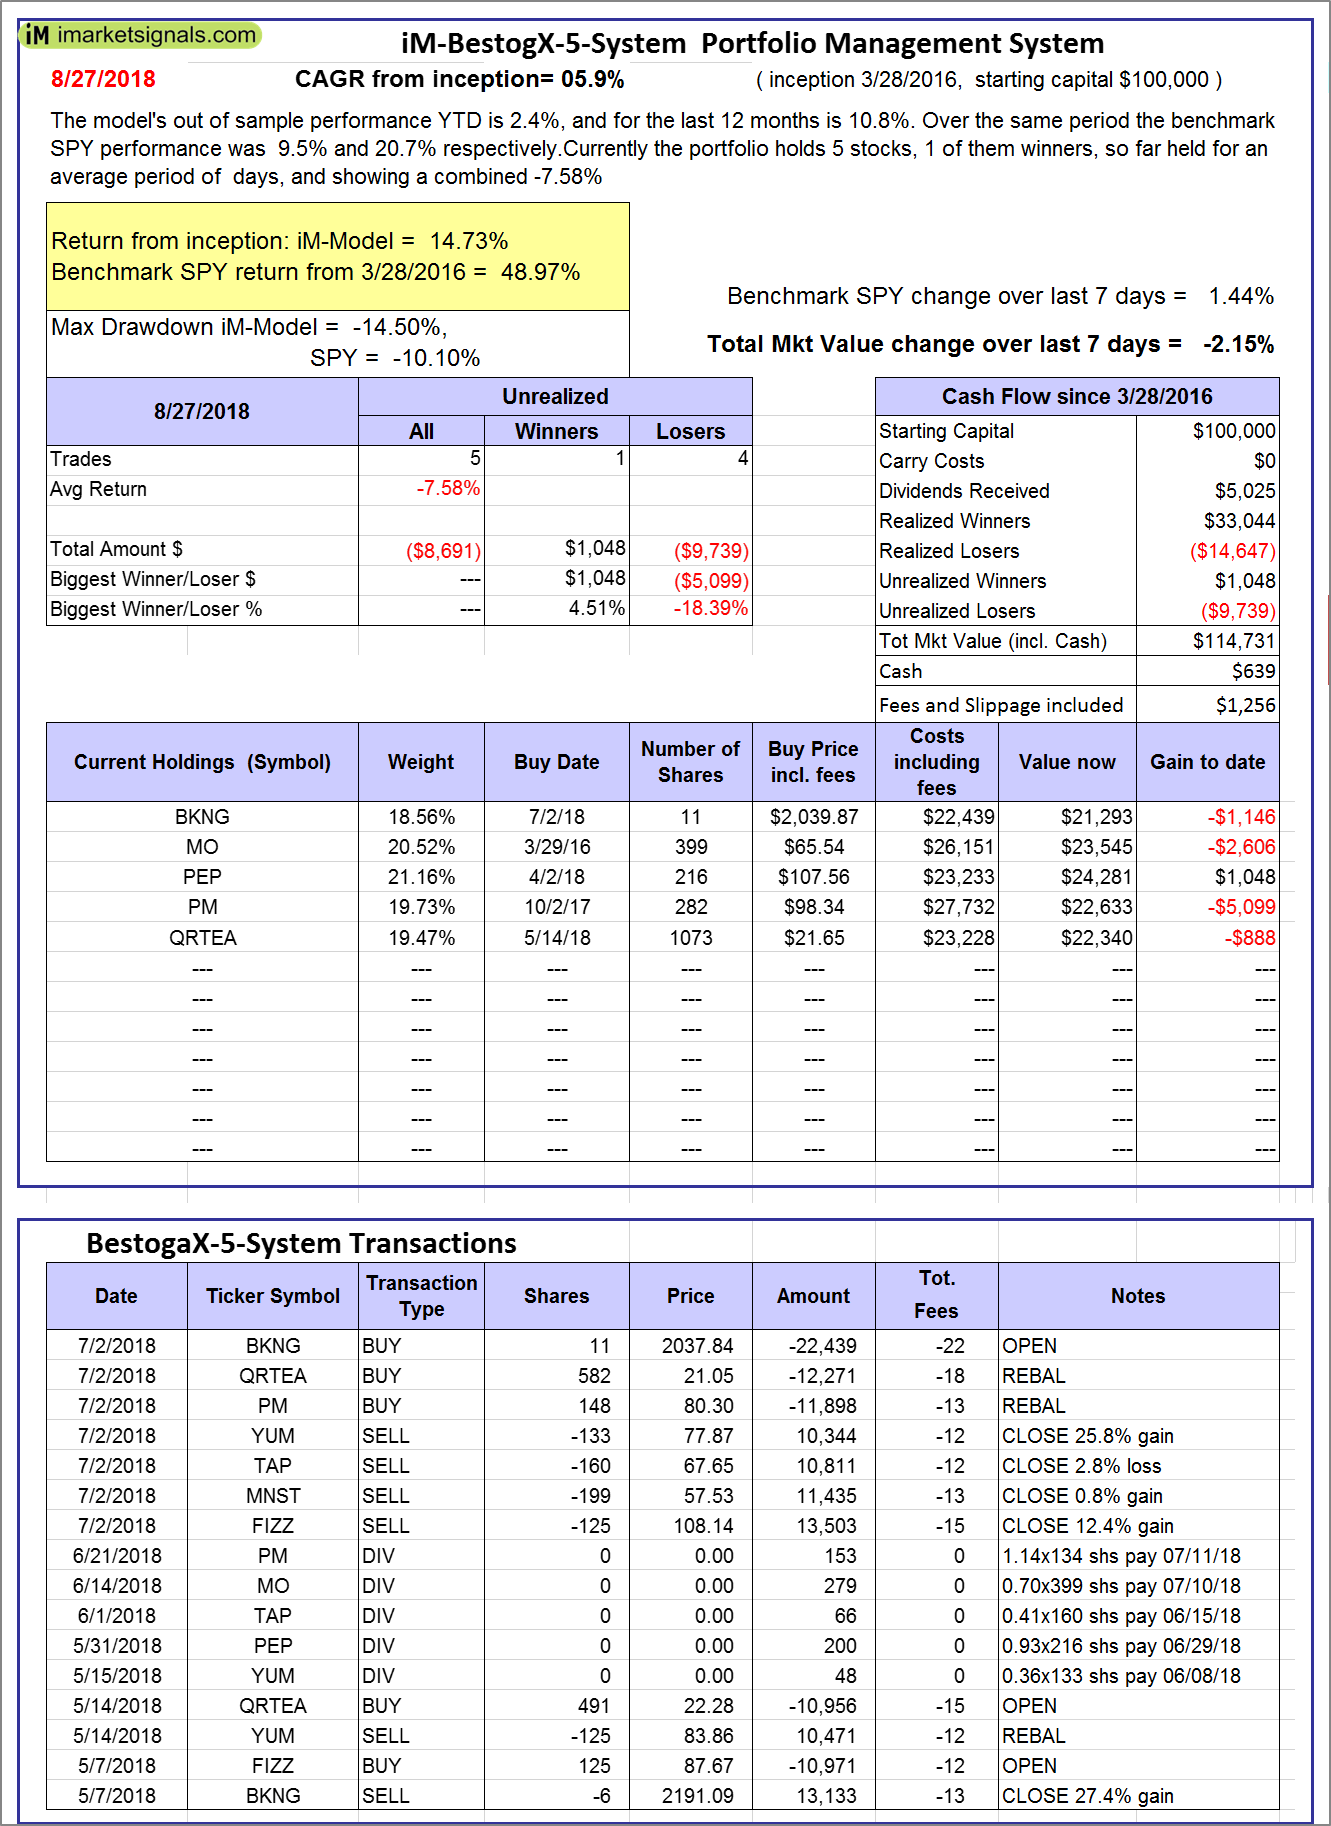
iM-BestogaX5-System: The model’s out of sample performance YTD is 2.4%, and for the last 12 months is 10.8%. Over the same period the benchmark SPY performance was 9.5% and 20.7% respectively. Over the previous week the market value of iM-BestogaX5-System gained -2.15% at a time when SPY gained 1.44%. A starting capital of $100,000 at inception on 3/28/2016 would have grown to $114,731 which includes $639 cash and excludes $1,256 spent on fees and slippage. |
|
|
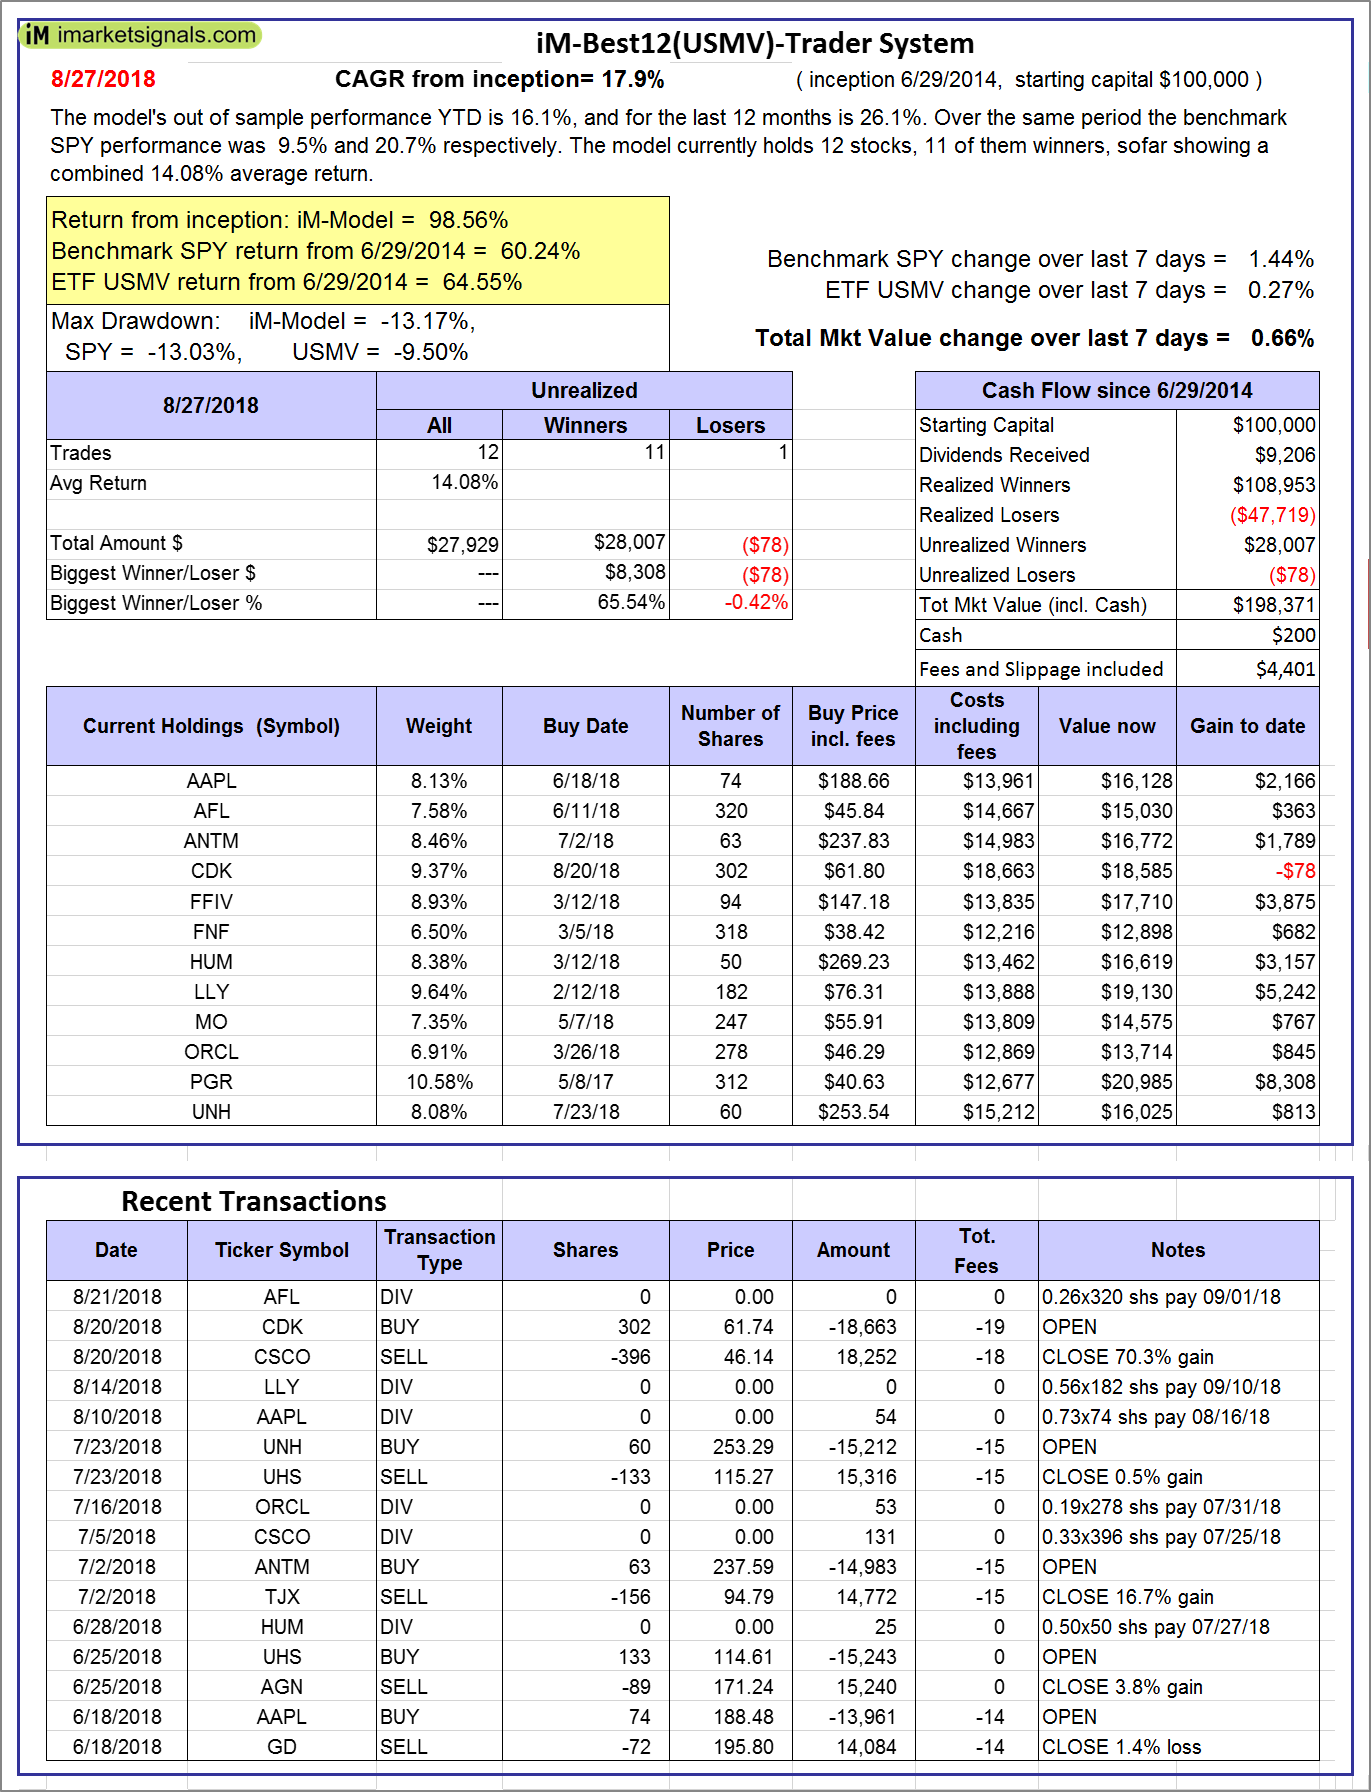
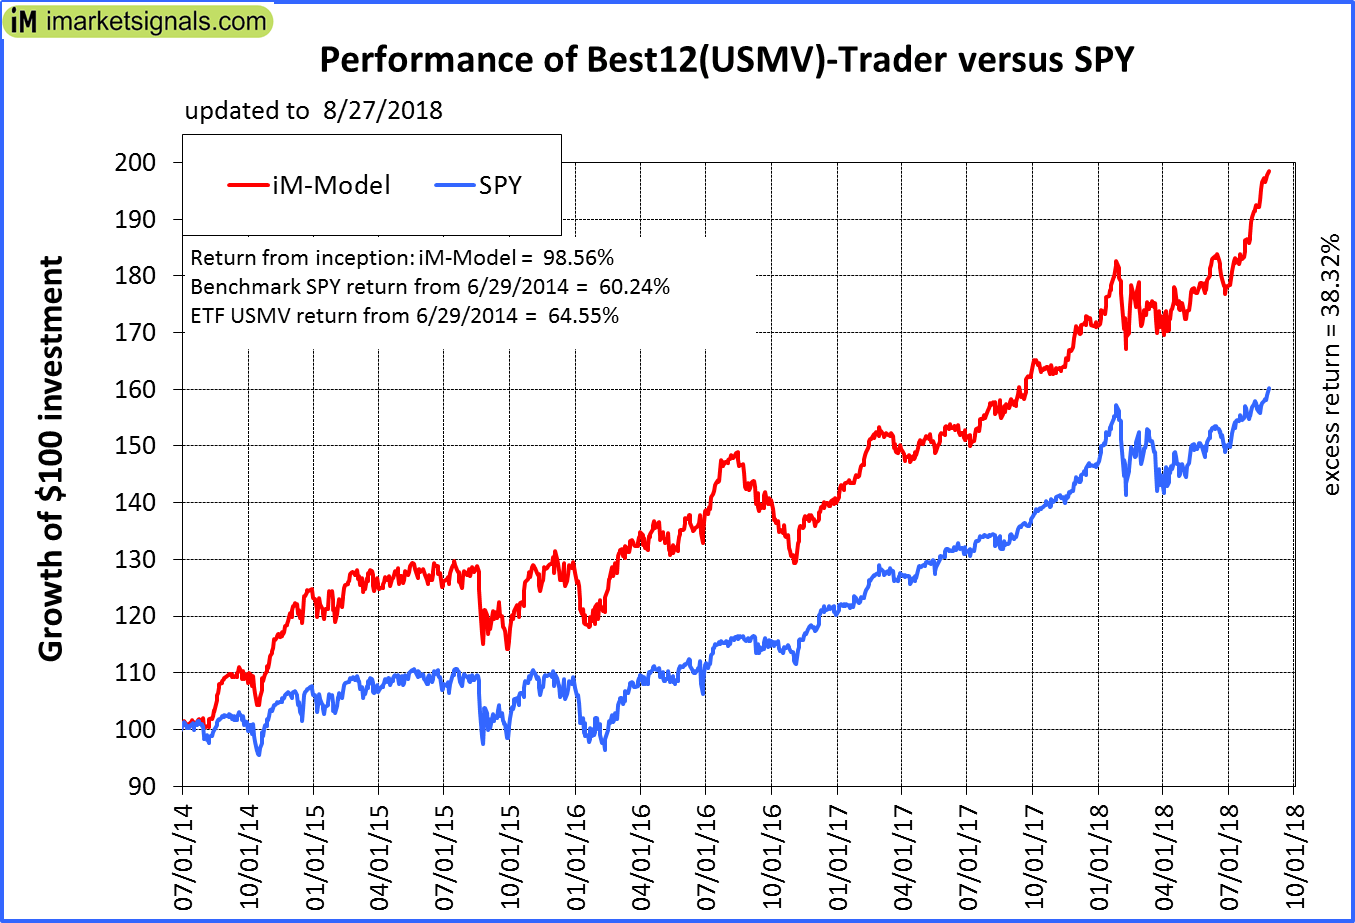
iM-Best12(USMV)-Trader: The model’s out of sample performance YTD is 16.1%, and for the last 12 months is 26.1%. Over the same period the benchmark SPY performance was 9.5% and 20.7% respectively. Since inception, on 6/30/2014, the model gained 98.56% while the benchmark SPY gained 60.24% and the ETF USMV gained 64.55% over the same period. Over the previous week the market value of iM-Best12(USMV)-Trader gained 0.66% at a time when SPY gained 1.44%. A starting capital of $100,000 at inception on 6/30/2014 would have grown to $198,371 which includes $200 cash and excludes $4,401 spent on fees and slippage. |
|
|
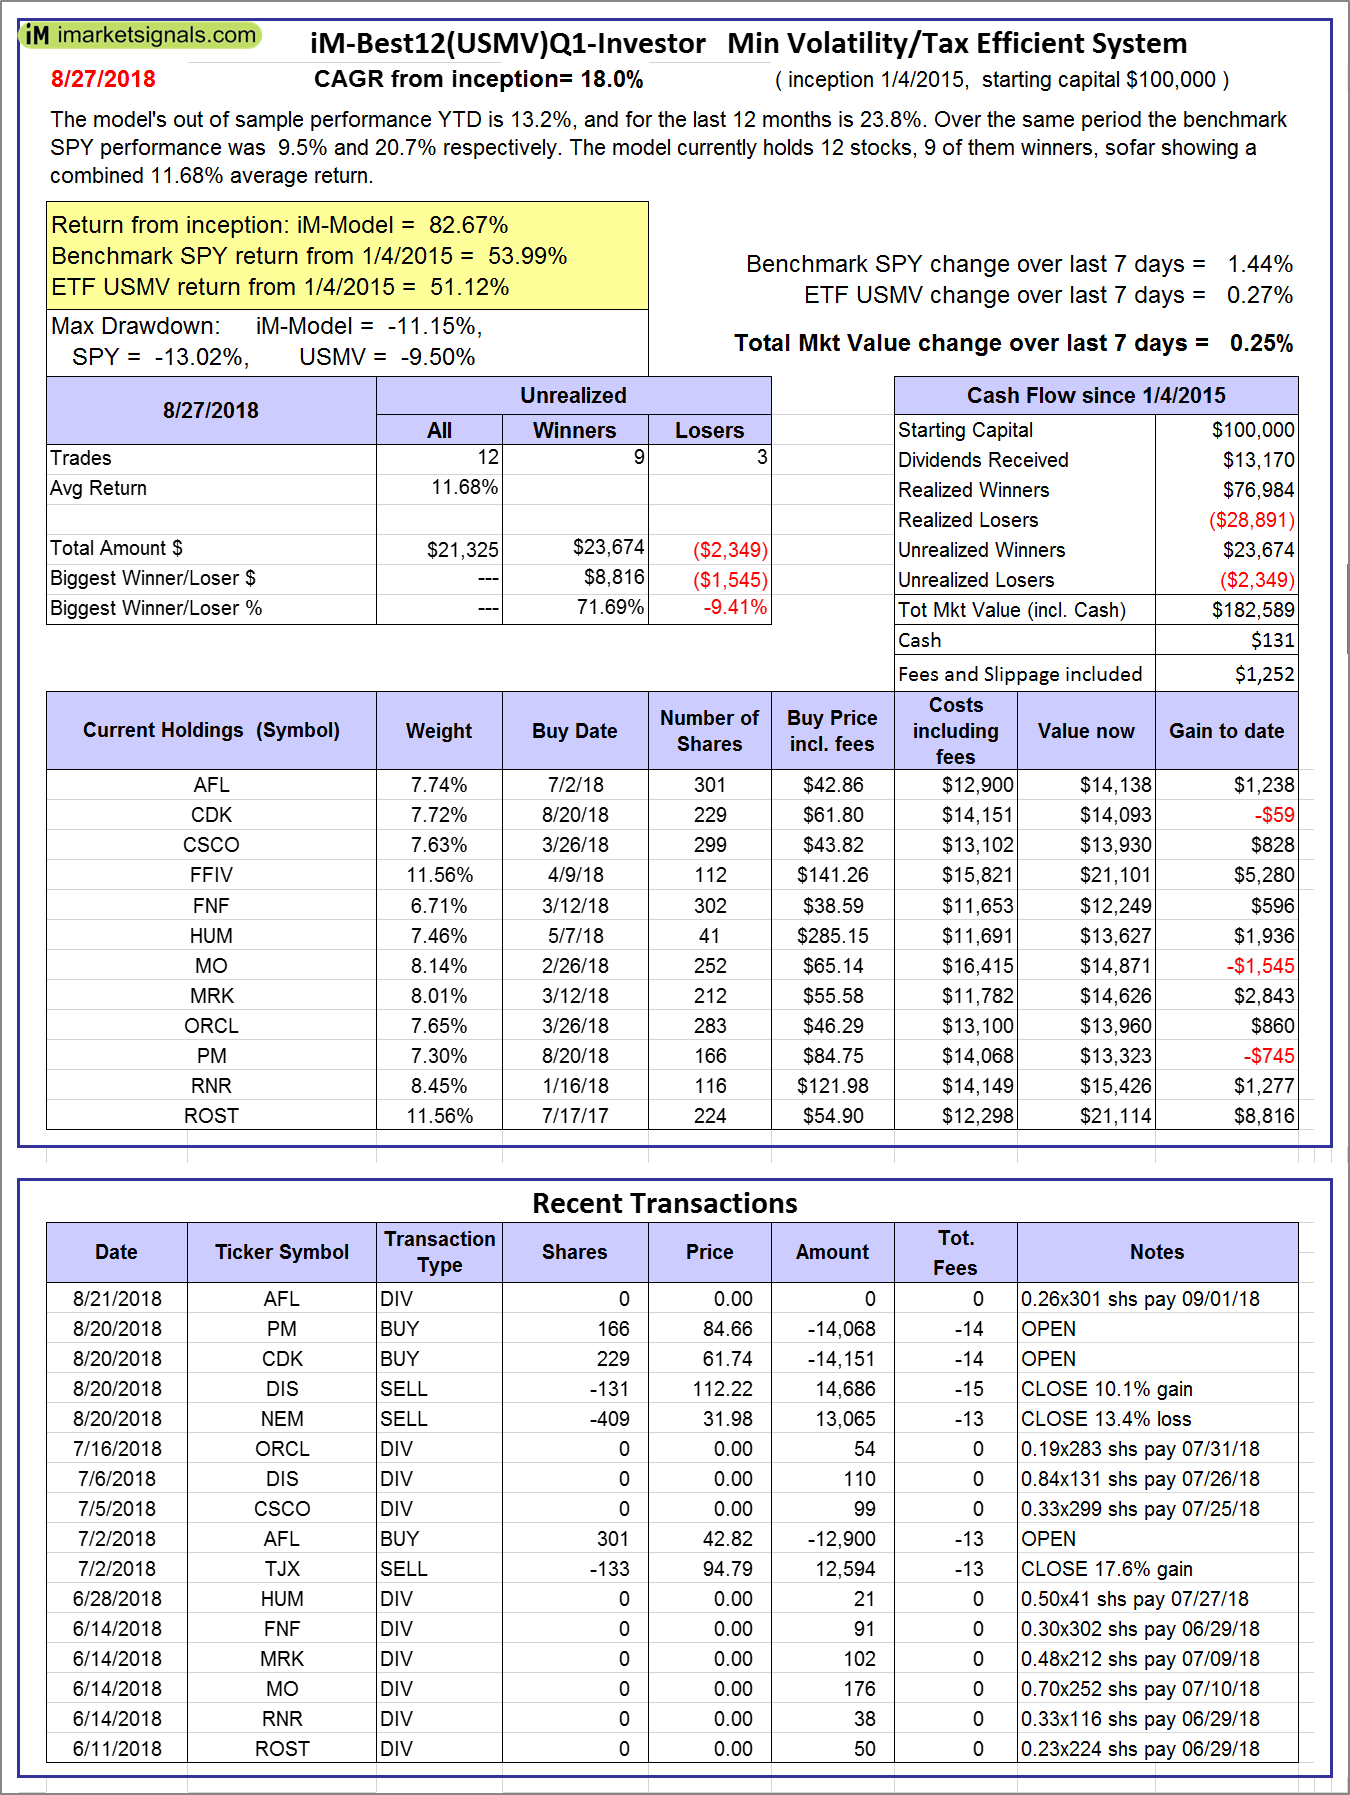
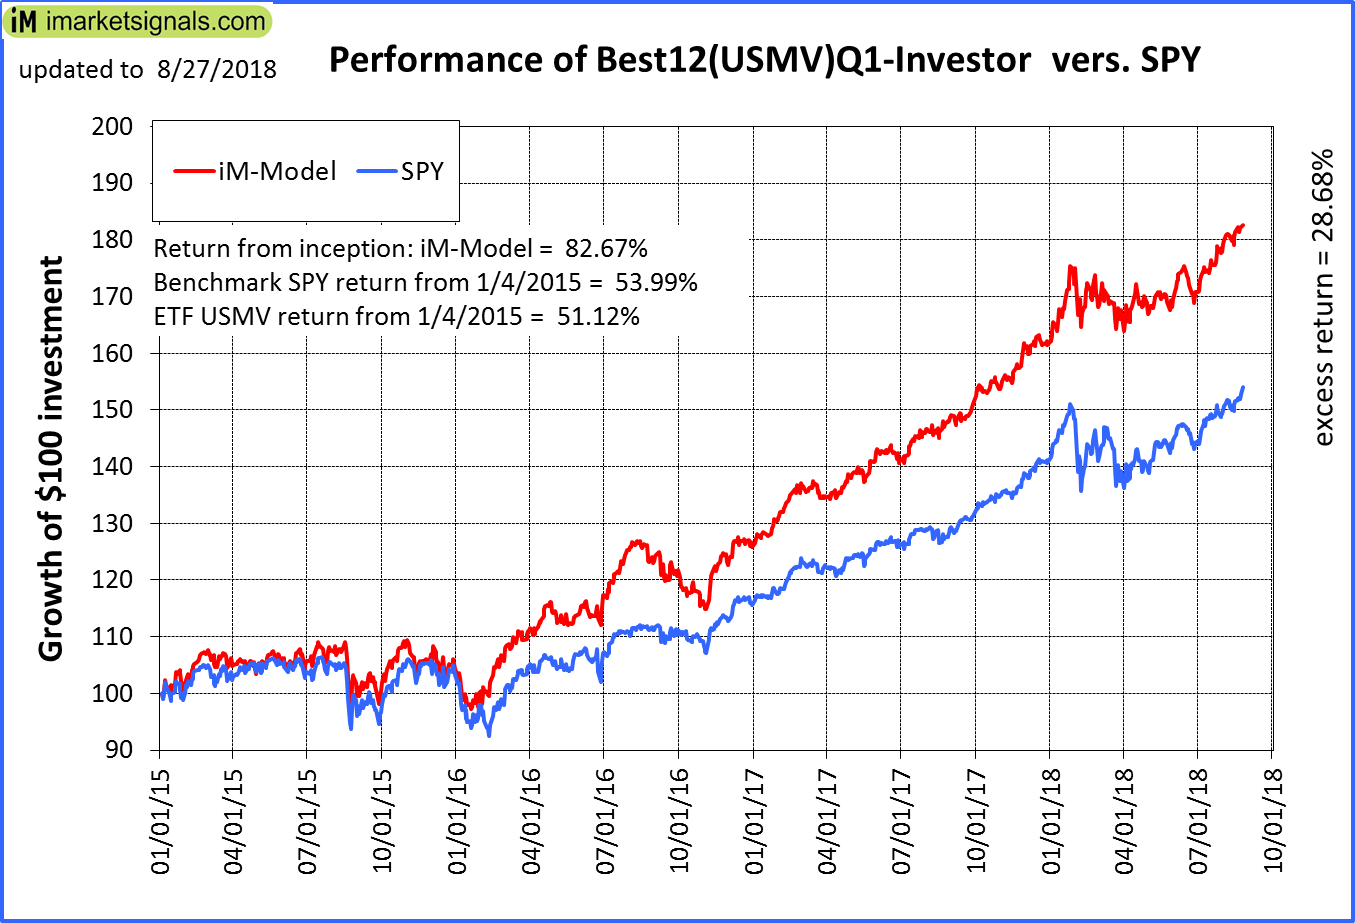
iM-Best12(USMV)Q1-Investor: The model’s out of sample performance YTD is 13.2%, and for the last 12 months is 23.8%. Over the same period the benchmark SPY performance was 9.5% and 20.7% respectively. Since inception, on 1/5/2015, the model gained 82.67% while the benchmark SPY gained 53.99% and the ETF USMV gained 51.12% over the same period. Over the previous week the market value of iM-Best12(USMV)Q1 gained 0.25% at a time when SPY gained 1.44%. A starting capital of $100,000 at inception on 1/5/2015 would have grown to $182,589 which includes $131 cash and excludes $1,252 spent on fees and slippage. |
|
|
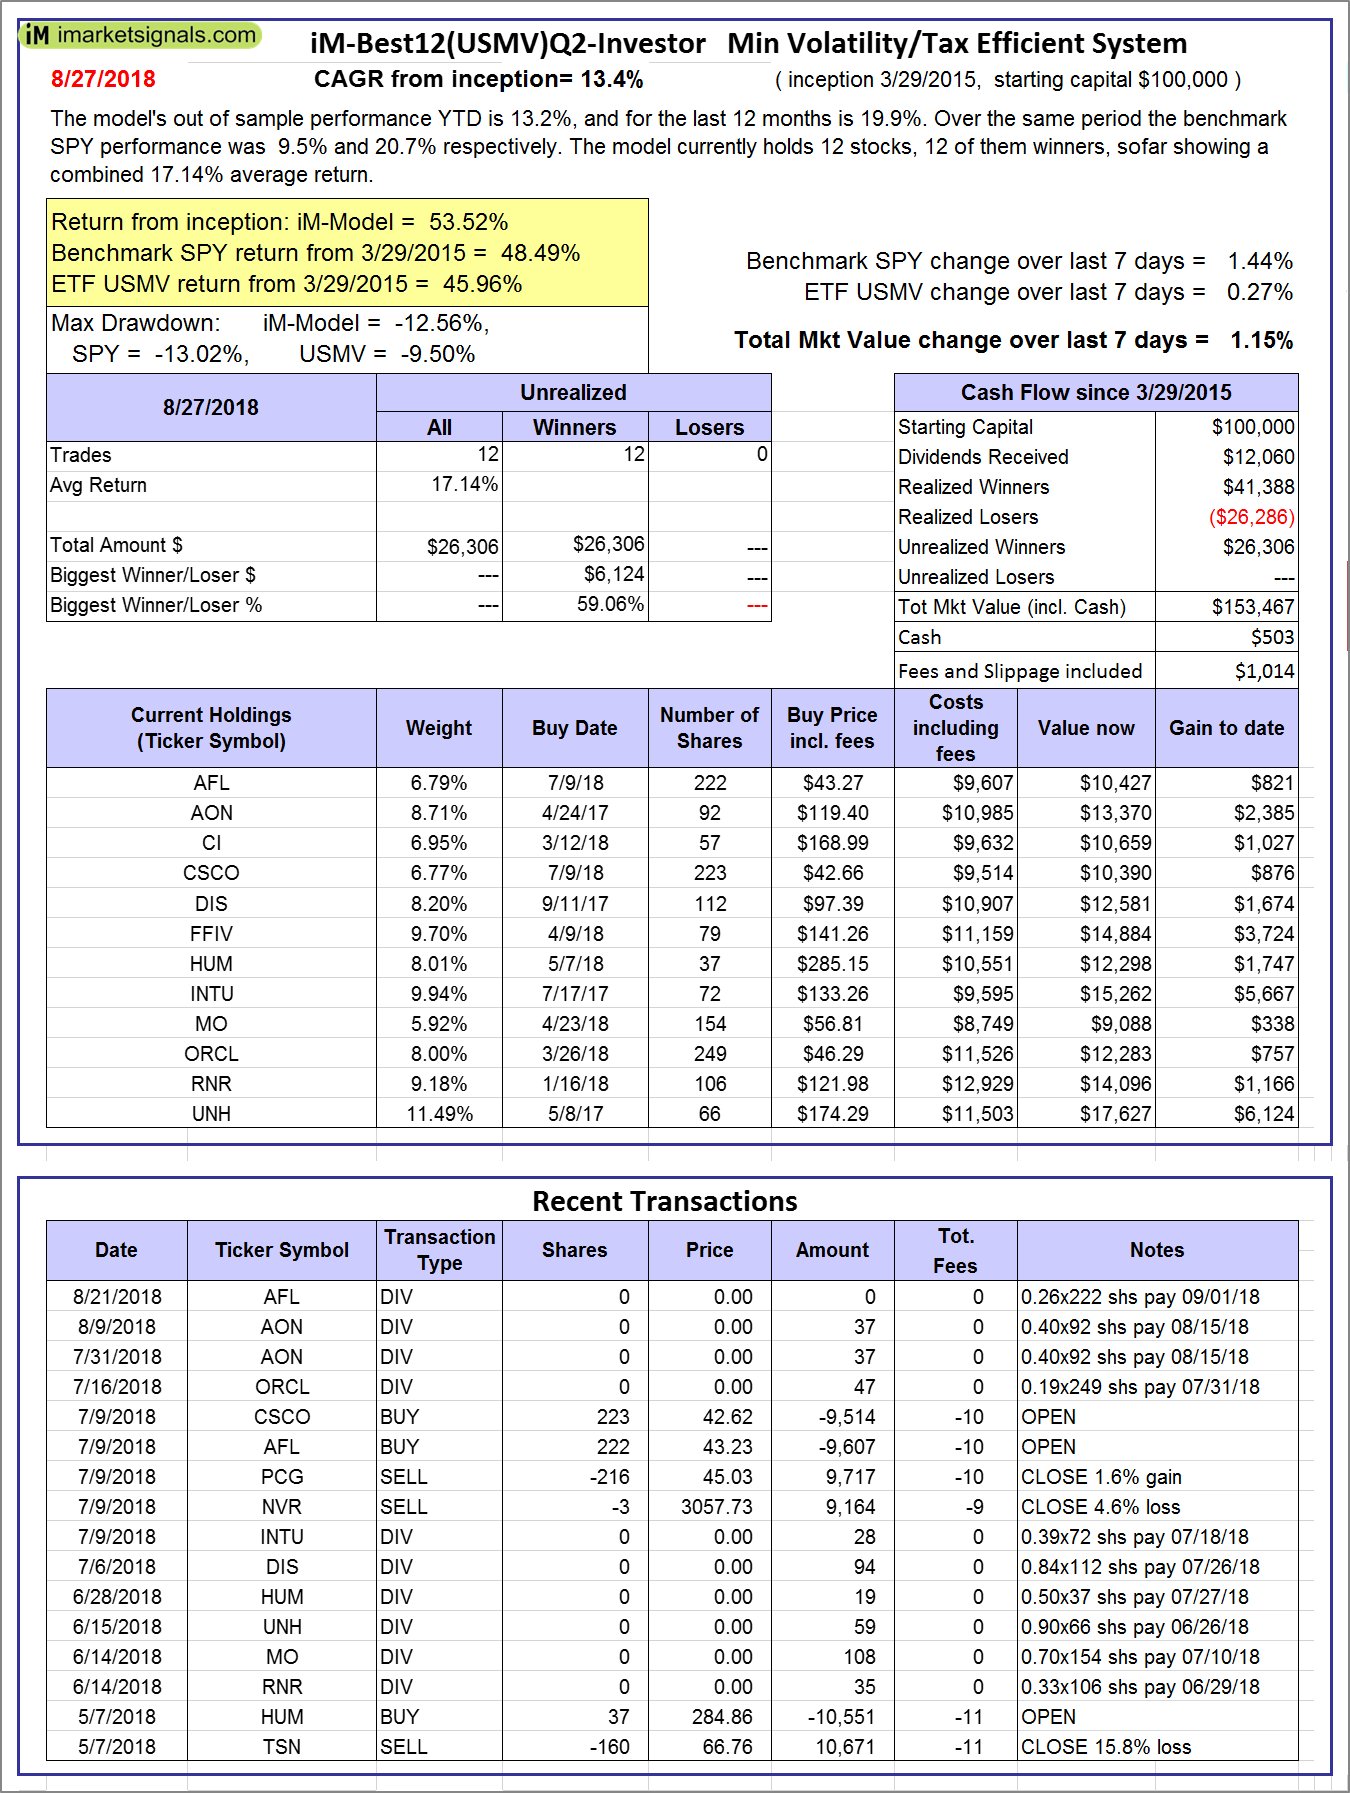
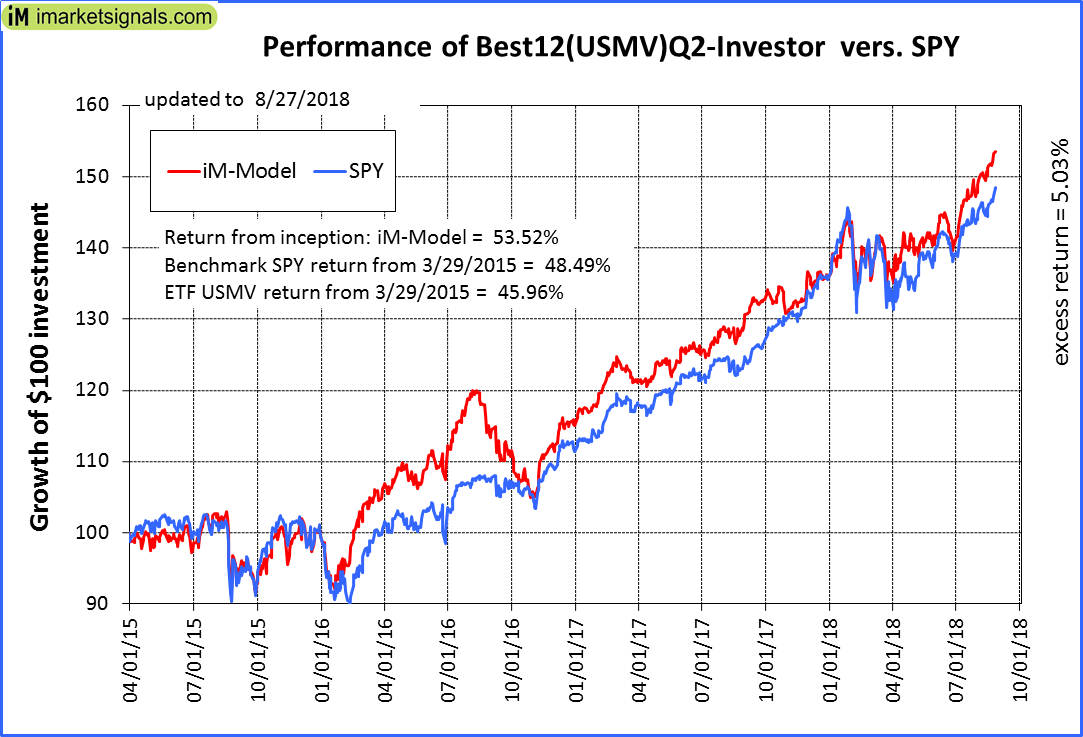
iM-Best12(USMV)Q2-Investor: The model’s out of sample performance YTD is 13.2%, and for the last 12 months is 19.9%. Over the same period the benchmark SPY performance was 9.5% and 20.7% respectively. Since inception, on 3/30/2015, the model gained 53.52% while the benchmark SPY gained 48.49% and the ETF USMV gained 45.96% over the same period. Over the previous week the market value of iM-Best12(USMV)Q2 gained 1.15% at a time when SPY gained 1.44%. A starting capital of $100,000 at inception on 3/30/2015 would have grown to $153,467 which includes $503 cash and excludes $1,014 spent on fees and slippage. |
|
|
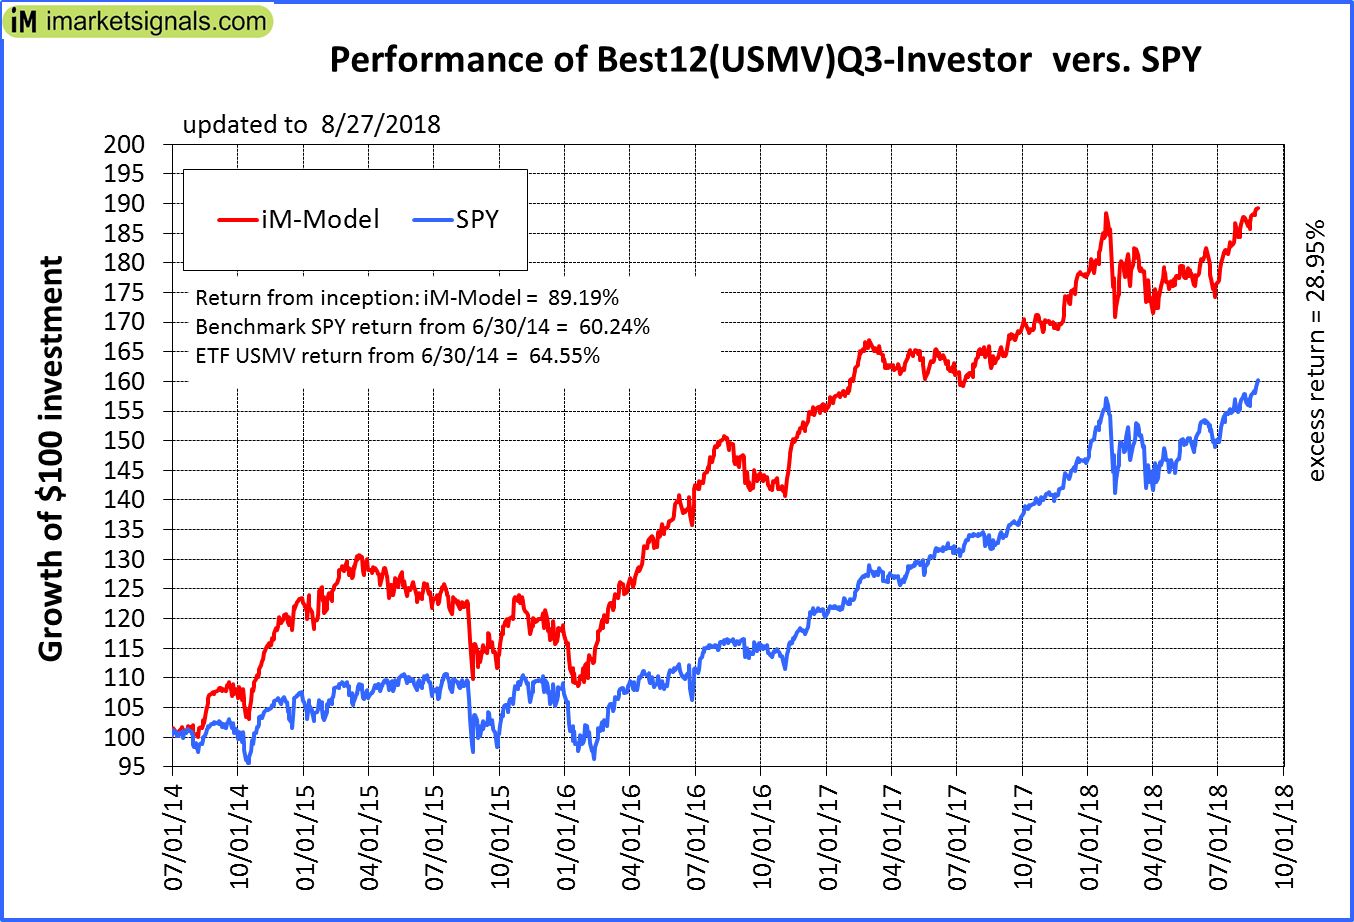
iM-Best12(USMV)Q3-Investor: The model’s out of sample performance YTD is 6.5%, and for the last 12 months is 15.6%. Over the same period the benchmark SPY performance was 9.5% and 20.7% respectively. Since inception, on 7/1/2014, the model gained 89.19% while the benchmark SPY gained 60.24% and the ETF USMV gained 64.55% over the same period. Over the previous week the market value of iM-Best12(USMV)Q3 gained 0.48% at a time when SPY gained 1.44%. A starting capital of $100,000 at inception on 7/1/2014 would have grown to $189,113 which includes $66 cash and excludes $1,584 spent on fees and slippage. |
|
|
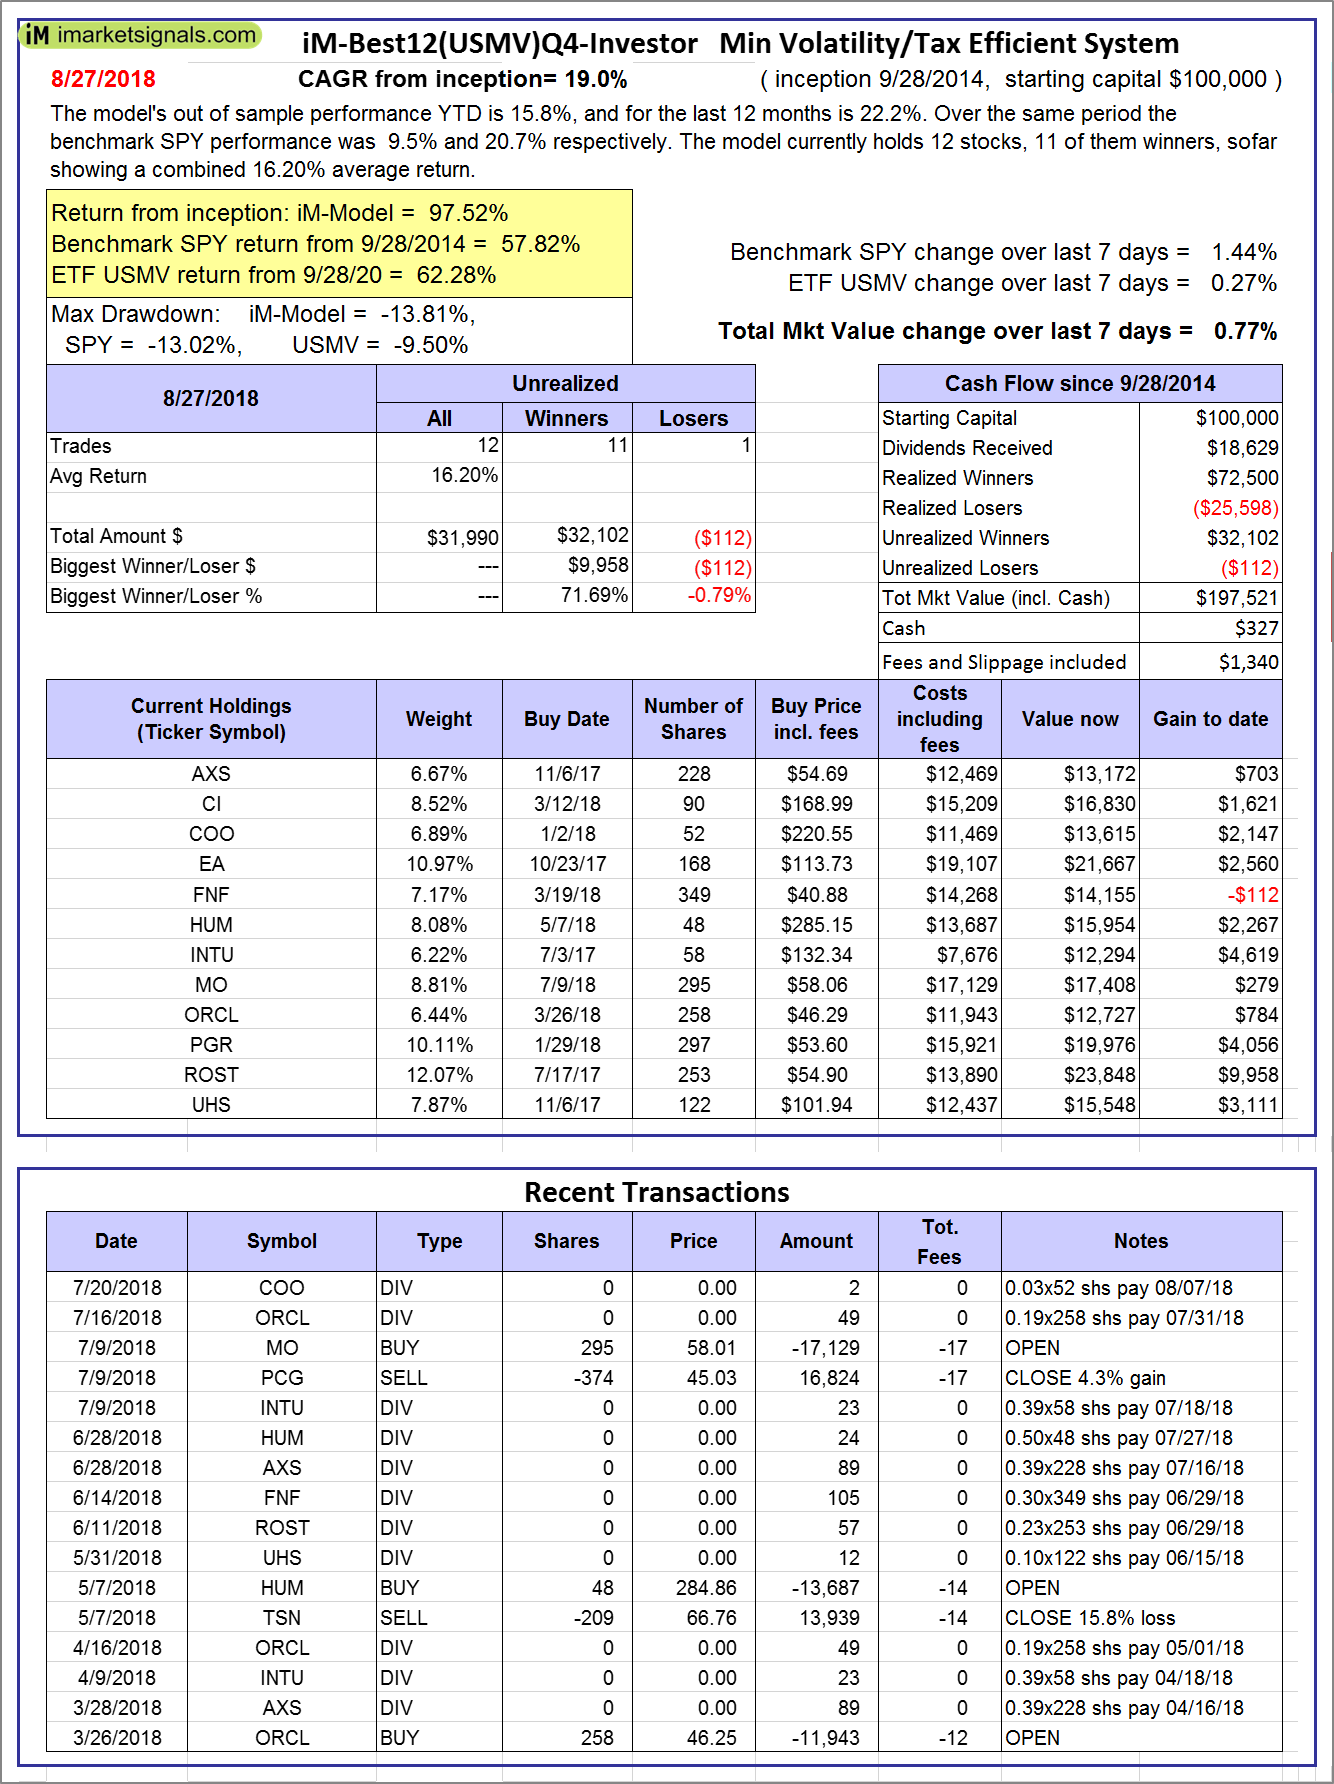
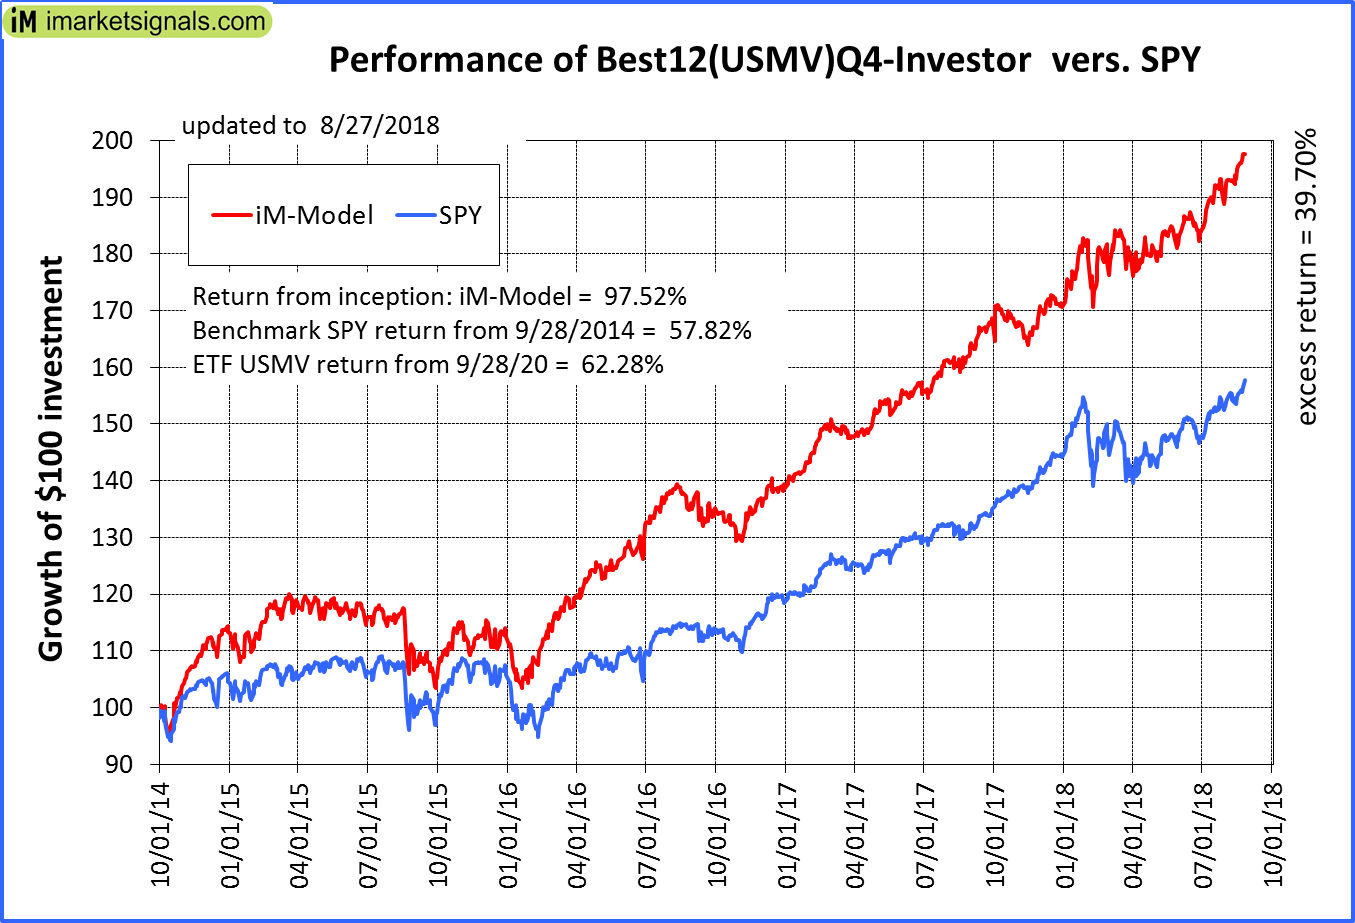
iM-Best12(USMV)Q4-Investor: Since inception, on 9/29/2014, the model gained 97.52% while the benchmark SPY gained 57.82% and the ETF USMV gained 62.28% over the same period. Over the previous week the market value of iM-Best12(USMV)Q4 gained 0.77% at a time when SPY gained 1.44%. A starting capital of $100,000 at inception on 9/29/2014 would have grown to $197,521 which includes $327 cash and excludes $1,340 spent on fees and slippage. |
|
|
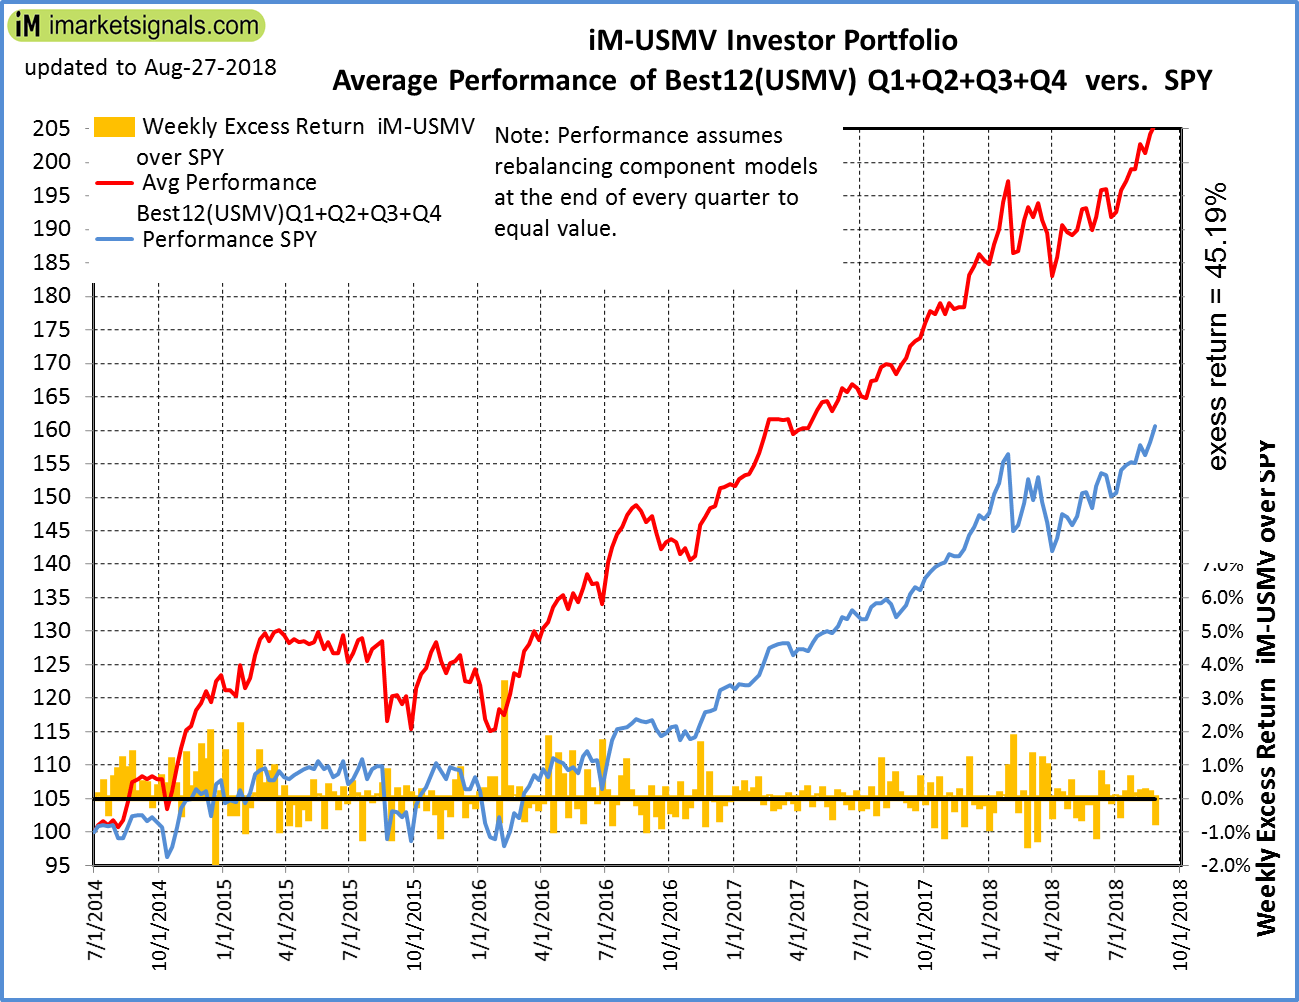
Average Performance of iM-Best12(USMV)Q1+Q2+Q3+Q4-Investor resulted in an excess return of 45.19% over SPY. (see iM-USMV Investor Portfolio) |
|
|
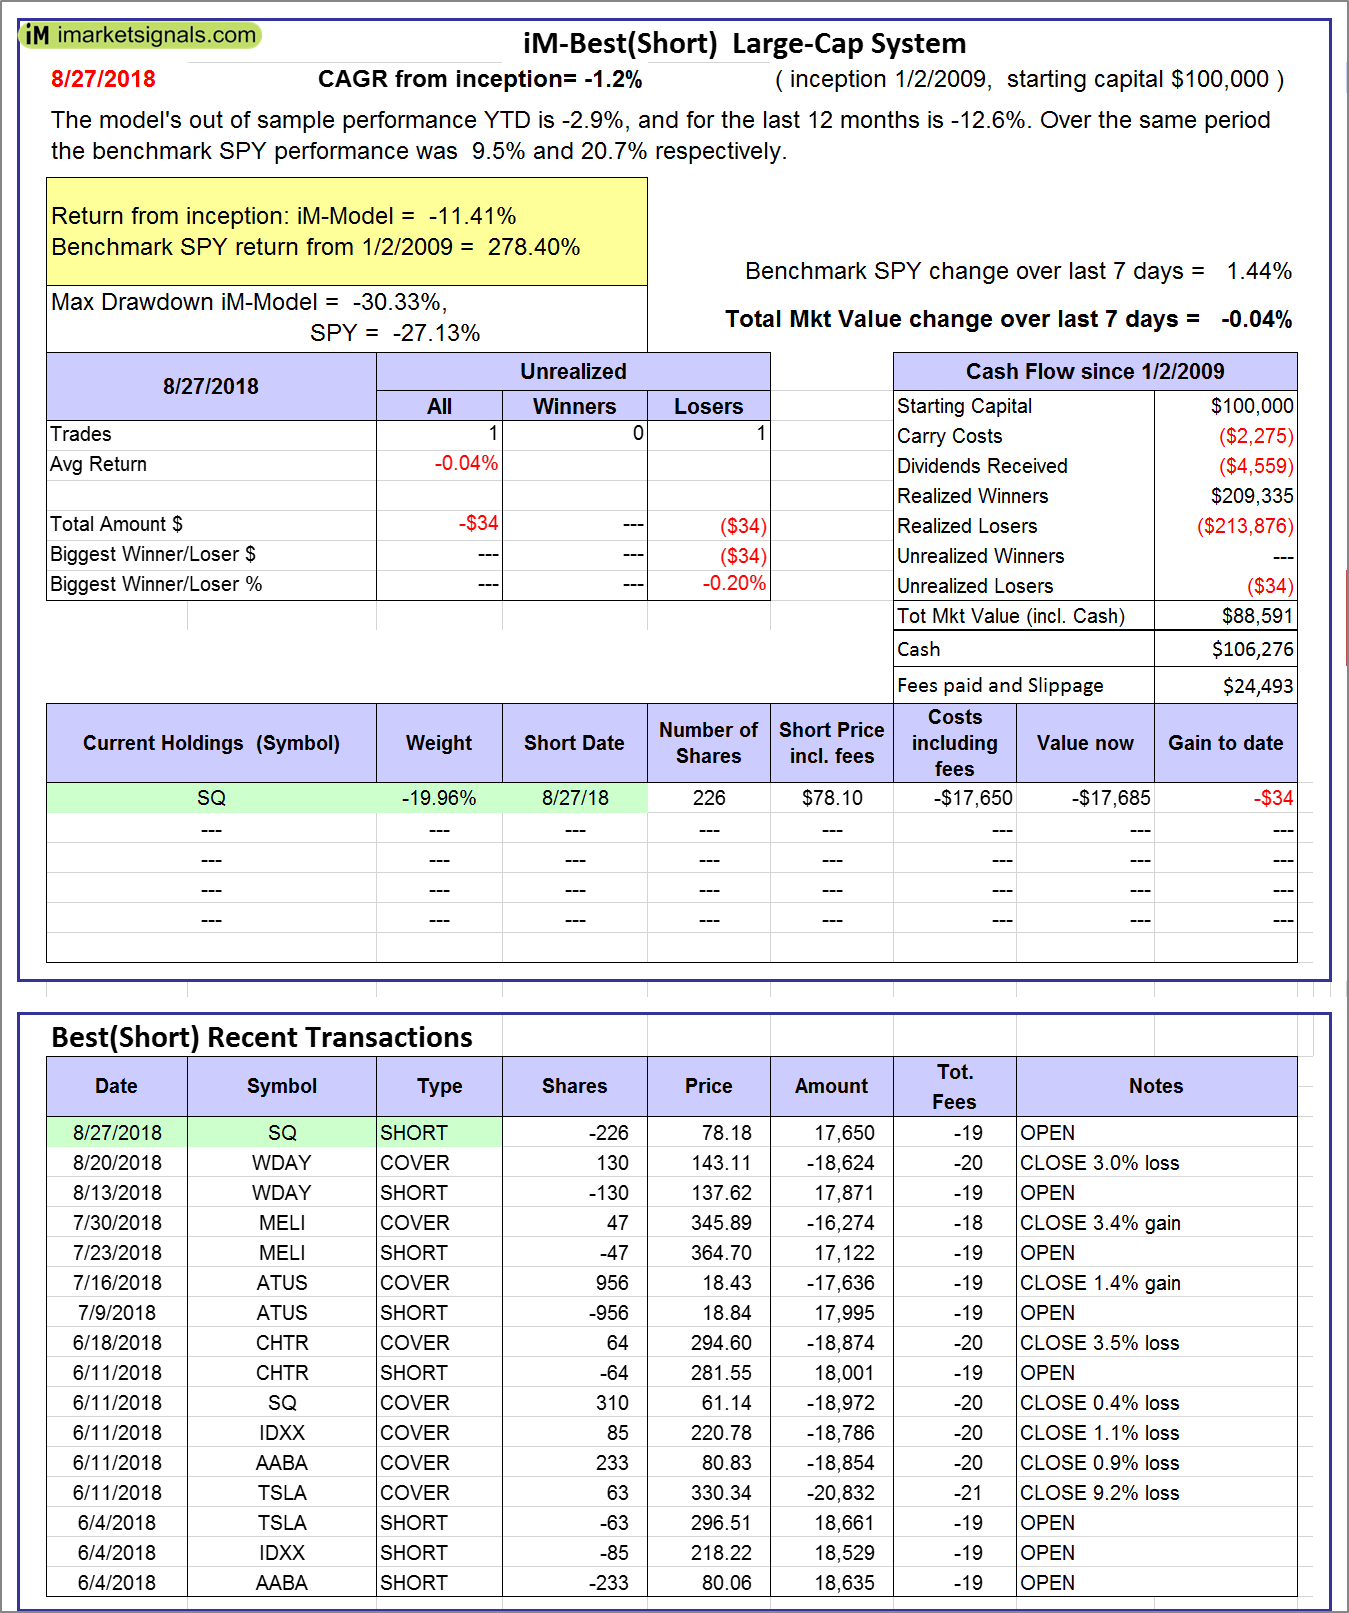
iM-Best(Short): The model’s out of sample performance YTD is -2.9%, and for the last 12 months is -12.6%. Over the same period the benchmark SPY performance was 9.5% and 20.7% respectively. Over the previous week the market value of iM-Best(Short) gained -0.04% at a time when SPY gained 1.44%. Over the period 1/2/2009 to 8/27/2018 the starting capital of $100,000 would have grown to $88,591 which includes $106,276 cash and excludes $24,493 spent on fees and slippage. |
|
|
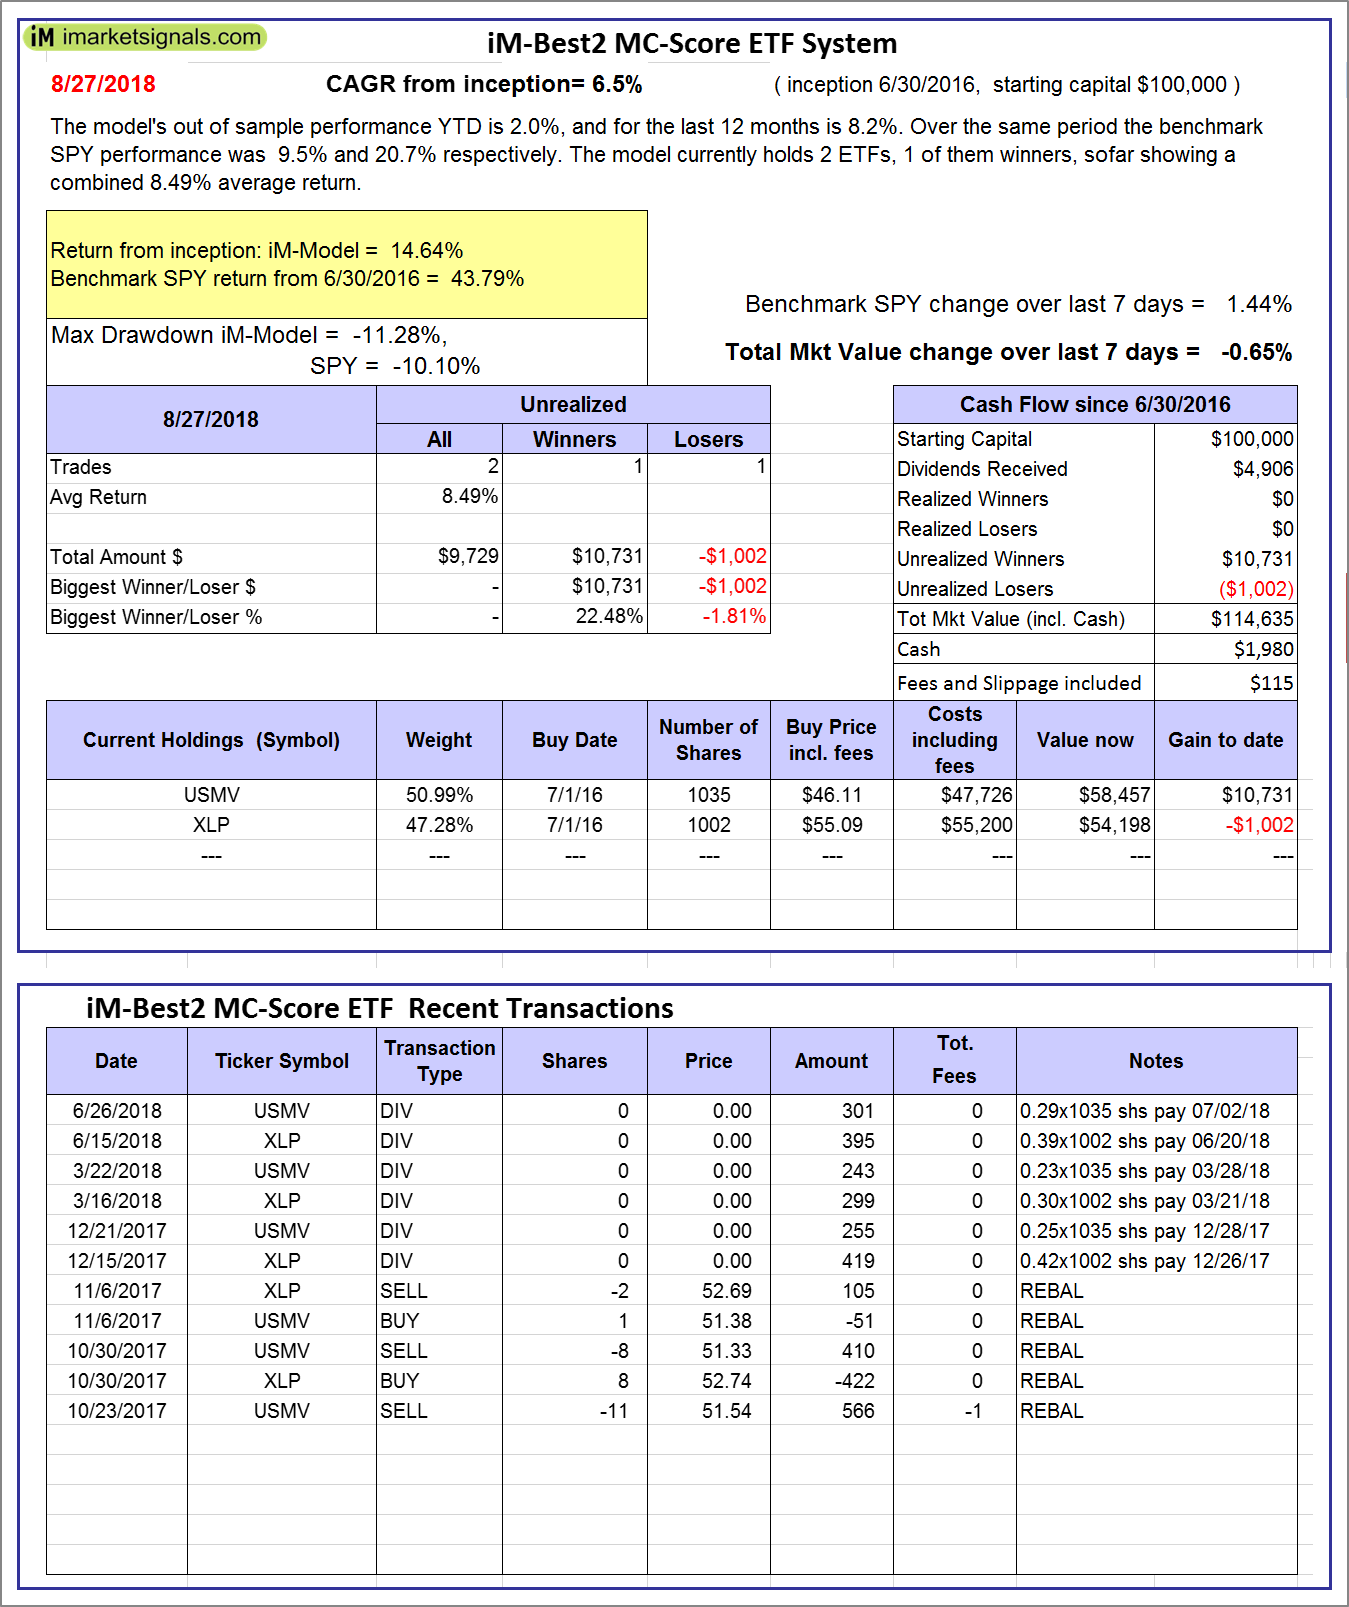
iM-Best2 MC-Score ETF System: The model’s out of sample performance YTD is 2.0%, and for the last 12 months is 8.2%. Over the same period the benchmark SPY performance was 9.5% and 20.7% respectively. Over the previous week the market value of the iM-Best2 MC-Score ETF System gained -0.65% at a time when SPY gained 1.44%. A starting capital of $100,000 at inception on 6/30/2016 would have grown to $114,635 which includes $1,980 cash and excludes $115 spent on fees and slippage. |
|
|
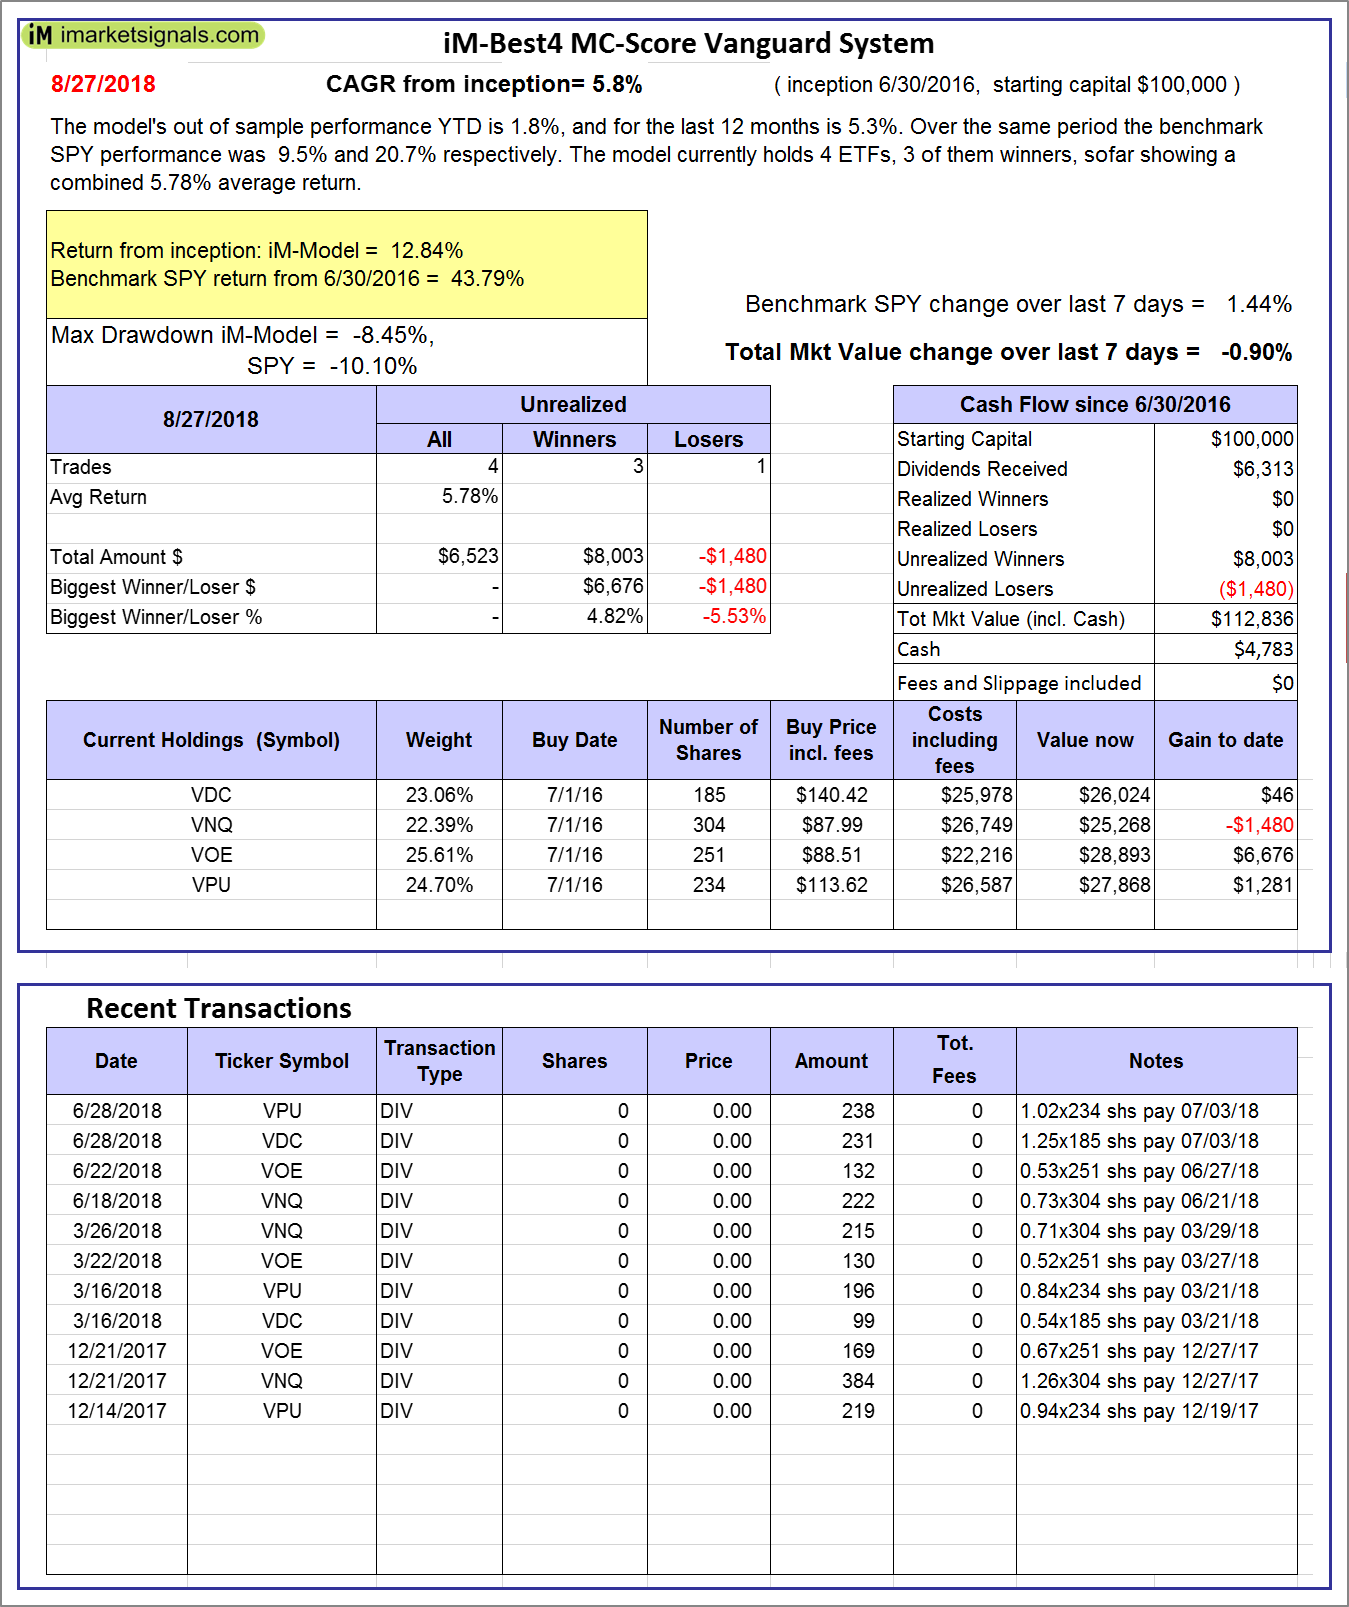
iM-Best4 MC-Score Vanguard System: The model’s out of sample performance YTD is 1.8%, and for the last 12 months is 5.3%. Over the same period the benchmark SPY performance was 9.5% and 20.7% respectively. Over the previous week the market value of the iM-Best4 MC-Score Vanguard System gained -0.90% at a time when SPY gained 1.44%. A starting capital of $100,000 at inception on 6/30/2016 would have grown to $112,836 which includes $4,783 cash and excludes $00 spent on fees and slippage. |
|
|
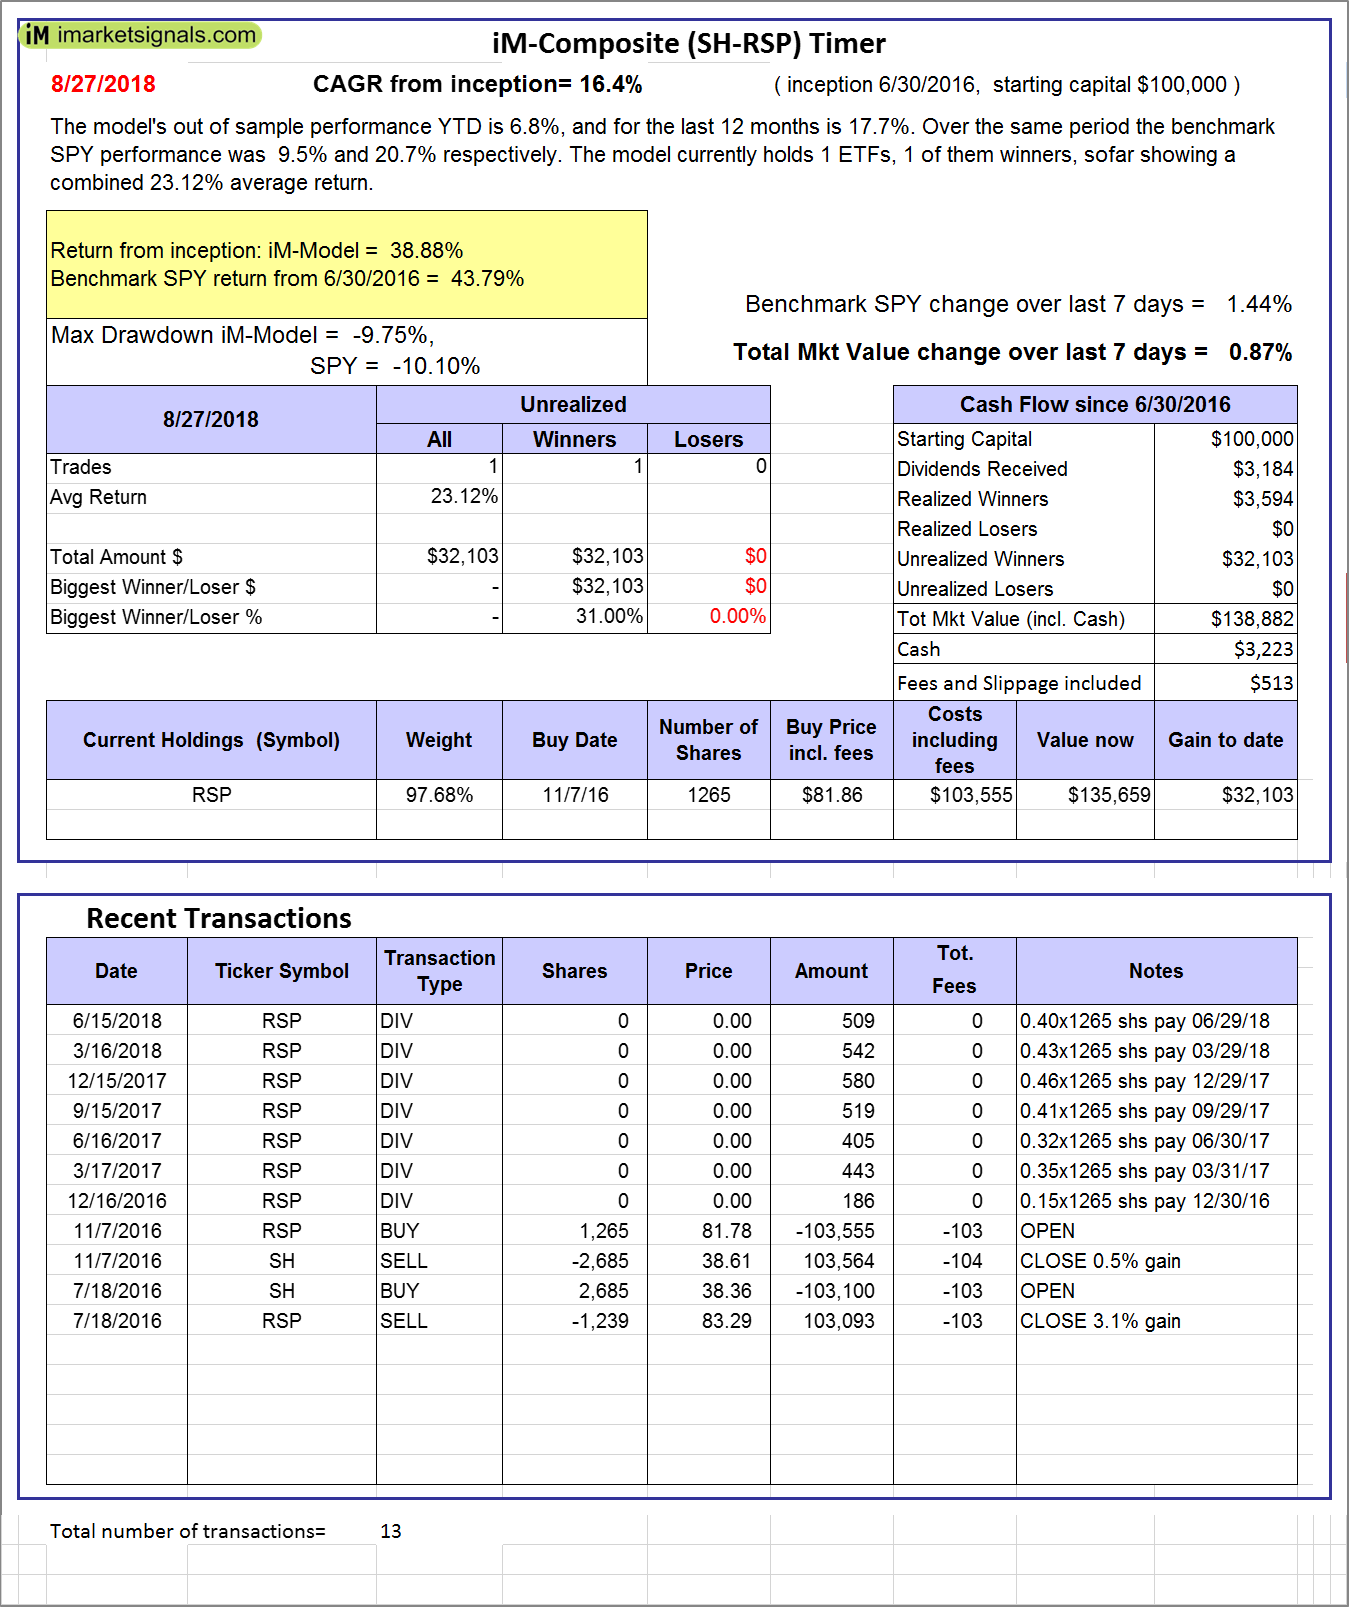
iM-Composite (SH-RSP) Timer: The model’s out of sample performance YTD is 6.8%, and for the last 12 months is 17.7%. Over the same period the benchmark SPY performance was 9.5% and 20.7% respectively. Over the previous week the market value of the iM-Composite (SH-RSP) Timer gained 0.87% at a time when SPY gained 1.44%. A starting capital of $100,000 at inception on 6/30/2016 would have grown to $138,882 which includes $3,223 cash and excludes $513 spent on fees and slippage. |
|
|
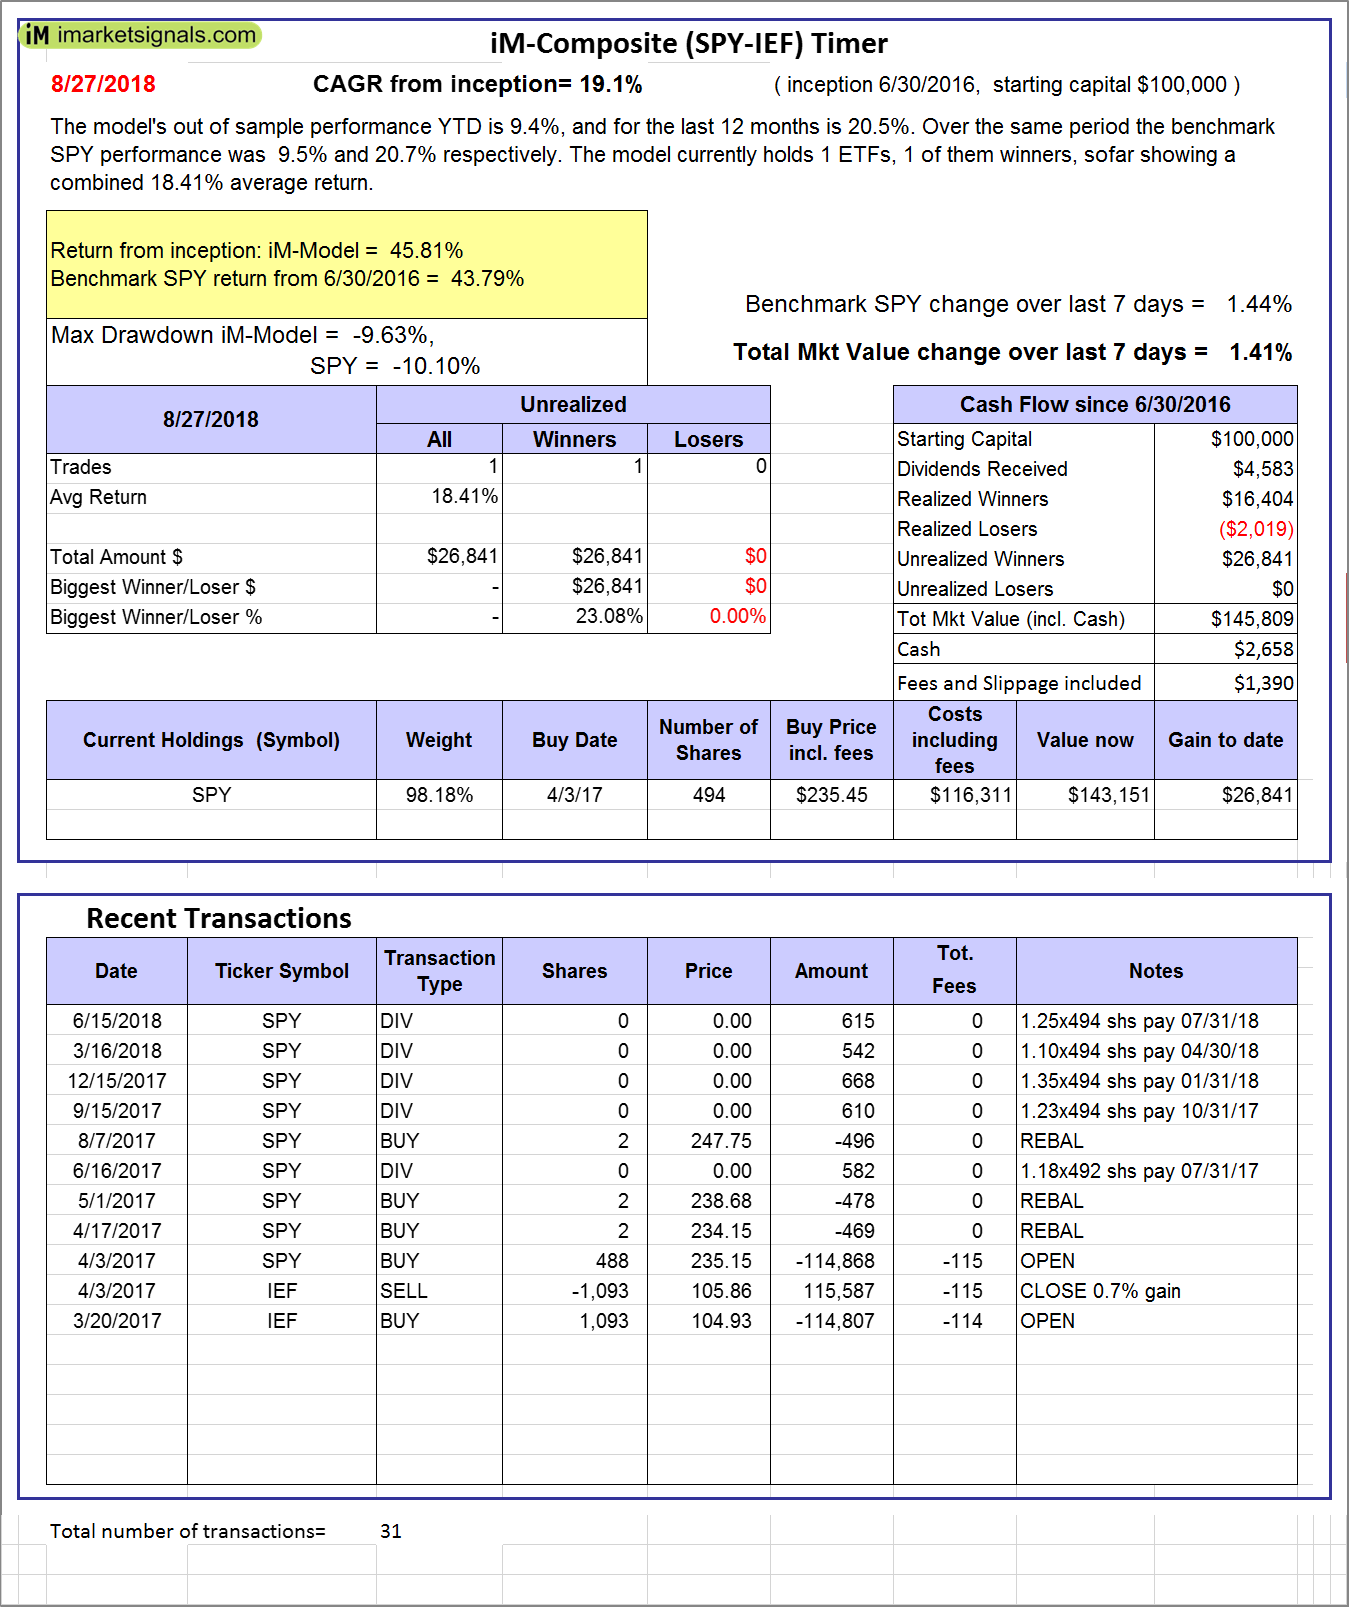
iM-Composite (SPY-IEF) Timer: The model’s out of sample performance YTD is 9.4%, and for the last 12 months is 20.5%. Over the same period the benchmark SPY performance was 9.5% and 20.7% respectively. Over the previous week the market value of the iM-Composite (SPY-IEF) Timer gained 1.41% at a time when SPY gained 1.44%. A starting capital of $100,000 at inception on 6/30/2016 would have grown to $145,809 which includes $2,658 cash and excludes $1,390 spent on fees and slippage. |
|
|
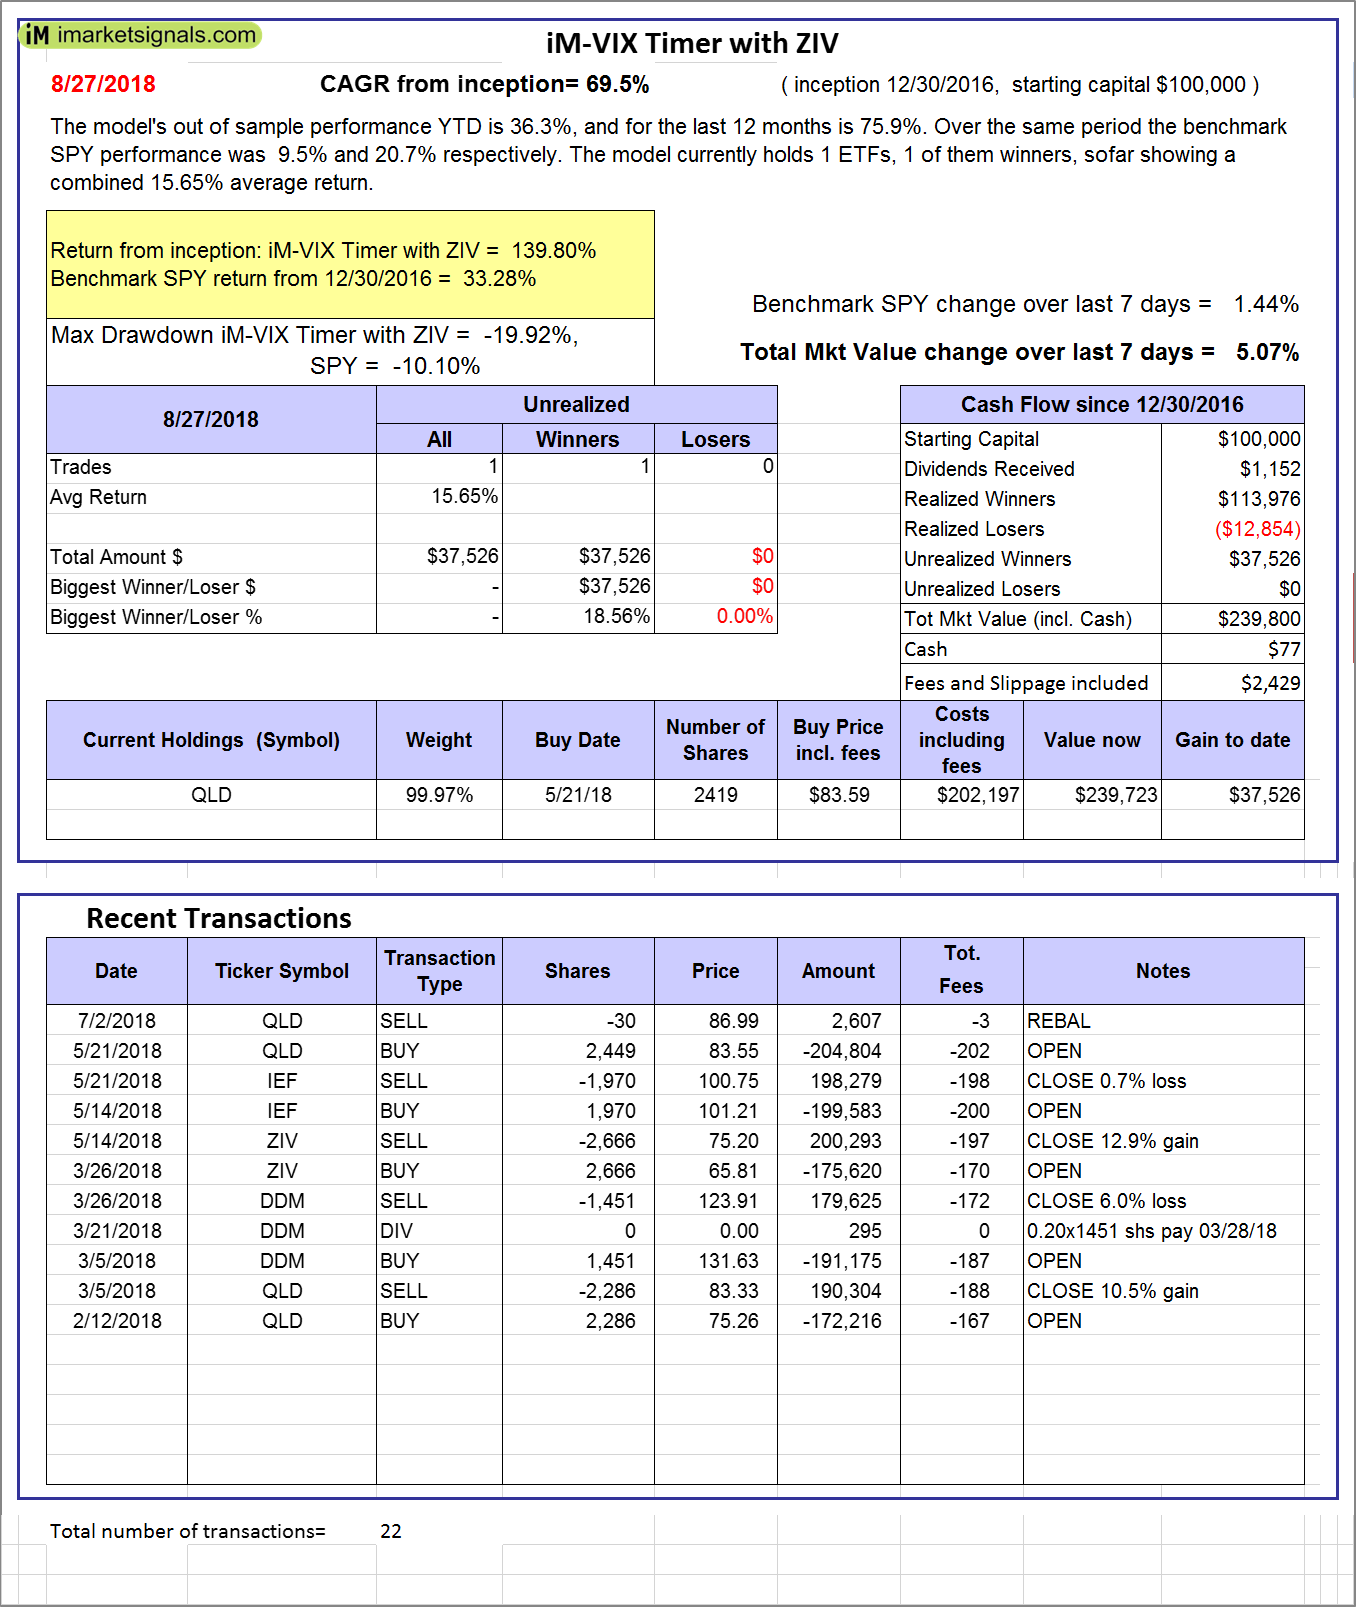
iM-VIX Timer with ZIV: The model’s out of sample performance YTD is 36.3%, and for the last 12 months is 75.9%. Over the same period the benchmark SPY performance was 9.5% and 20.7% respectively. Over the previous week the market value of the iM-VIX Timer with ZIV gained 5.07% at a time when SPY gained 1.44%. A starting capital of $100,000 at inception on 6/30/2016 would have grown to $239,800 which includes $77 cash and excludes $2,429 spent on fees and slippage. |
|
|
iM-Composite(Gold-Stocks-Bond) Timer: The model’s out of sample performance YTD is -7.3%, and for the last 12 months is -6.6%. Over the same period the benchmark SPY performance was 9.5% and 20.7% respectively. Over the previous week the market value of the iM-Composite(Gold-Stocks-Bond) Timer gained 1.67% at a time when SPY gained 1.44%. A starting capital of $100,000 at inception on 6/30/2016 would have grown to $119,323 which includes $89 cash and excludes $1,955 spent on fees and slippage. |
|
|
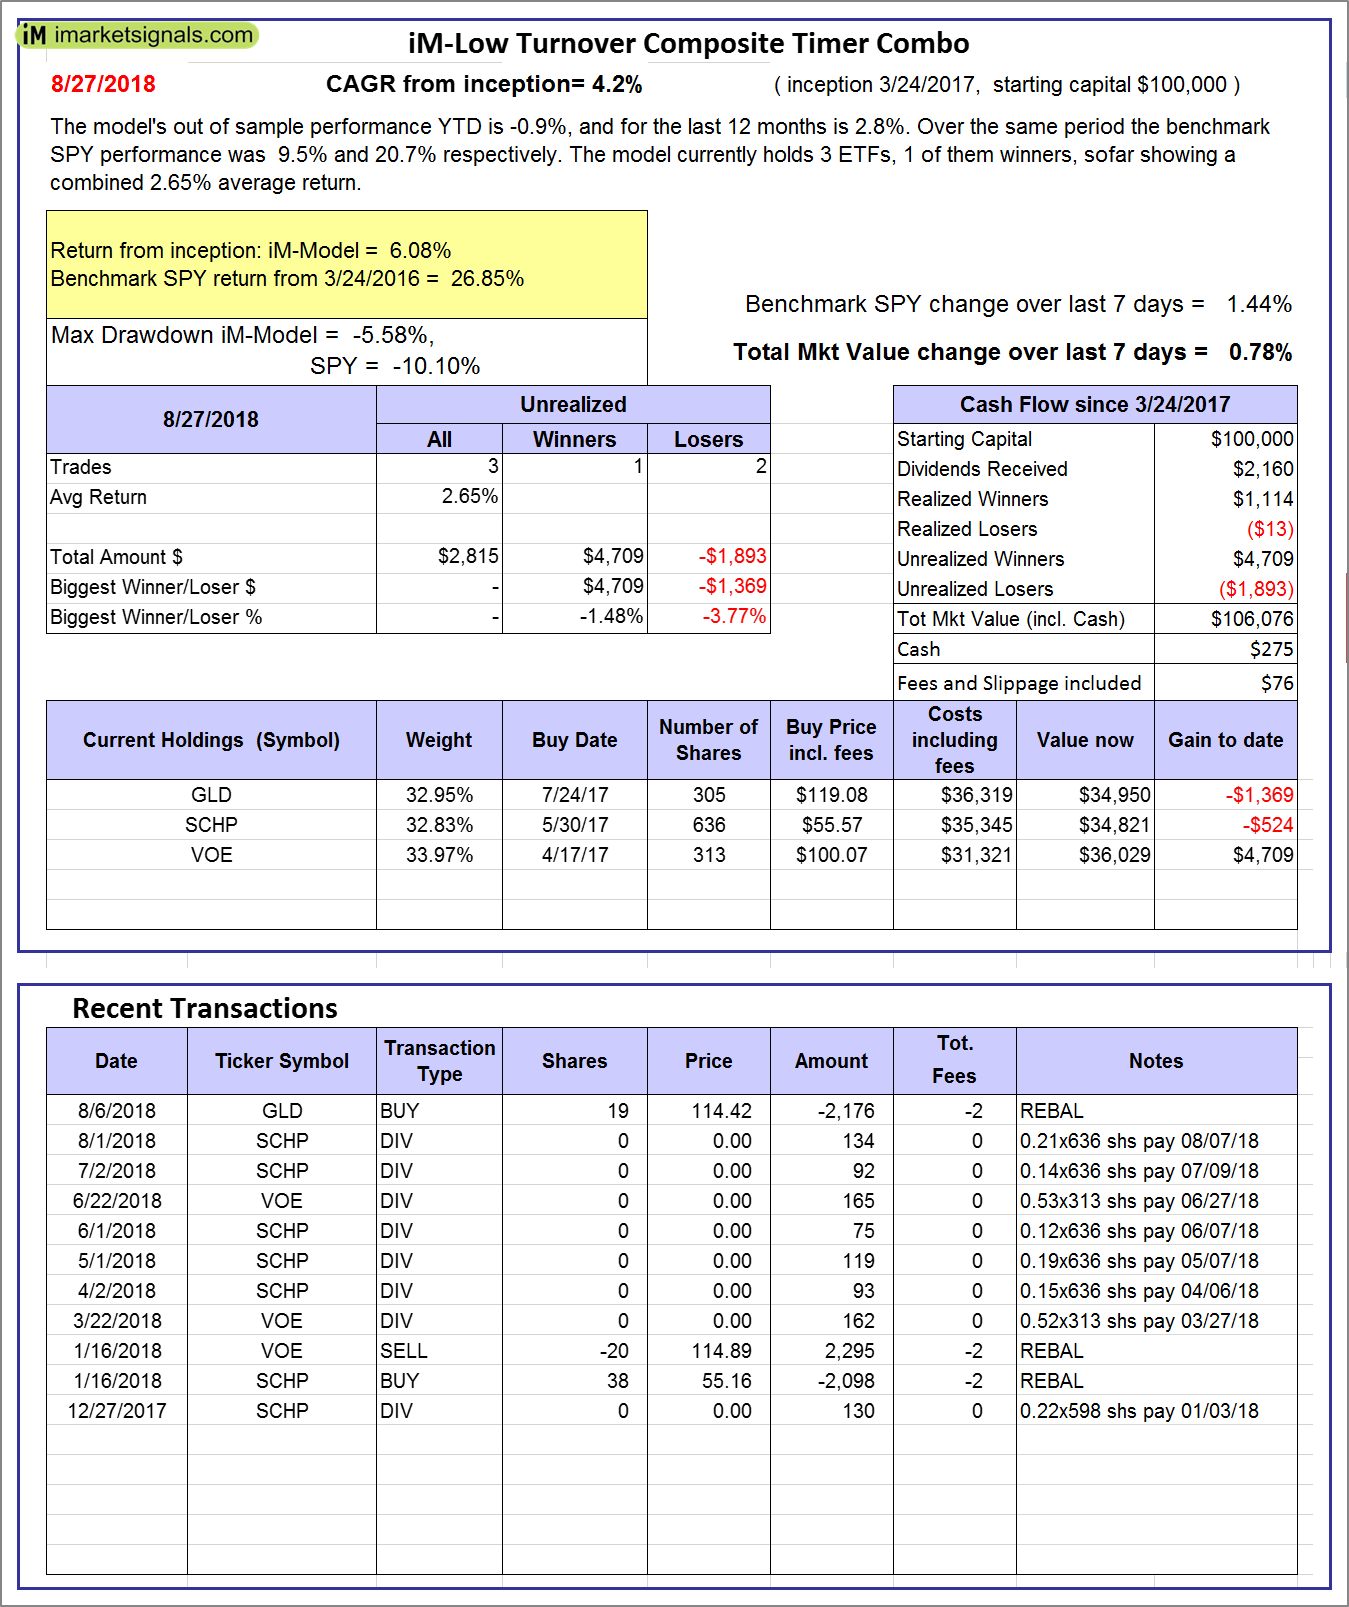
iM-Low Turnover Composite Timer Combo: The model’s out of sample performance YTD is -0.9%, and for the last 12 months is 2.8%. Over the same period the benchmark SPY performance was 9.5% and 20.7% respectively. Over the previous week the market value of the iM-Low Turnover Composite Timer Combo gained 0.78% at a time when SPY gained 1.44%. A starting capital of $100,000 at inception on 3/24/27 would have grown to $106,076 which includes $275 cash and excludes $76 spent on fees and slippage. |
|
|
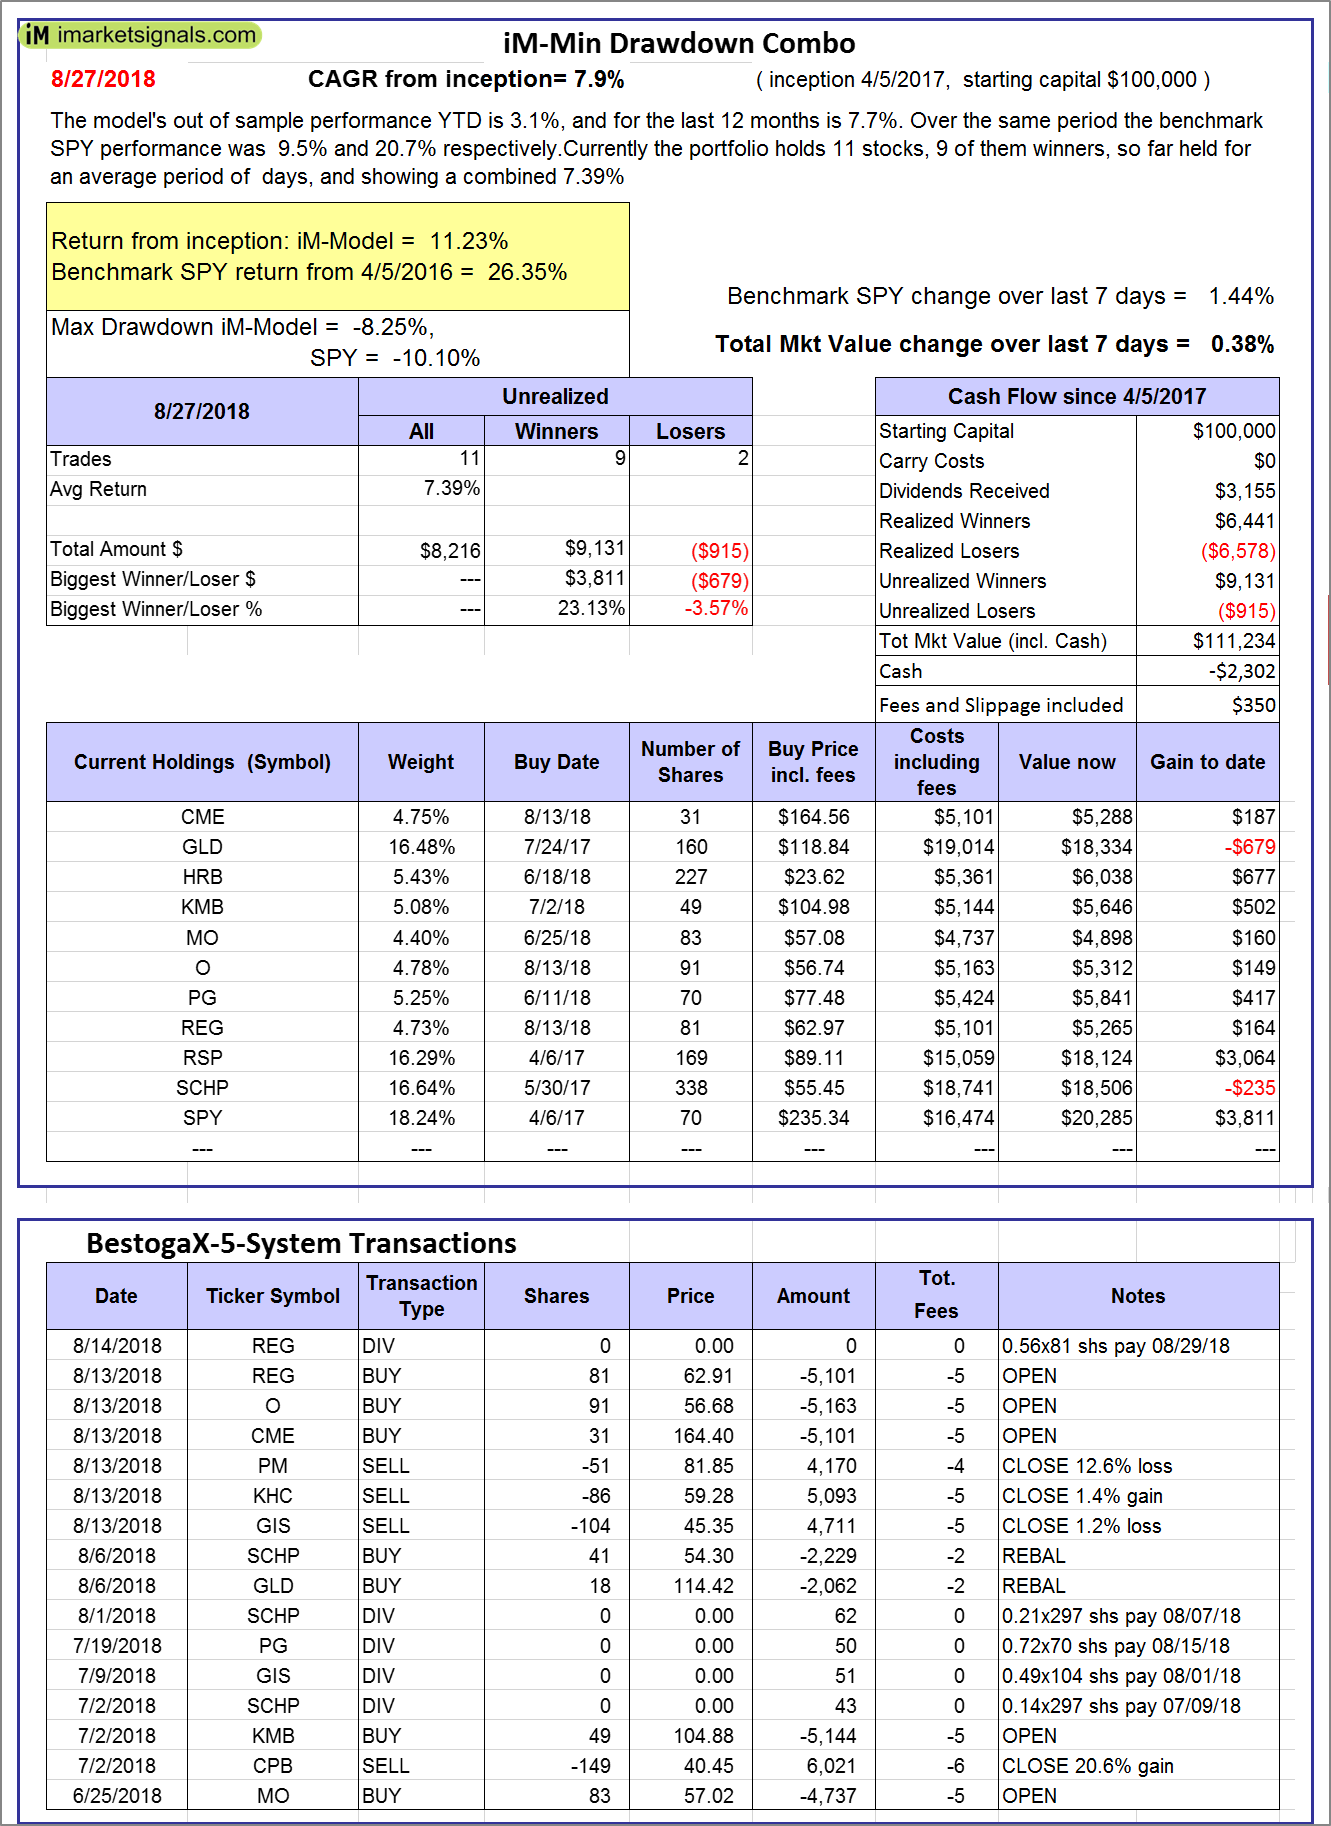
iM-Min Drawdown Combo: The model’s out of sample performance YTD is 3.1%, and for the last 12 months is 7.7%. Over the same period the benchmark SPY performance was 9.5% and 20.7% respectively. Over the previous week the market value of the iM-Min Drawdown Combo gained 0.38% at a time when SPY gained 1.44%. A starting capital of $100,000 at inception on 4/5/2017 would have grown to $111,234 which includes -$2,302 cash and excludes $350 spent on fees and slippage. |
|
|
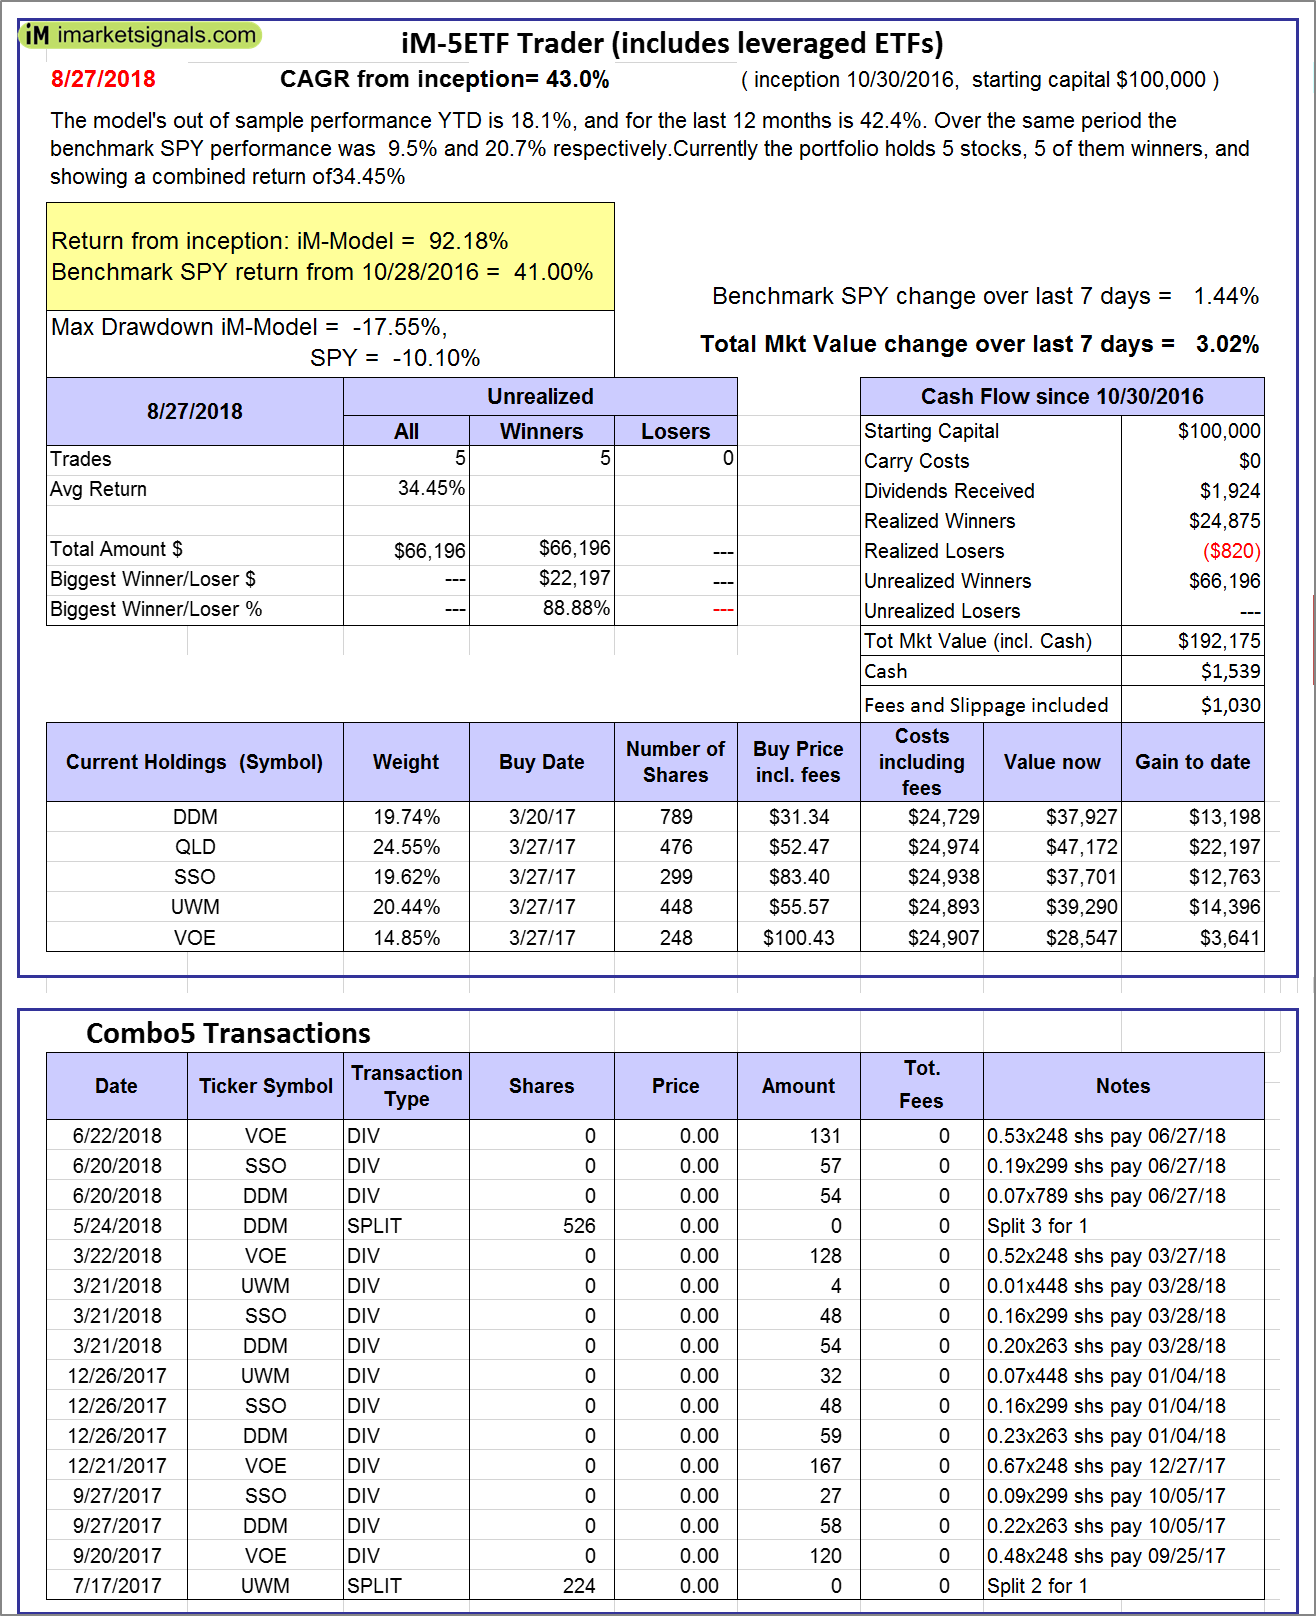
iM-5ETF Trader (includes leveraged ETFs): The model’s out of sample performance YTD is 18.1%, and for the last 12 months is 42.4%. Over the same period the benchmark SPY performance was 9.5% and 20.7% respectively. Over the previous week the market value of the iM-5ETF Trader (includes leveraged ETFs) gained 3.02% at a time when SPY gained 1.44%. A starting capital of $100,000 at inception on 10/30/2016 would have grown to $192,175 which includes $1,539 cash and excludes $1,030 spent on fees and slippage. |
|
|
iM-Standard 5ETF Trader (excludes leveraged ETFs): The model’s out of sample performance YTD is 8.1%, and for the last 12 months is 19.3%. Over the same period the benchmark SPY performance was 9.5% and 20.7% respectively. Over the previous week the market value of the iM-Standard 5ETF Trader (excludes leveraged ETFs) gained 1.18% at a time when SPY gained 1.44%. A starting capital of $100,000 at inception on 10/30/2016 would have grown to $135,798 which includes $3,101 cash and excludes $880 spent on fees and slippage. |


Leave a Reply
You must be logged in to post a comment.