  |
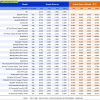
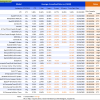
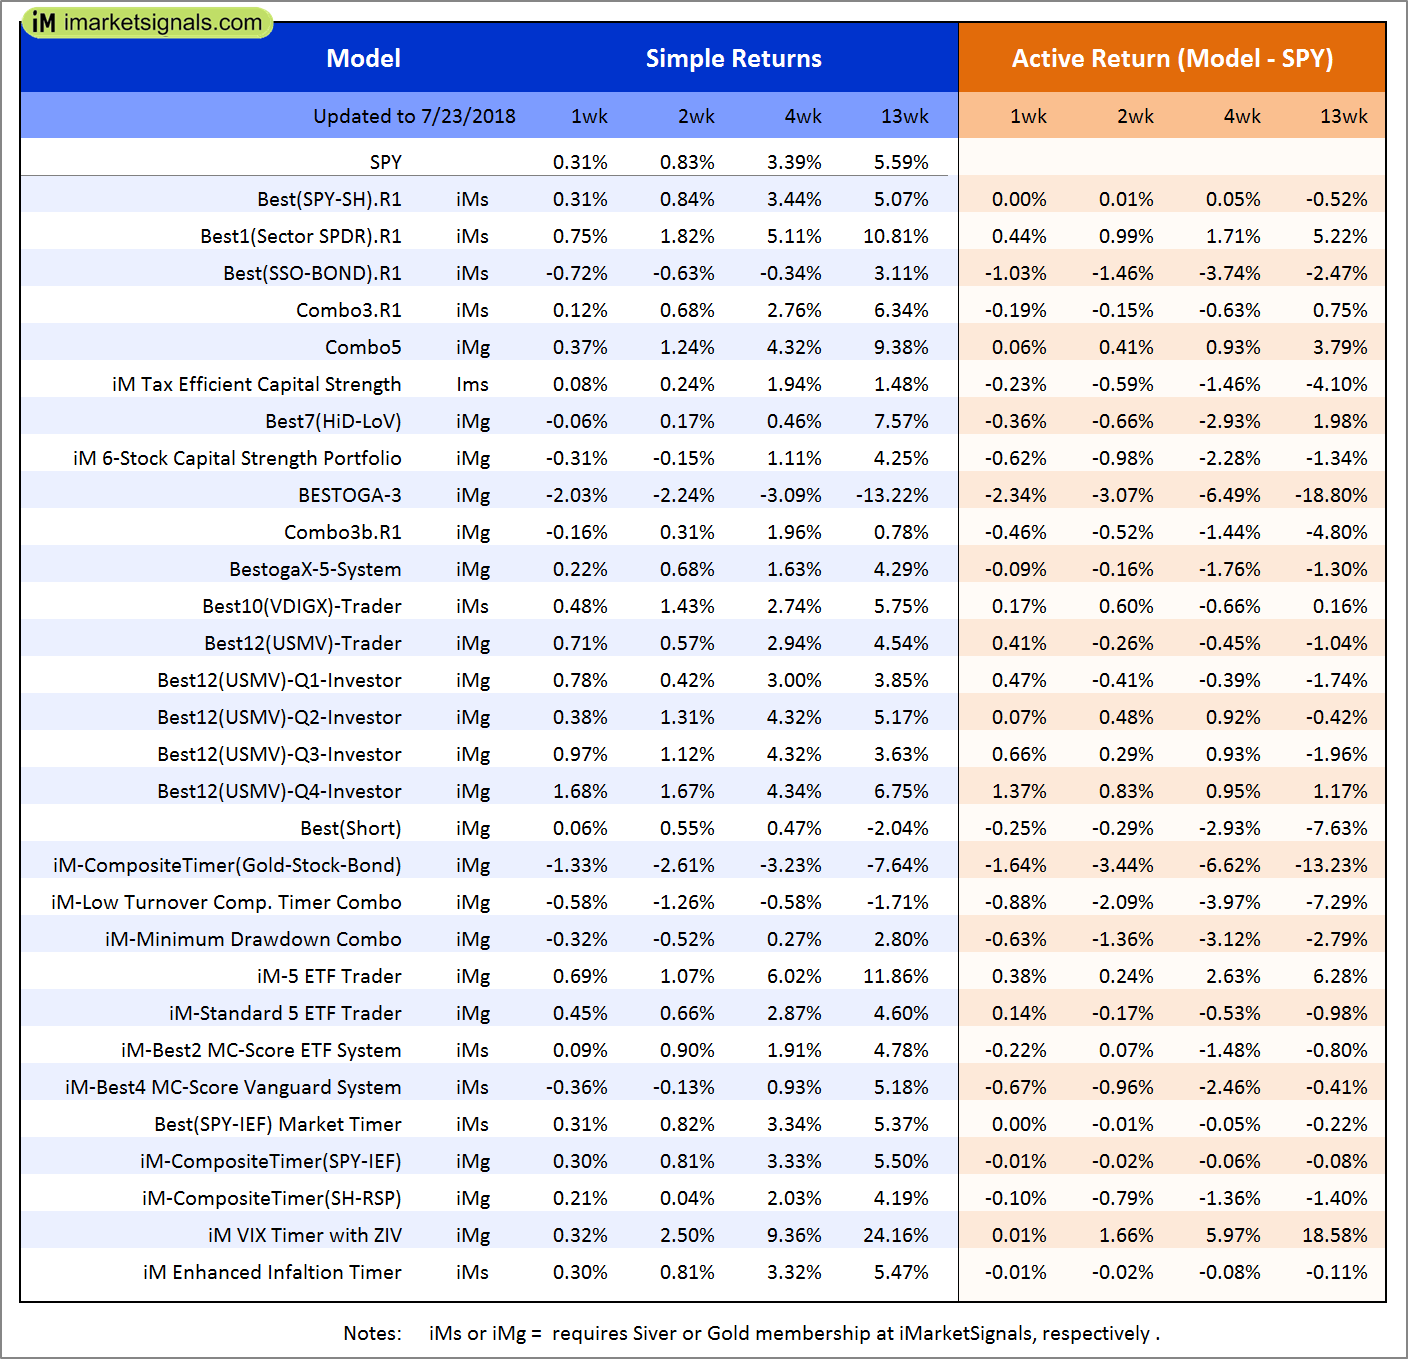
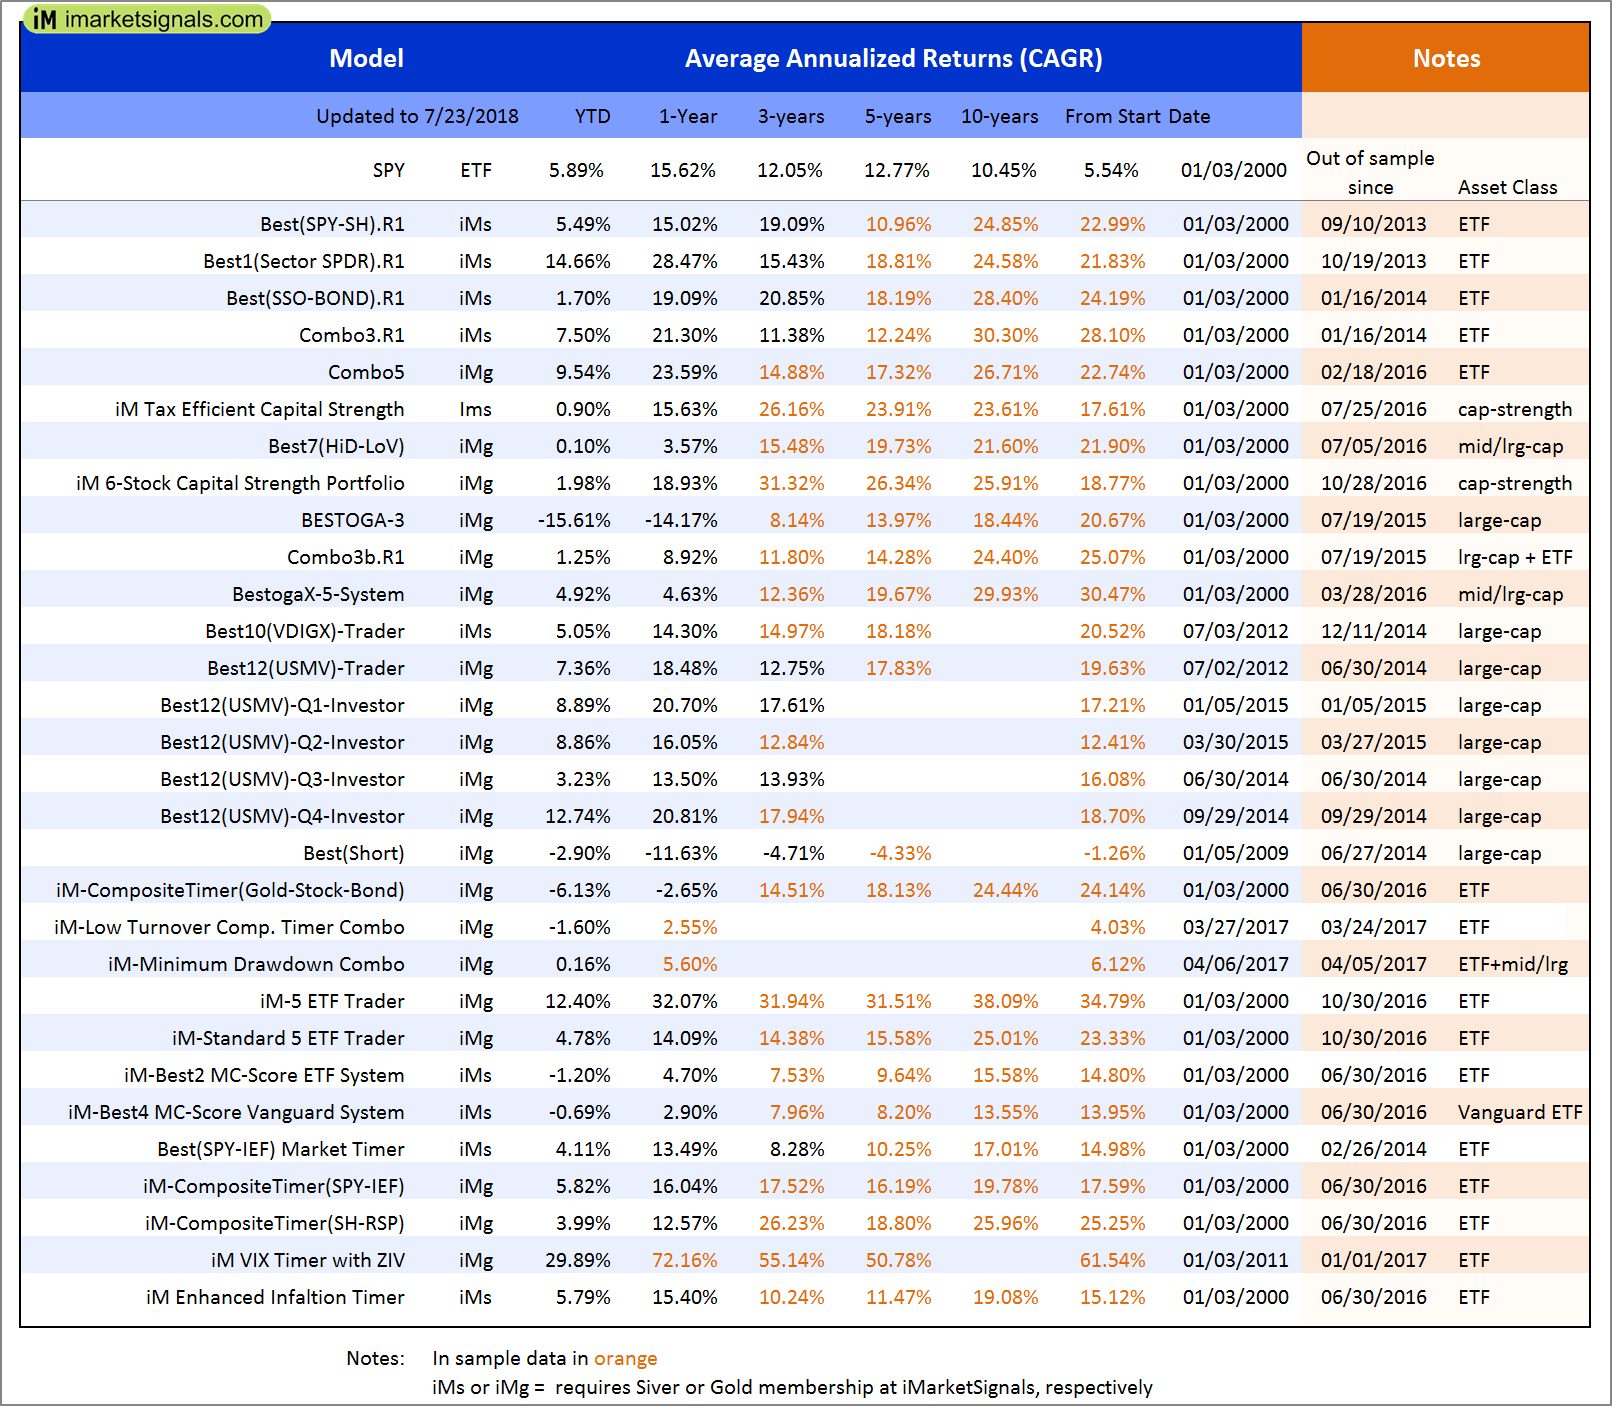
Out of sample performance summary of our models for the past 1, 2, 4 and 13 week periods. The active active return indicates how the models over- or underperformed the benchmark ETF SPY. Also the YTD, and the 1-, 3-, 5- and 10-year annualized returns are shown in the second table |
|
|
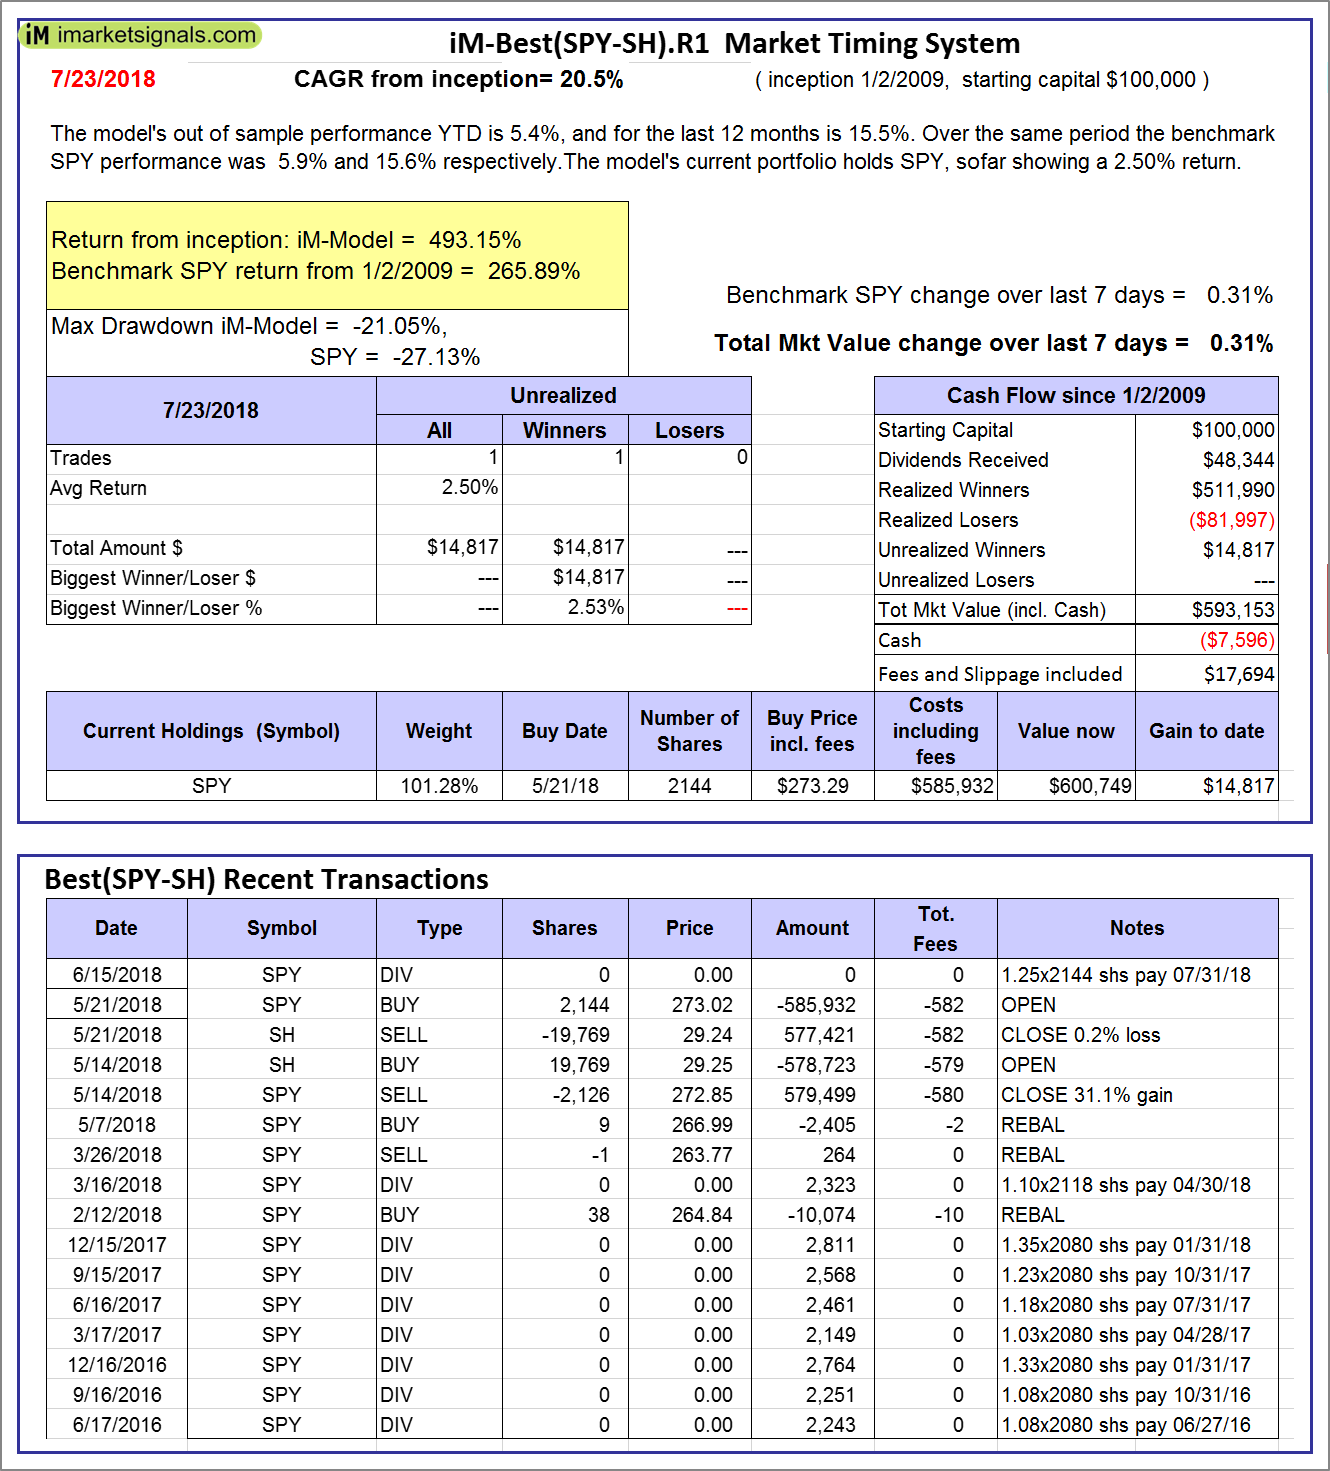
iM-Best(SPY-SH).R1: The model’s out of sample performance YTD is 5.4%, and for the last 12 months is 15.5%. Over the same period the benchmark SPY performance was 5.9% and 15.6% respectively. Over the previous week the market value of Best(SPY-SH) gained 0.31% at a time when SPY gained 0.31%. A starting capital of $100,000 at inception on 1/2/2009 would have grown to $593,153 which includes -$7,596 cash and excludes $17,694 spent on fees and slippage. |
|
|
iM-Combo3.R1: The model’s out of sample performance YTD is 7.4%, and for the last 12 months is 21.5%. Over the same period the benchmark SPY performance was 5.9% and 15.6% respectively. Over the previous week the market value of iM-Combo3.R1 gained 0.12% at a time when SPY gained 0.31%. A starting capital of $100,000 at inception on 2/3/2014 would have grown to $169,508 which includes $331 cash and excludes $4,006 spent on fees and slippage. |
|
|
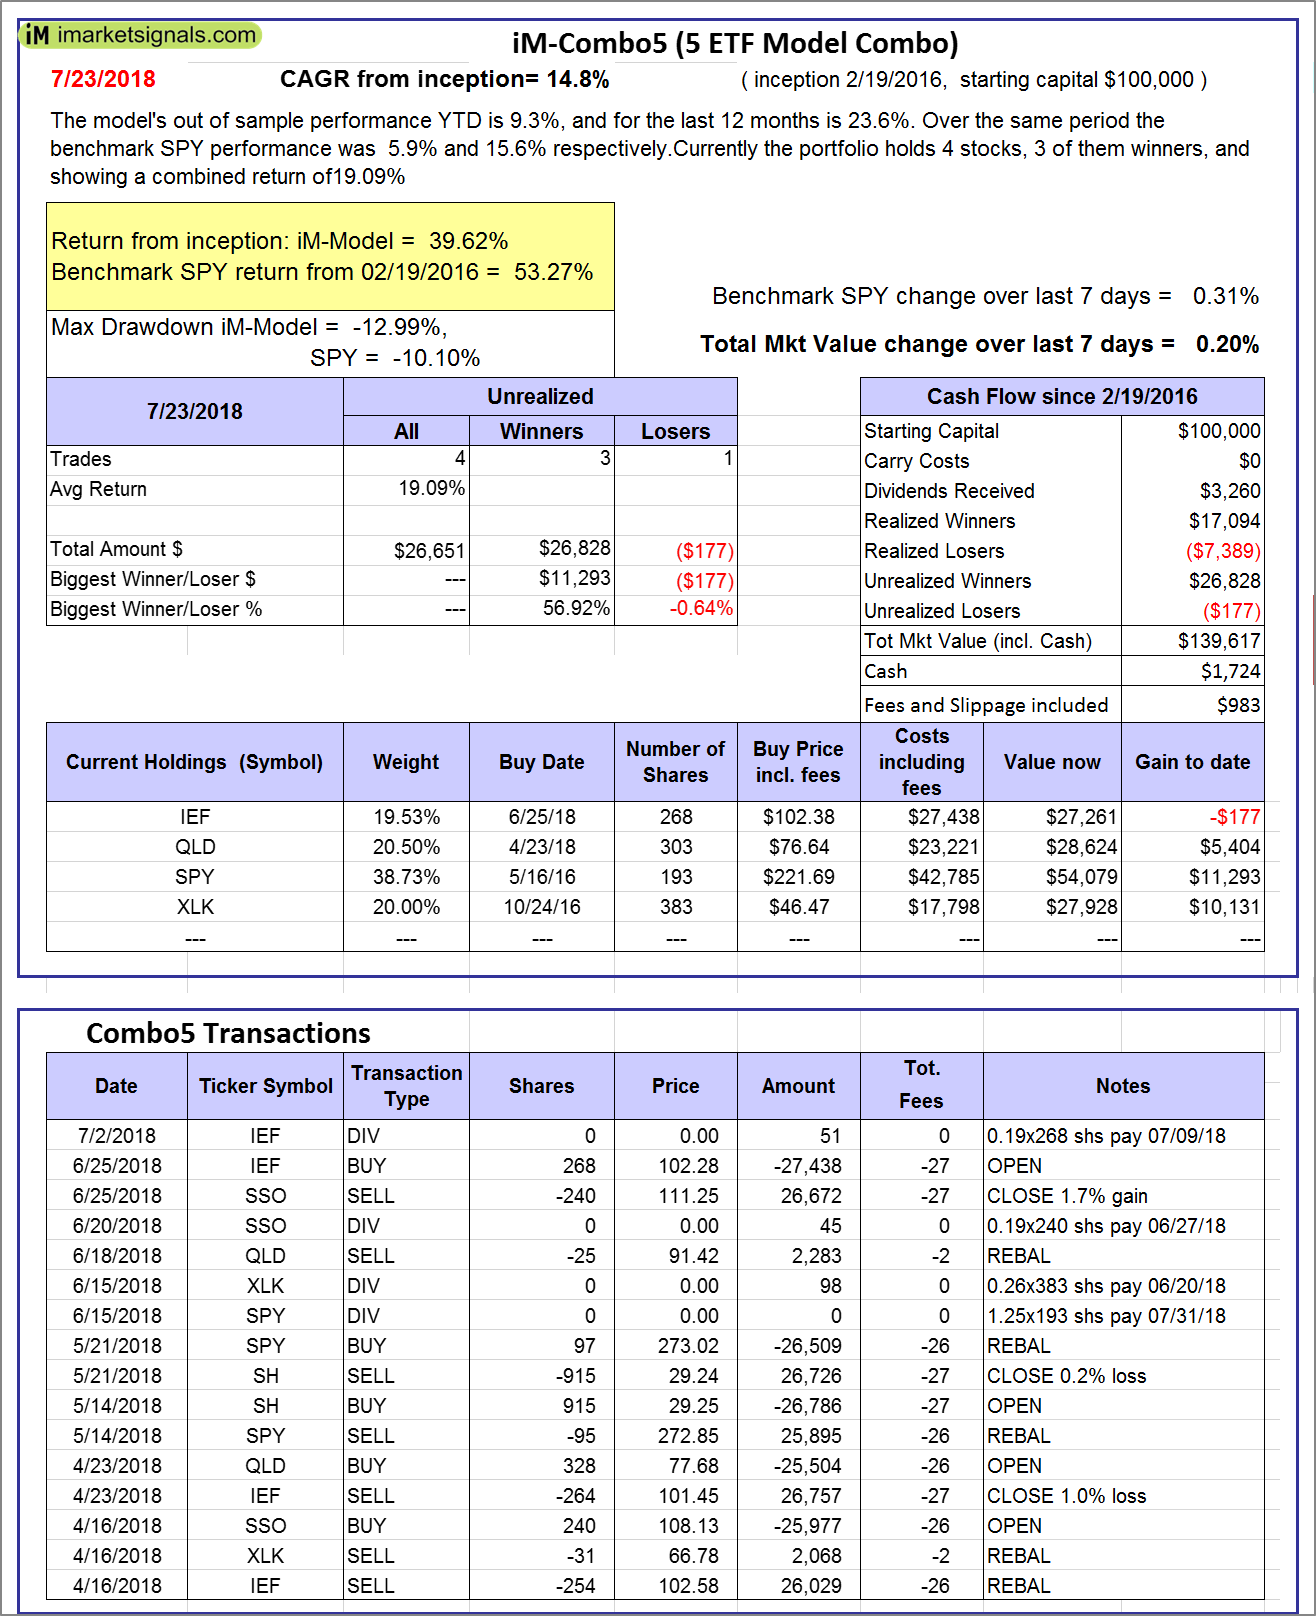
iM-Combo5: The model’s out of sample performance YTD is 9.3%, and for the last 12 months is 23.6%. Over the same period the benchmark SPY performance was 5.9% and 15.6% respectively. Over the previous week the market value of iM-Combo5 gained 0.20% at a time when SPY gained 0.31%. A starting capital of $100,000 at inception on 2/22/2016 would have grown to $139,617 which includes $1,724 cash and excludes $983 spent on fees and slippage. |
|
|
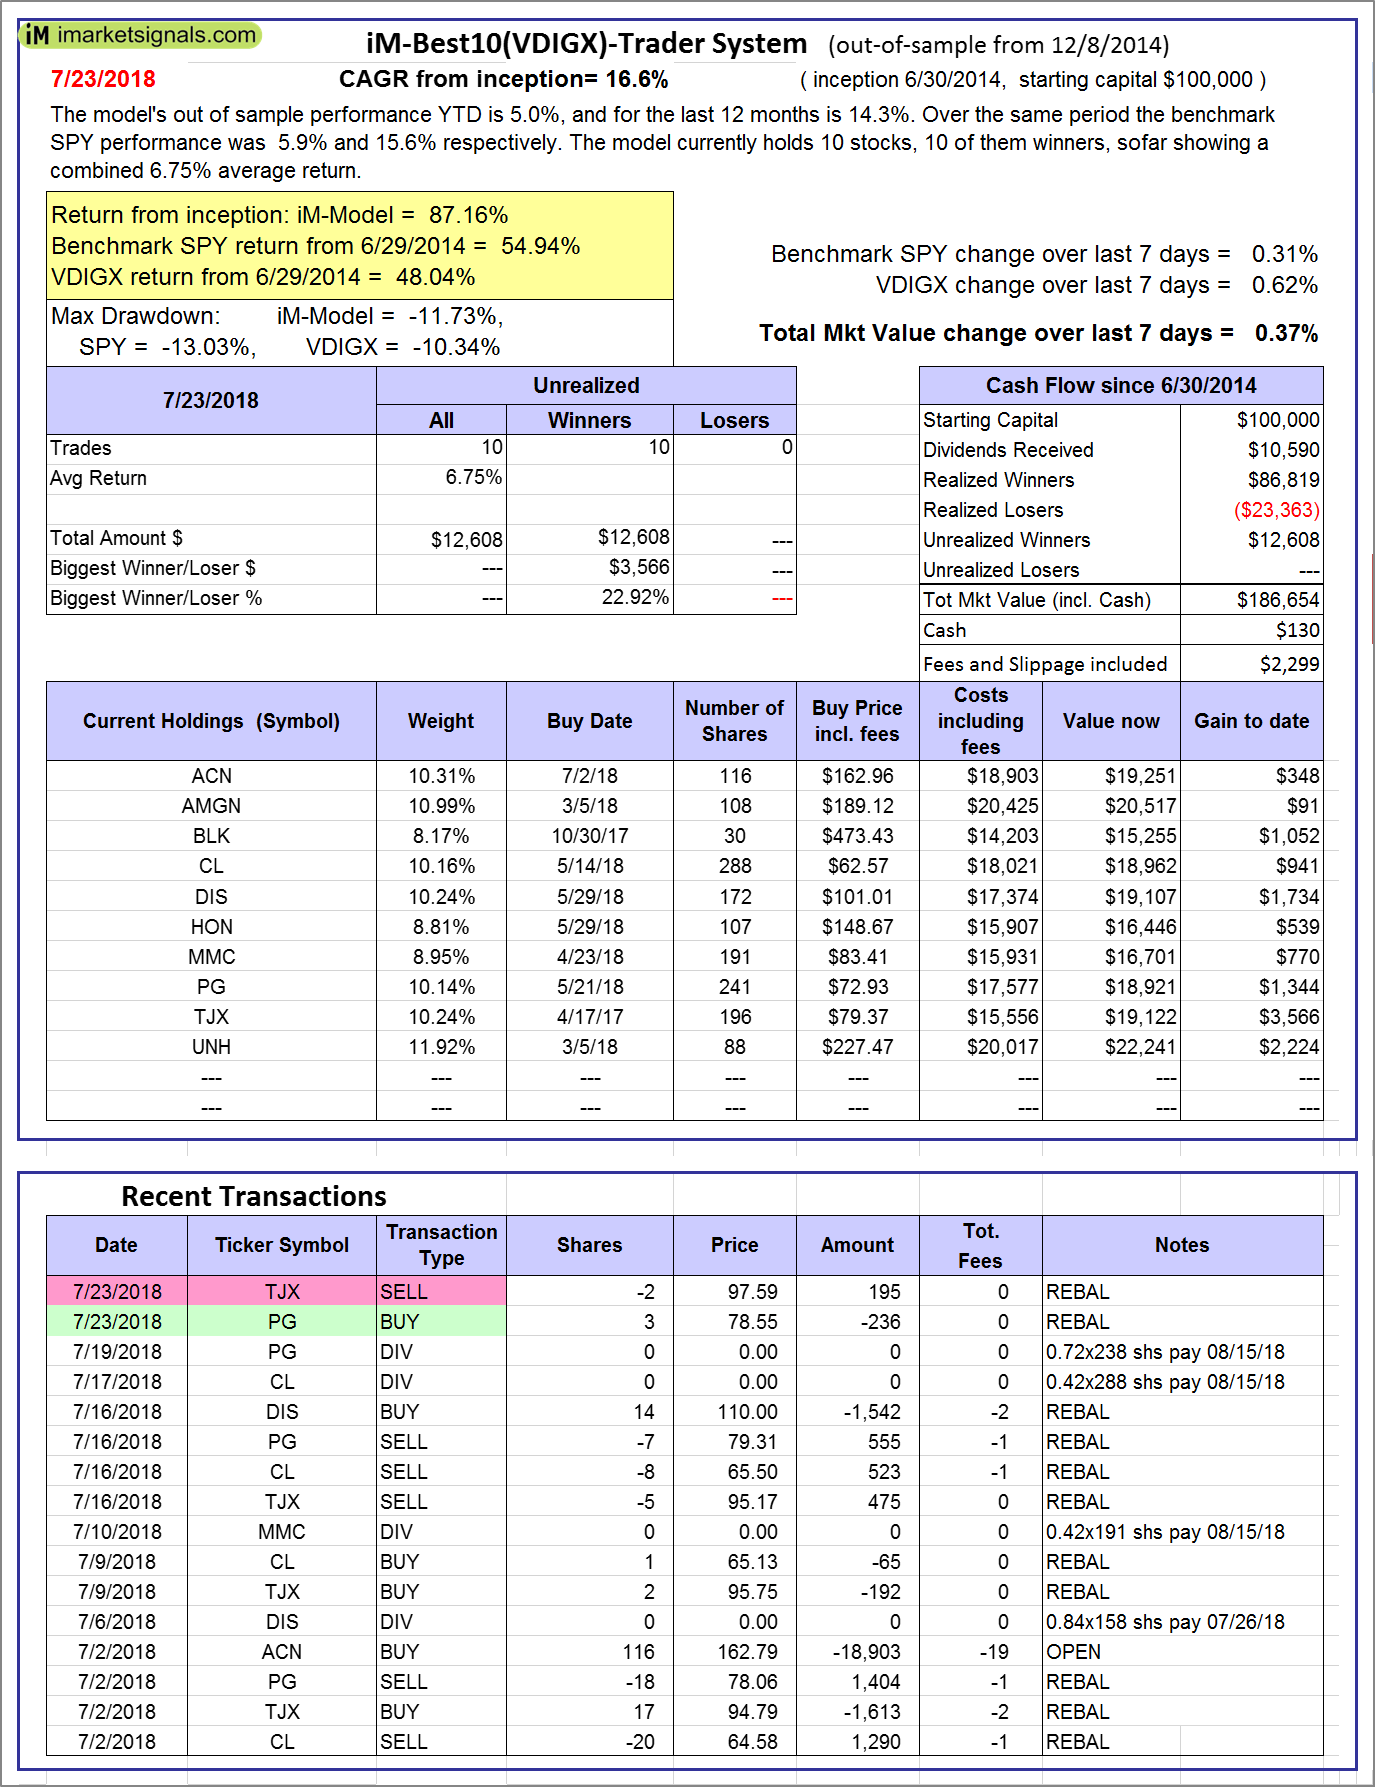
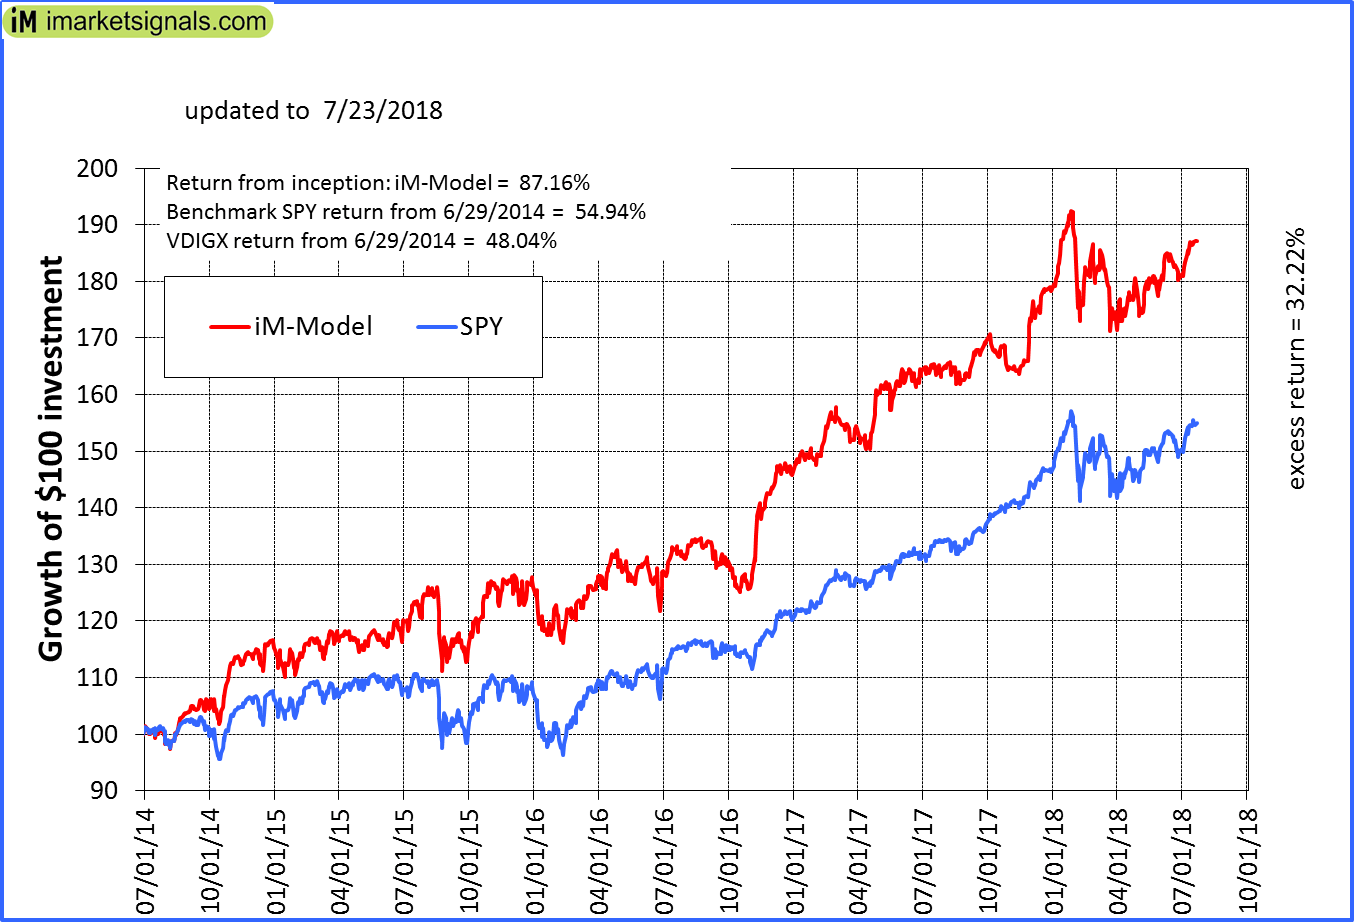
iM-Best10(VDIGX)-Trader: The model’s out of sample performance YTD is 5.0%, and for the last 12 months is 14.3%. Over the same period the benchmark SPY performance was 5.9% and 15.6% respectively. Since inception, on 7/1/2014, the model gained 87.16% while the benchmark SPY gained 54.94% and VDIGX gained 48.04% over the same period. Over the previous week the market value of iM-Best10(VDIGX) gained 0.37% at a time when SPY gained 0.31%. A starting capital of $100,000 at inception on 7/1/2014 would have grown to $186,654 which includes $130 cash and excludes $2,299 spent on fees and slippage. |
|
|
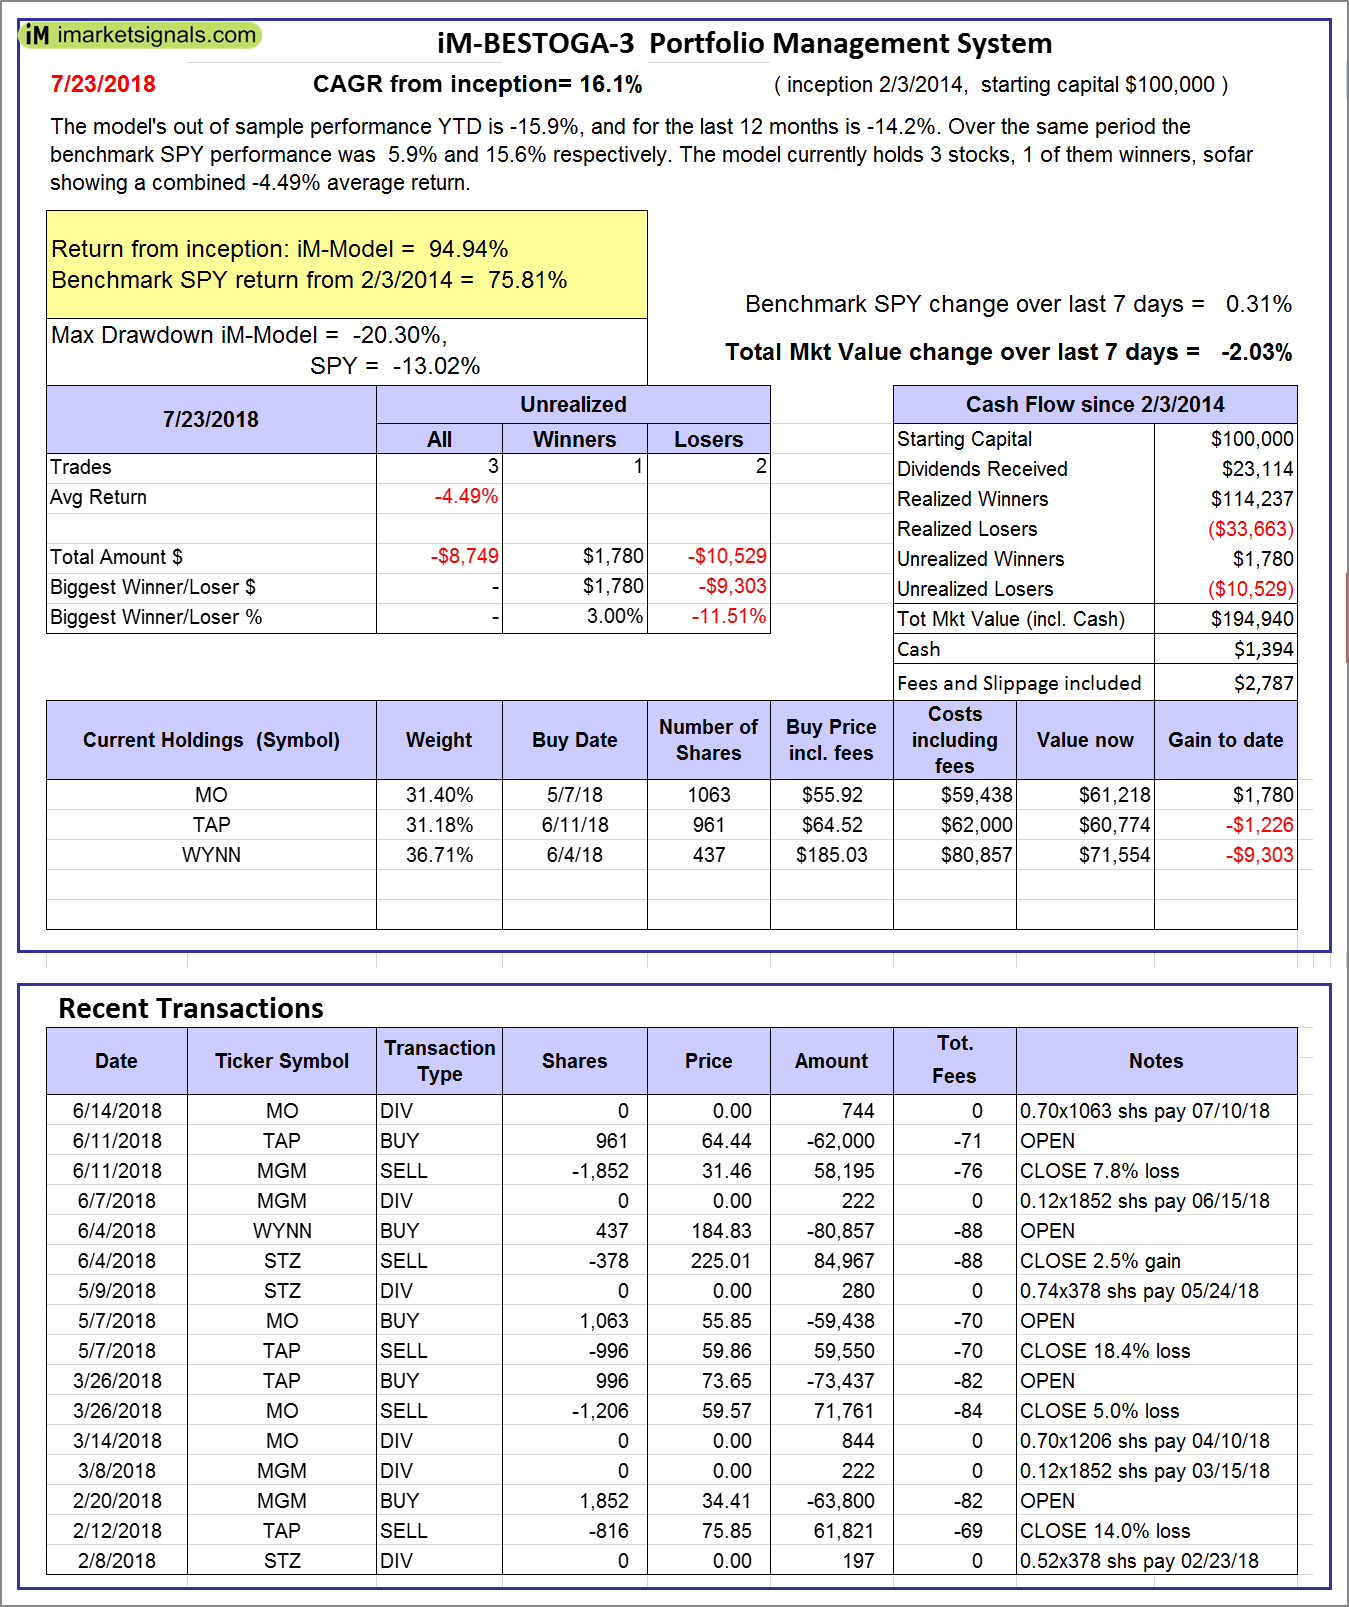
iM-BESTOGA-3: The model’s out of sample performance YTD is -15.9%, and for the last 12 months is -14.2%. Over the same period the benchmark SPY performance was 5.9% and 15.6% respectively. Over the previous week the market value of iM-BESTOGA-3 gained -2.03% at a time when SPY gained 0.31%. A starting capital of $100,000 at inception on 2/3/2014 would have grown to $194,940 which includes $1,394 cash and excludes $2,787 spent on fees and slippage. |
|
|
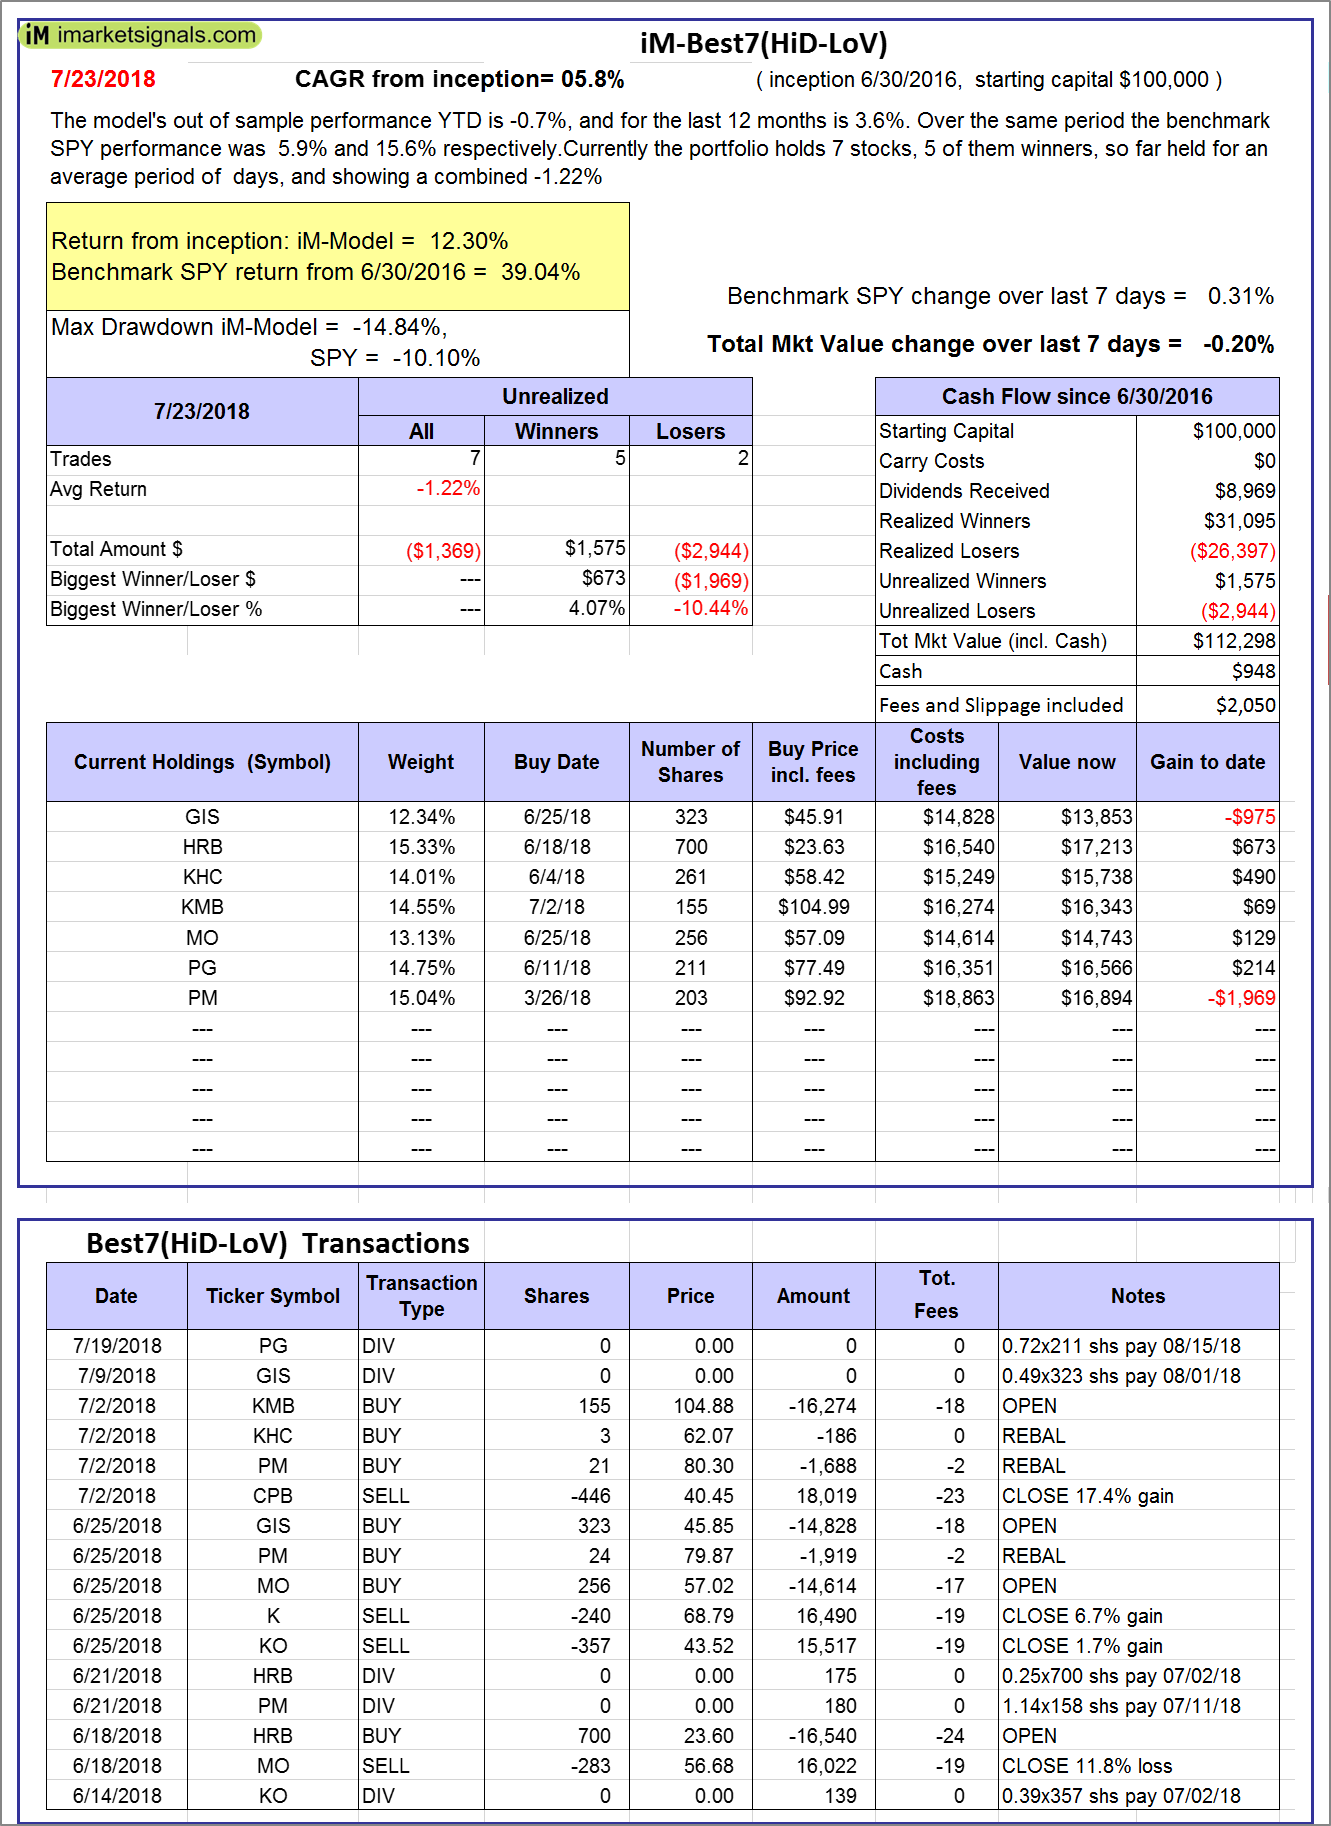
iM-Best7(HiD-LoV): The model’s out of sample performance YTD is -0.7%, and for the last 12 months is 3.6%. Over the same period the benchmark SPY performance was 5.9% and 15.6% respectively. Over the previous week the market value of iM-BESTOGA-3 gained -0.20% at a time when SPY gained 0.31%. A starting capital of $100,000 at inception on 6/30/2016 would have grown to $112,298 which includes $948 cash and excludes $2,050 spent on fees and slippage. |
|
|
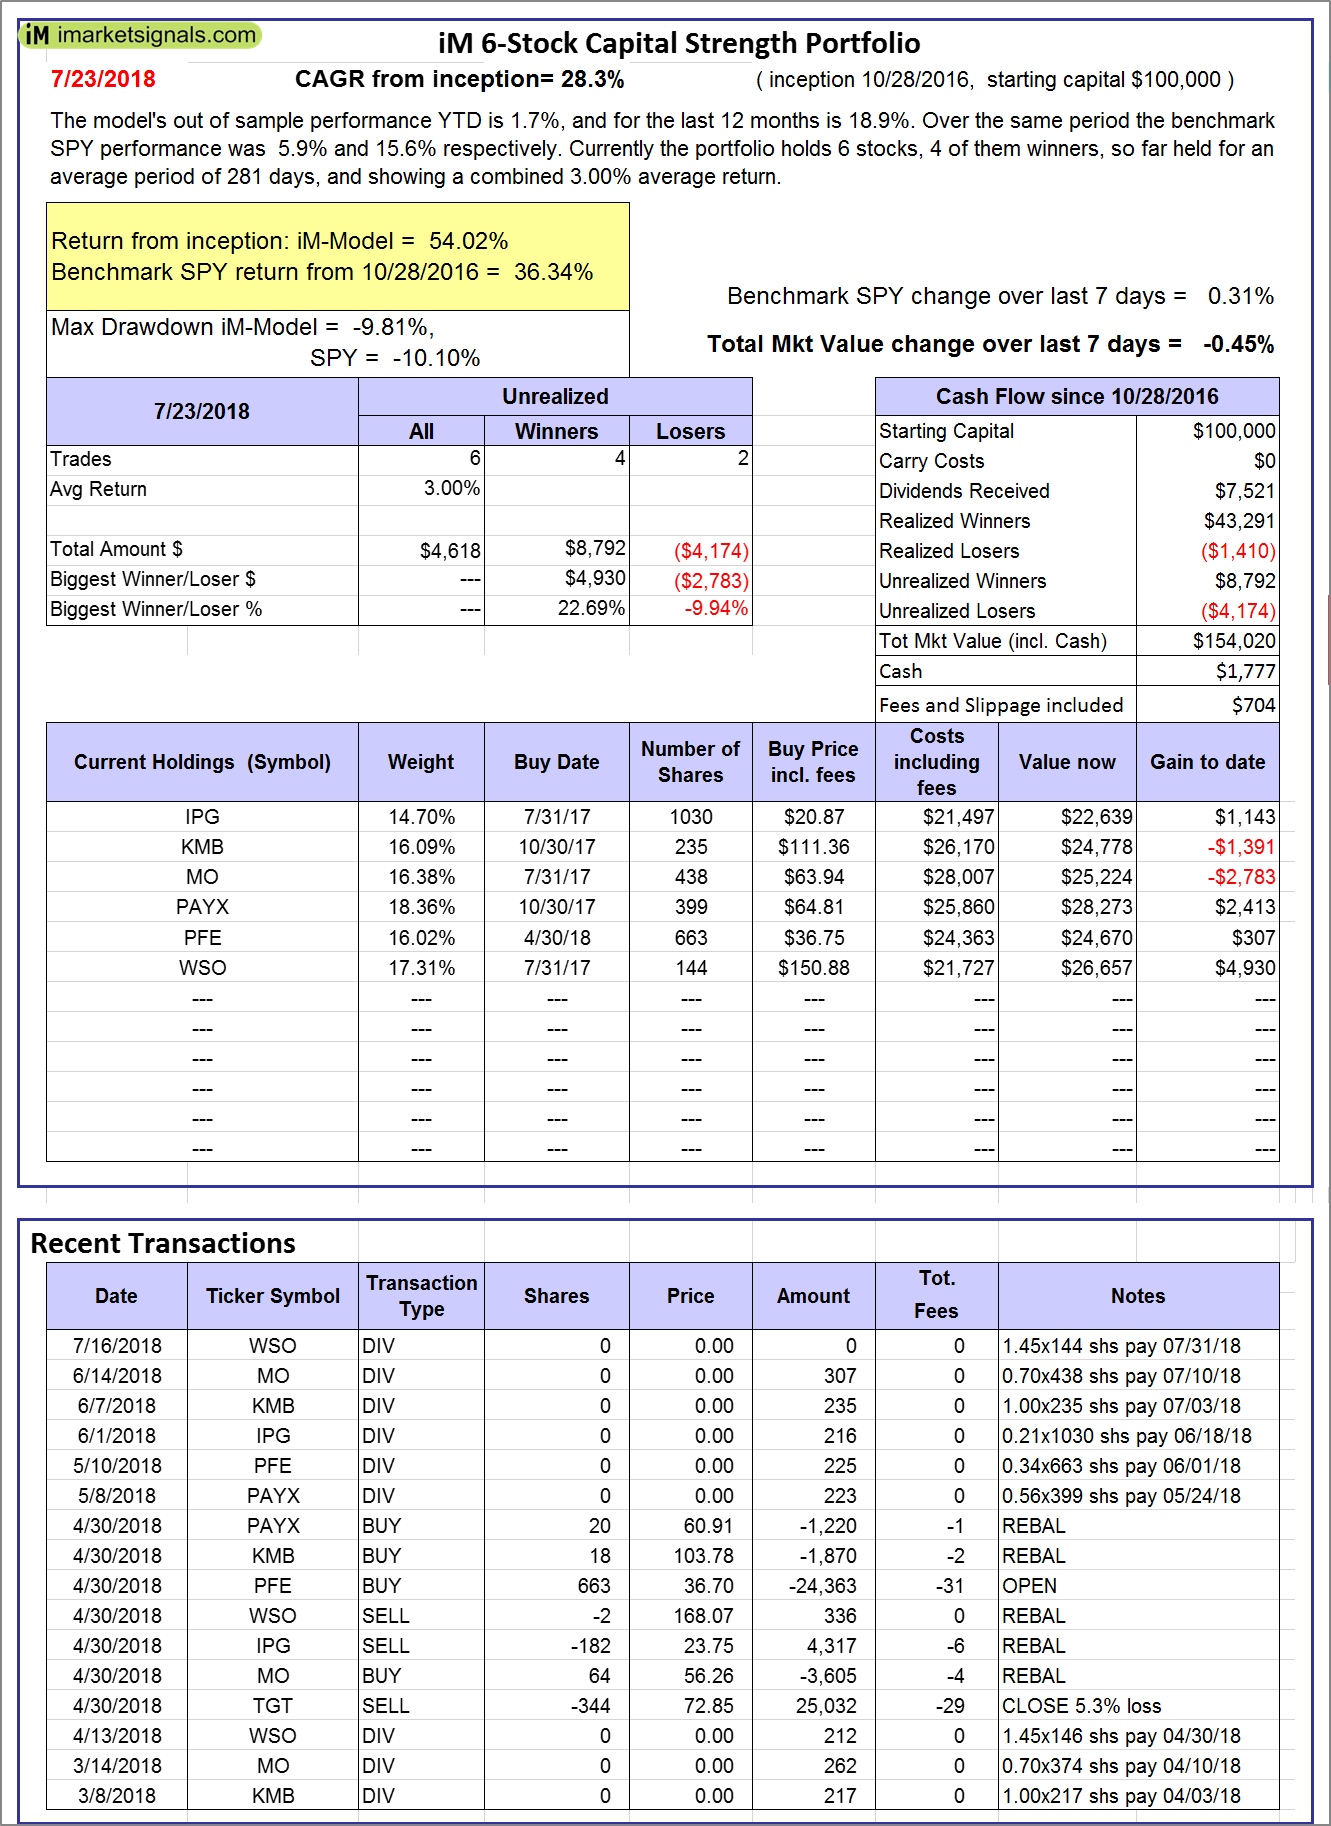
iM 6-Stock Capital Strength Portfolio: The model’s out of sample performance YTD is 1.7%, and for the last 12 months is 18.9%. Over the same period the benchmark SPY performance was 5.9% and 15.6% respectively. Over the previous week the market value of the iM 6-Stock Capital Strength Portfolio gained -0.45% at a time when SPY gained 0.31%. A starting capital of $100,000 at inception on 10/28/2016 would have grown to $154,020 which includes $1,777 cash and excludes $704 spent on fees and slippage. |
|
|
iM-BestogaX5-System: The model’s out of sample performance YTD is 4.1%, and for the last 12 months is 4.6%. Over the same period the benchmark SPY performance was 5.9% and 15.6% respectively. Over the previous week the market value of iM-BestogaX5-System gained -0.05% at a time when SPY gained 0.31%. A starting capital of $100,000 at inception on 3/28/2016 would have grown to $116,701 which includes $639 cash and excludes $1,256 spent on fees and slippage. |
|
|
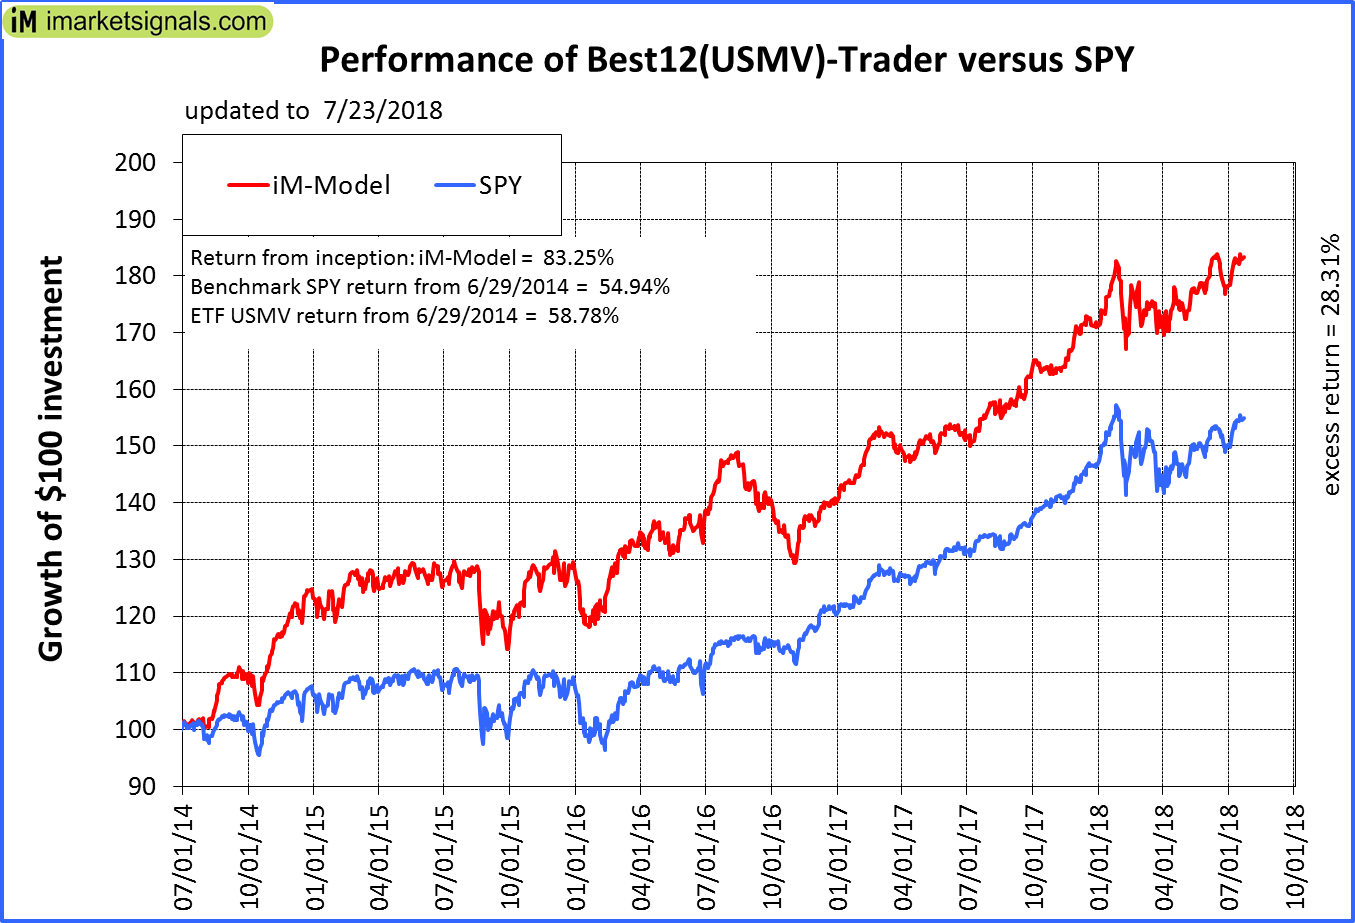
iM-Best12(USMV)-Trader: The model’s out of sample performance YTD is 7.1%, and for the last 12 months is 18.5%. Over the same period the benchmark SPY performance was 5.9% and 15.6% respectively. Since inception, on 6/30/2014, the model gained 83.25% while the benchmark SPY gained 54.94% and the ETF USMV gained 58.78% over the same period. Over the previous week the market value of iM-Best12(USMV)-Trader gained 0.60% at a time when SPY gained 0.31%. A starting capital of $100,000 at inception on 6/30/2014 would have grown to $183,042 which includes $348 cash and excludes $4,364 spent on fees and slippage. |
|
|
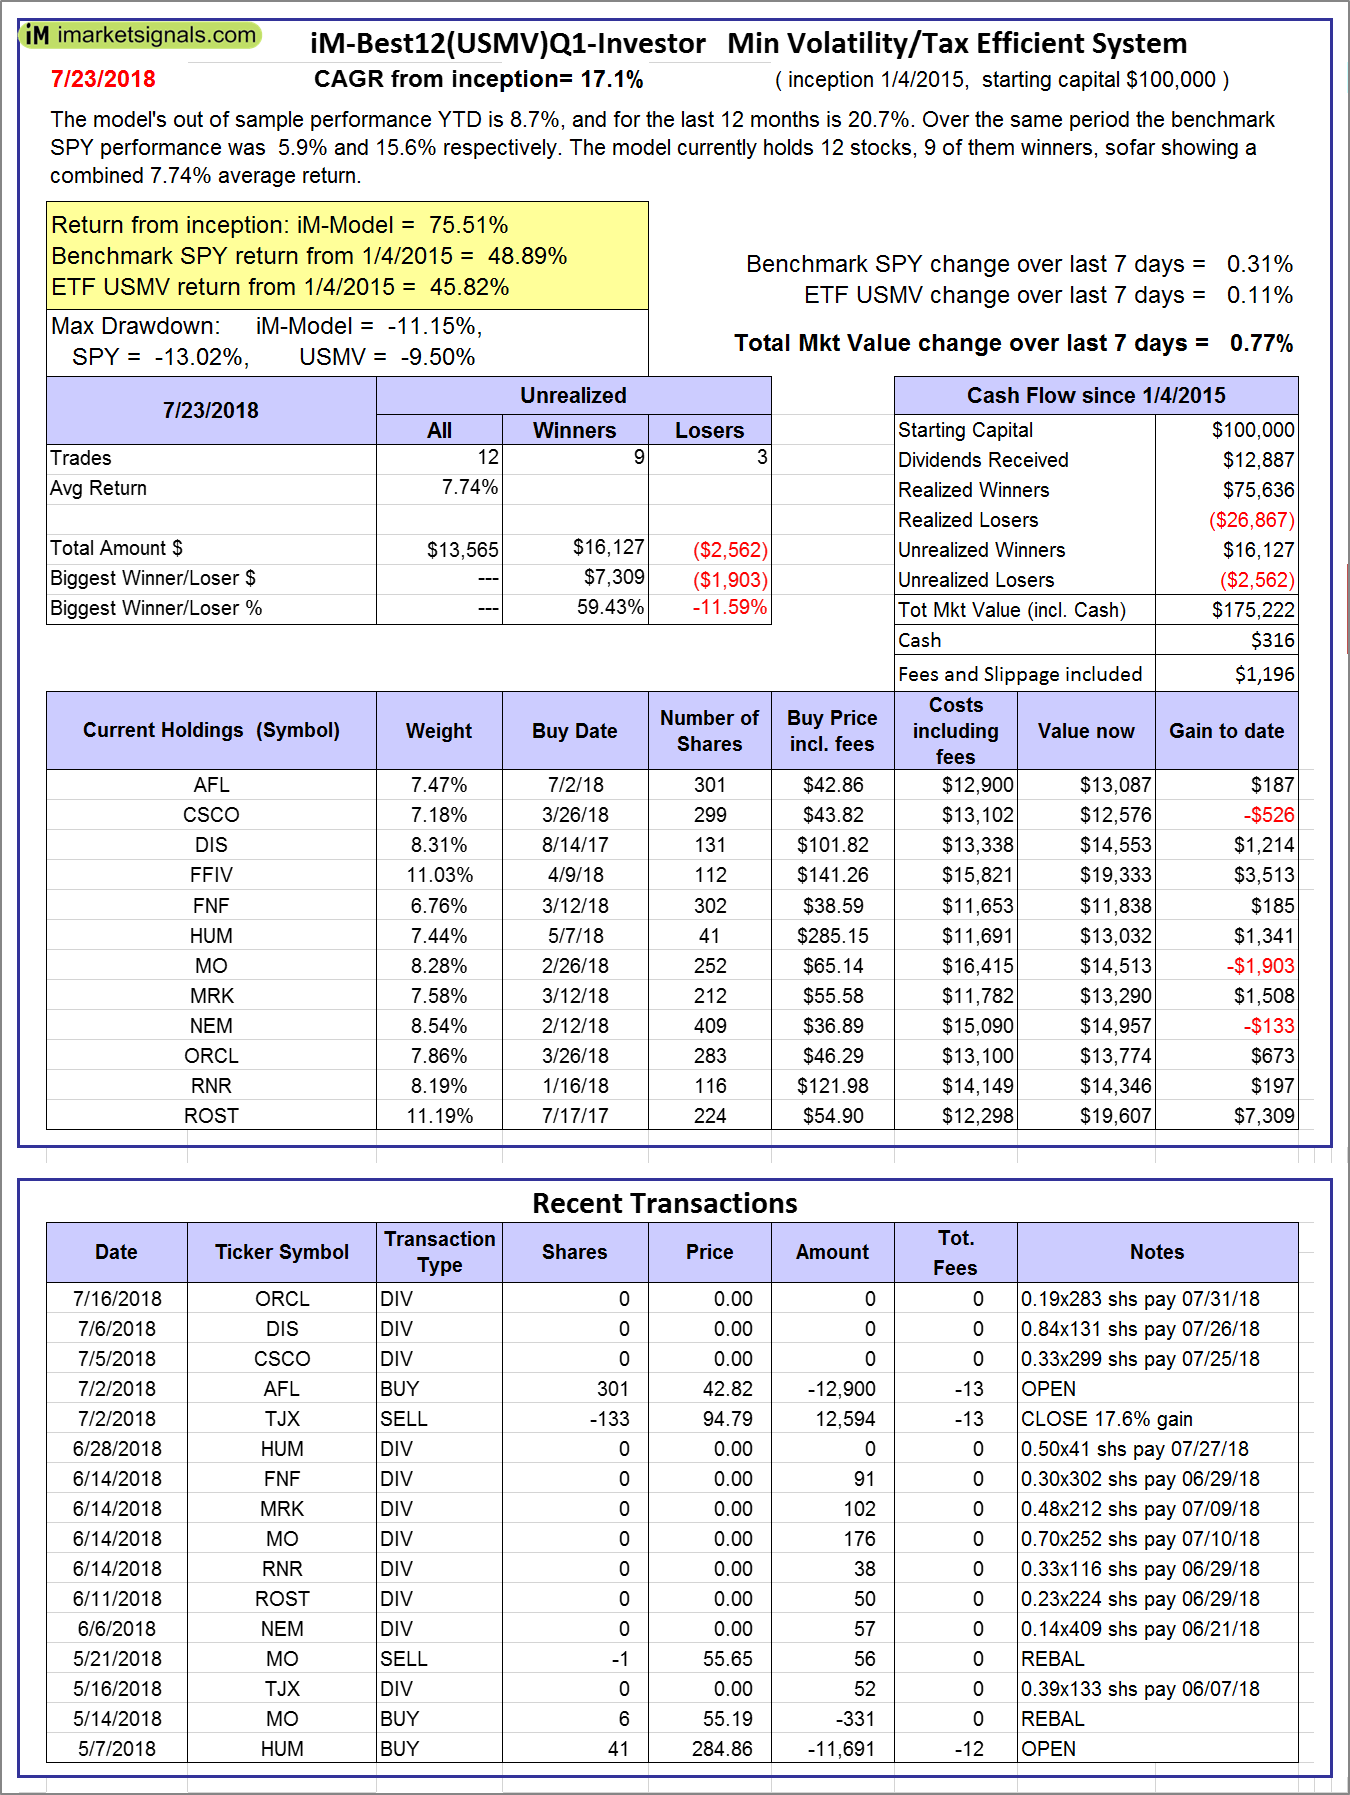
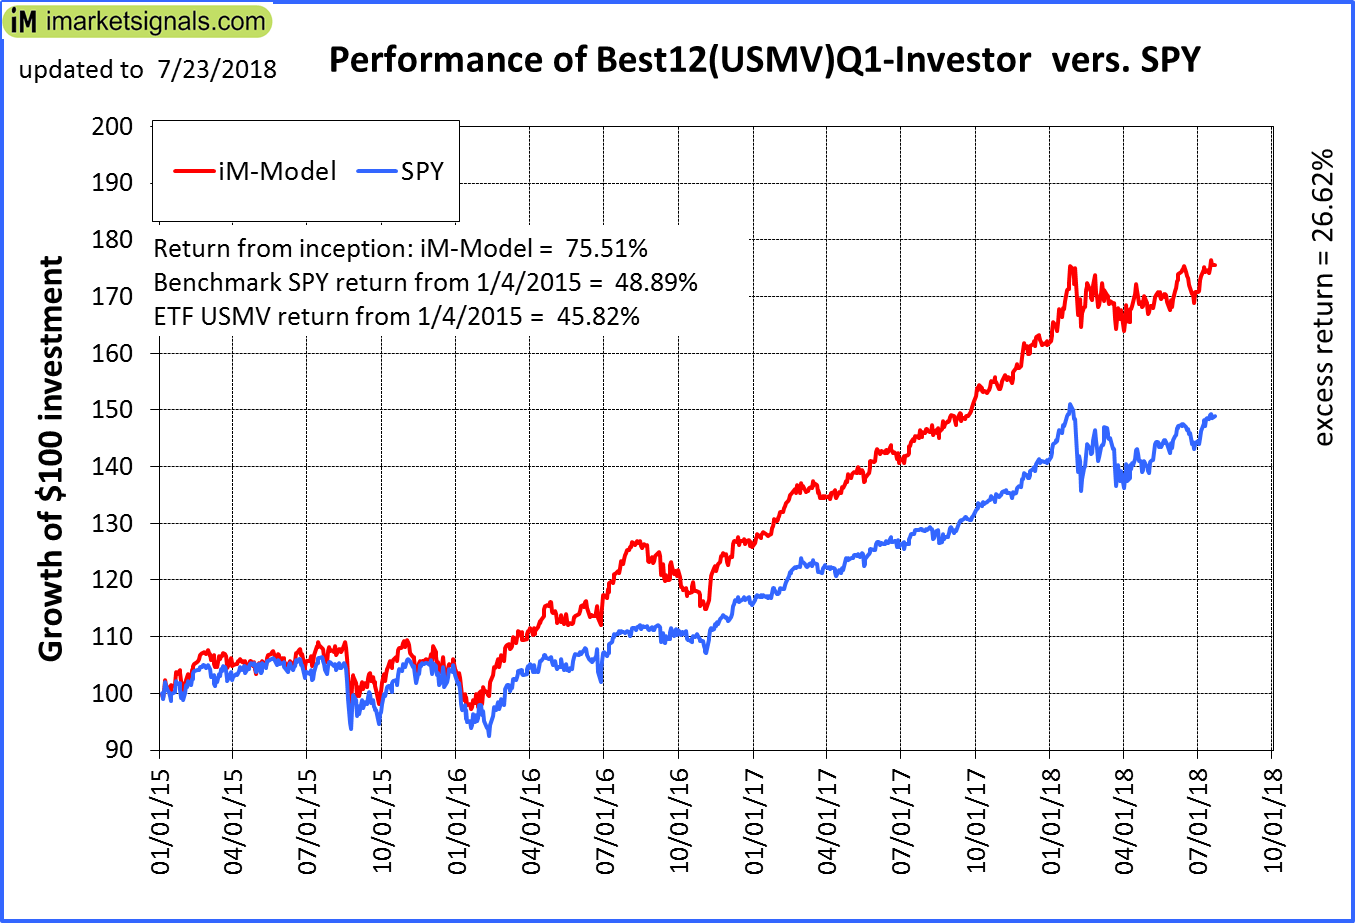
iM-Best12(USMV)Q1-Investor: The model’s out of sample performance YTD is 8.7%, and for the last 12 months is 20.7%. Over the same period the benchmark SPY performance was 5.9% and 15.6% respectively. Since inception, on 1/5/2015, the model gained 75.51% while the benchmark SPY gained 48.89% and the ETF USMV gained 45.82% over the same period. Over the previous week the market value of iM-Best12(USMV)Q1 gained 0.77% at a time when SPY gained 0.31%. A starting capital of $100,000 at inception on 1/5/2015 would have grown to $175,222 which includes $316 cash and excludes $1,196 spent on fees and slippage. |
|
|
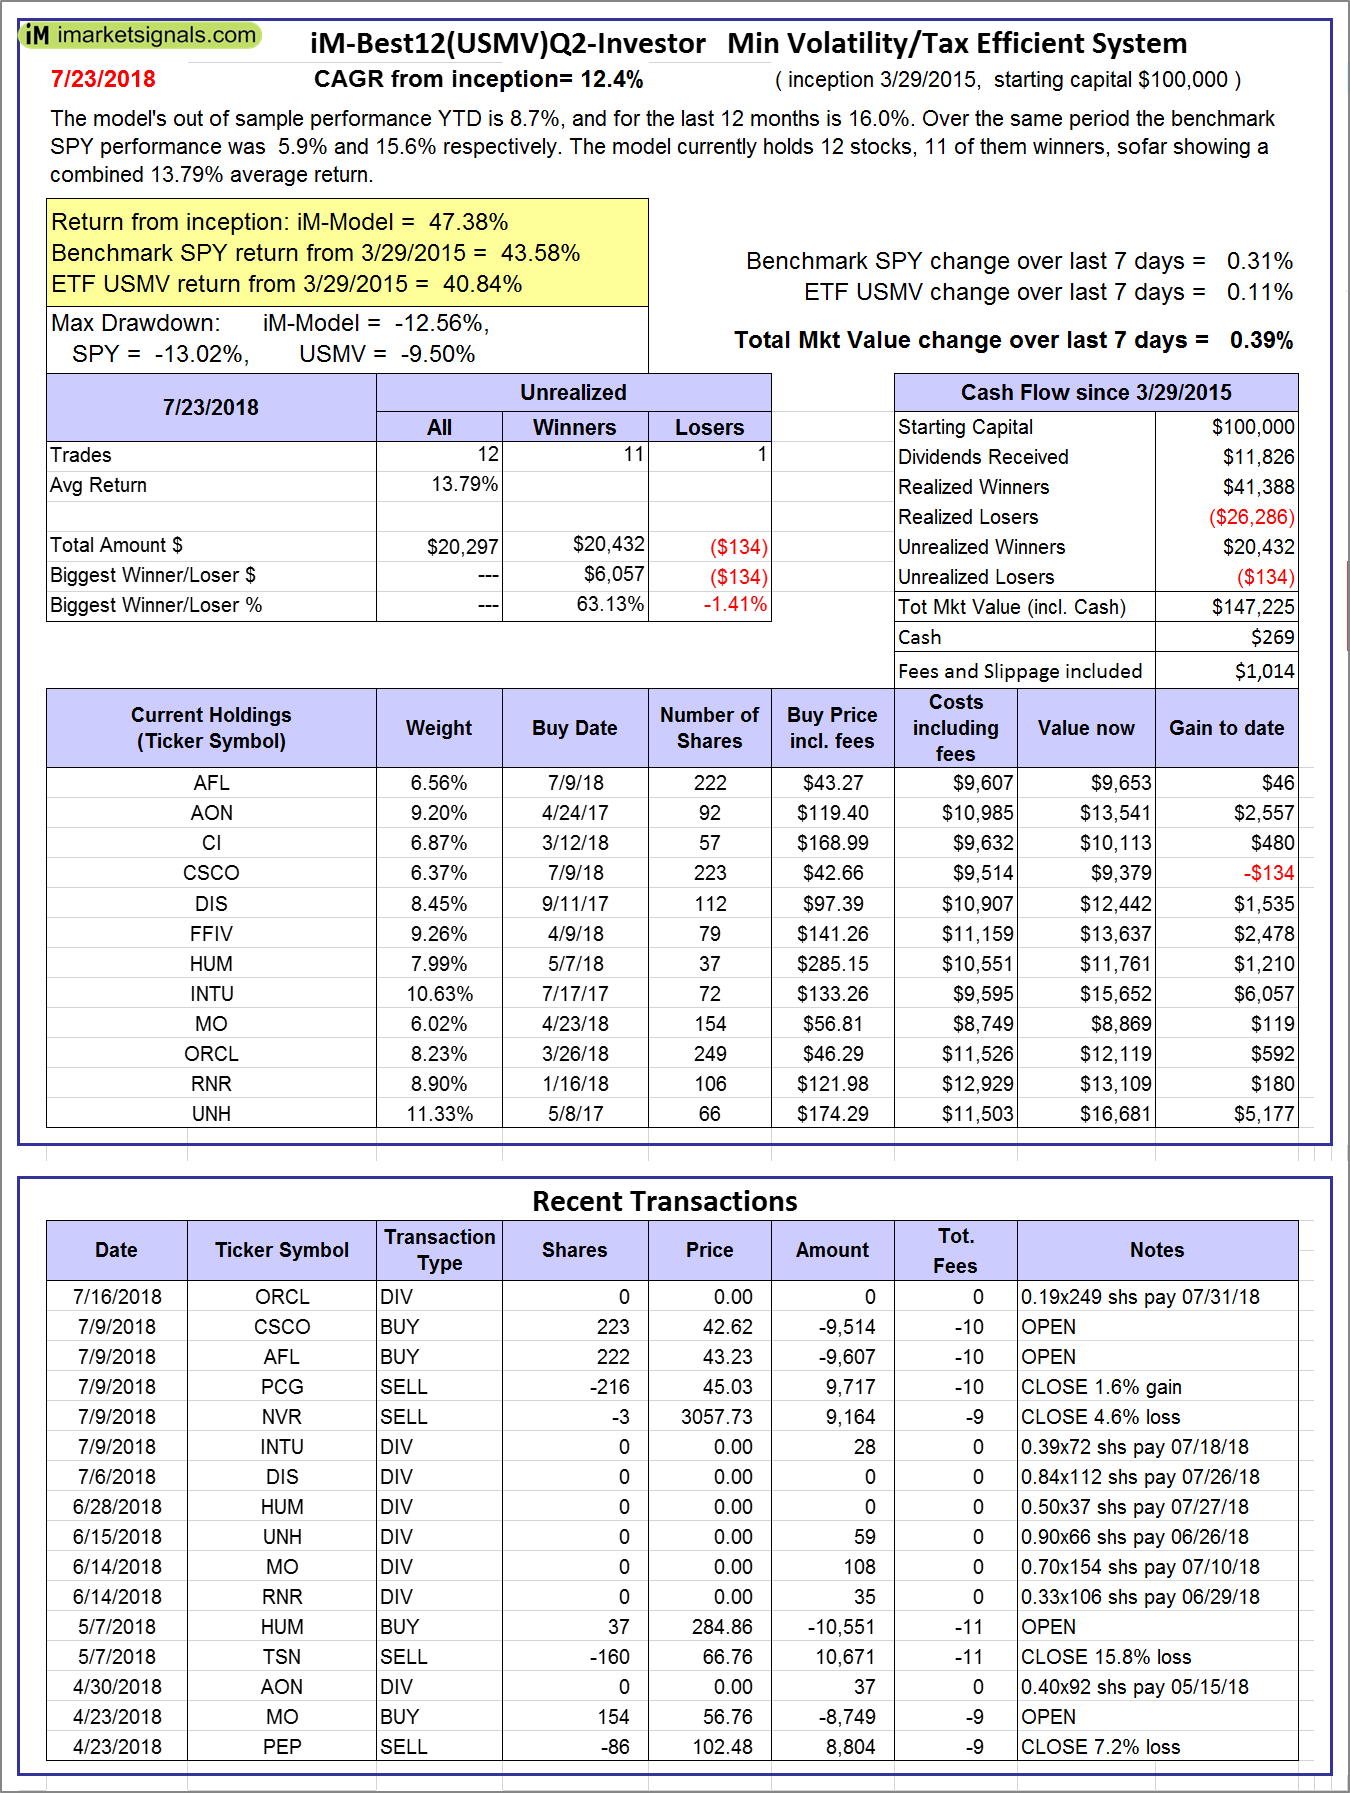
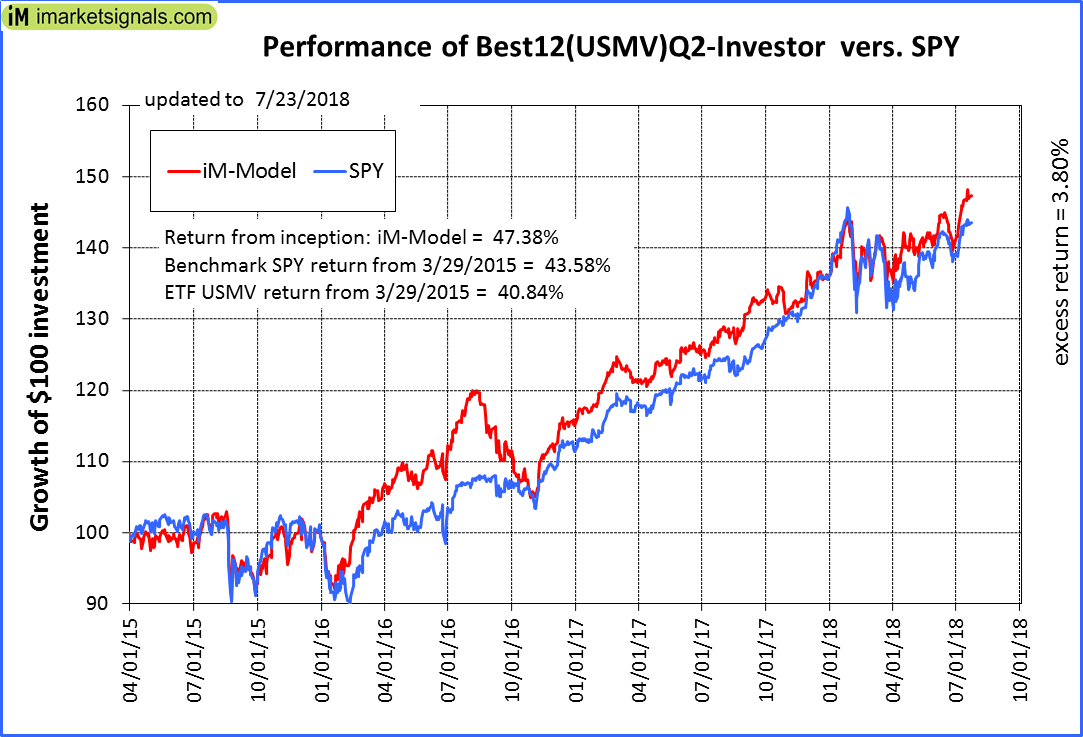
iM-Best12(USMV)Q2-Investor: The model’s out of sample performance YTD is 8.7%, and for the last 12 months is 16.0%. Over the same period the benchmark SPY performance was 5.9% and 15.6% respectively. Since inception, on 3/30/2015, the model gained 47.38% while the benchmark SPY gained 43.58% and the ETF USMV gained 40.84% over the same period. Over the previous week the market value of iM-Best12(USMV)Q2 gained 0.39% at a time when SPY gained 0.31%. A starting capital of $100,000 at inception on 3/30/2015 would have grown to $147,225 which includes $269 cash and excludes $1,014 spent on fees and slippage. |
|
|
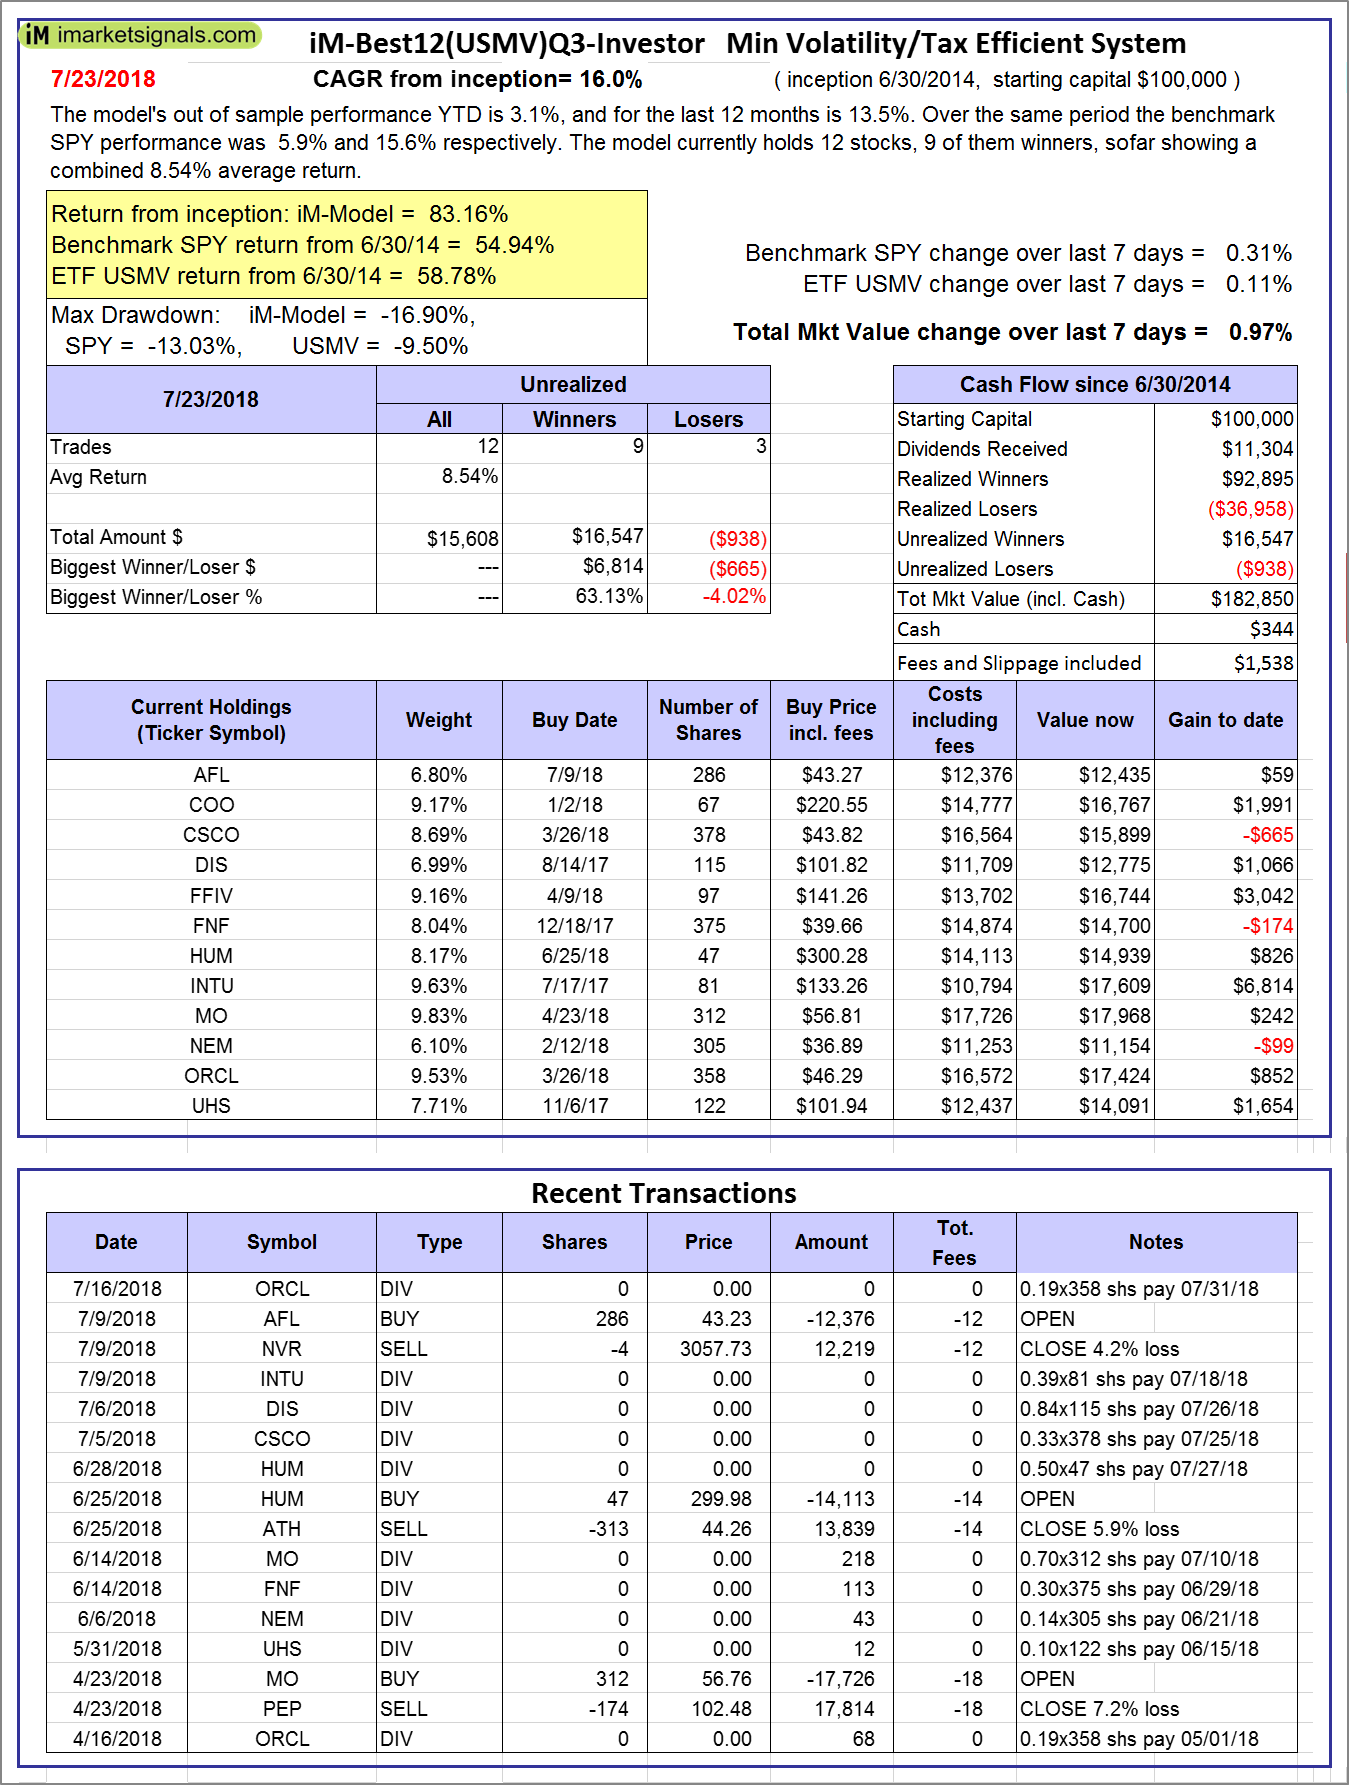
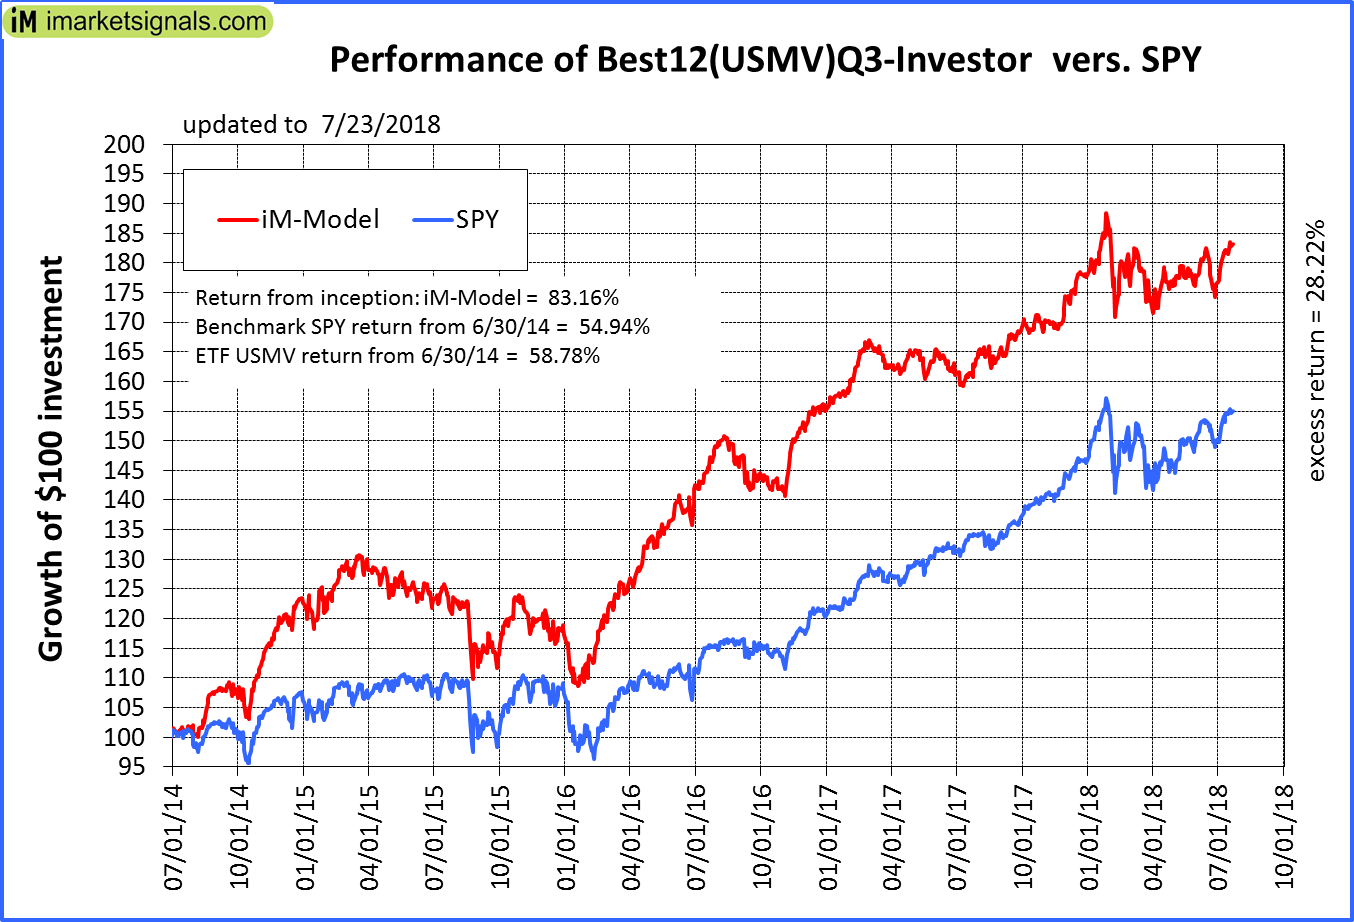
iM-Best12(USMV)Q3-Investor: The model’s out of sample performance YTD is 3.1%, and for the last 12 months is 13.5%. Over the same period the benchmark SPY performance was 5.9% and 15.6% respectively. Since inception, on 7/1/2014, the model gained 83.16% while the benchmark SPY gained 54.94% and the ETF USMV gained 58.78% over the same period. Over the previous week the market value of iM-Best12(USMV)Q3 gained 0.97% at a time when SPY gained 0.31%. A starting capital of $100,000 at inception on 7/1/2014 would have grown to $182,850 which includes $344 cash and excludes $1,538 spent on fees and slippage. |
|
|
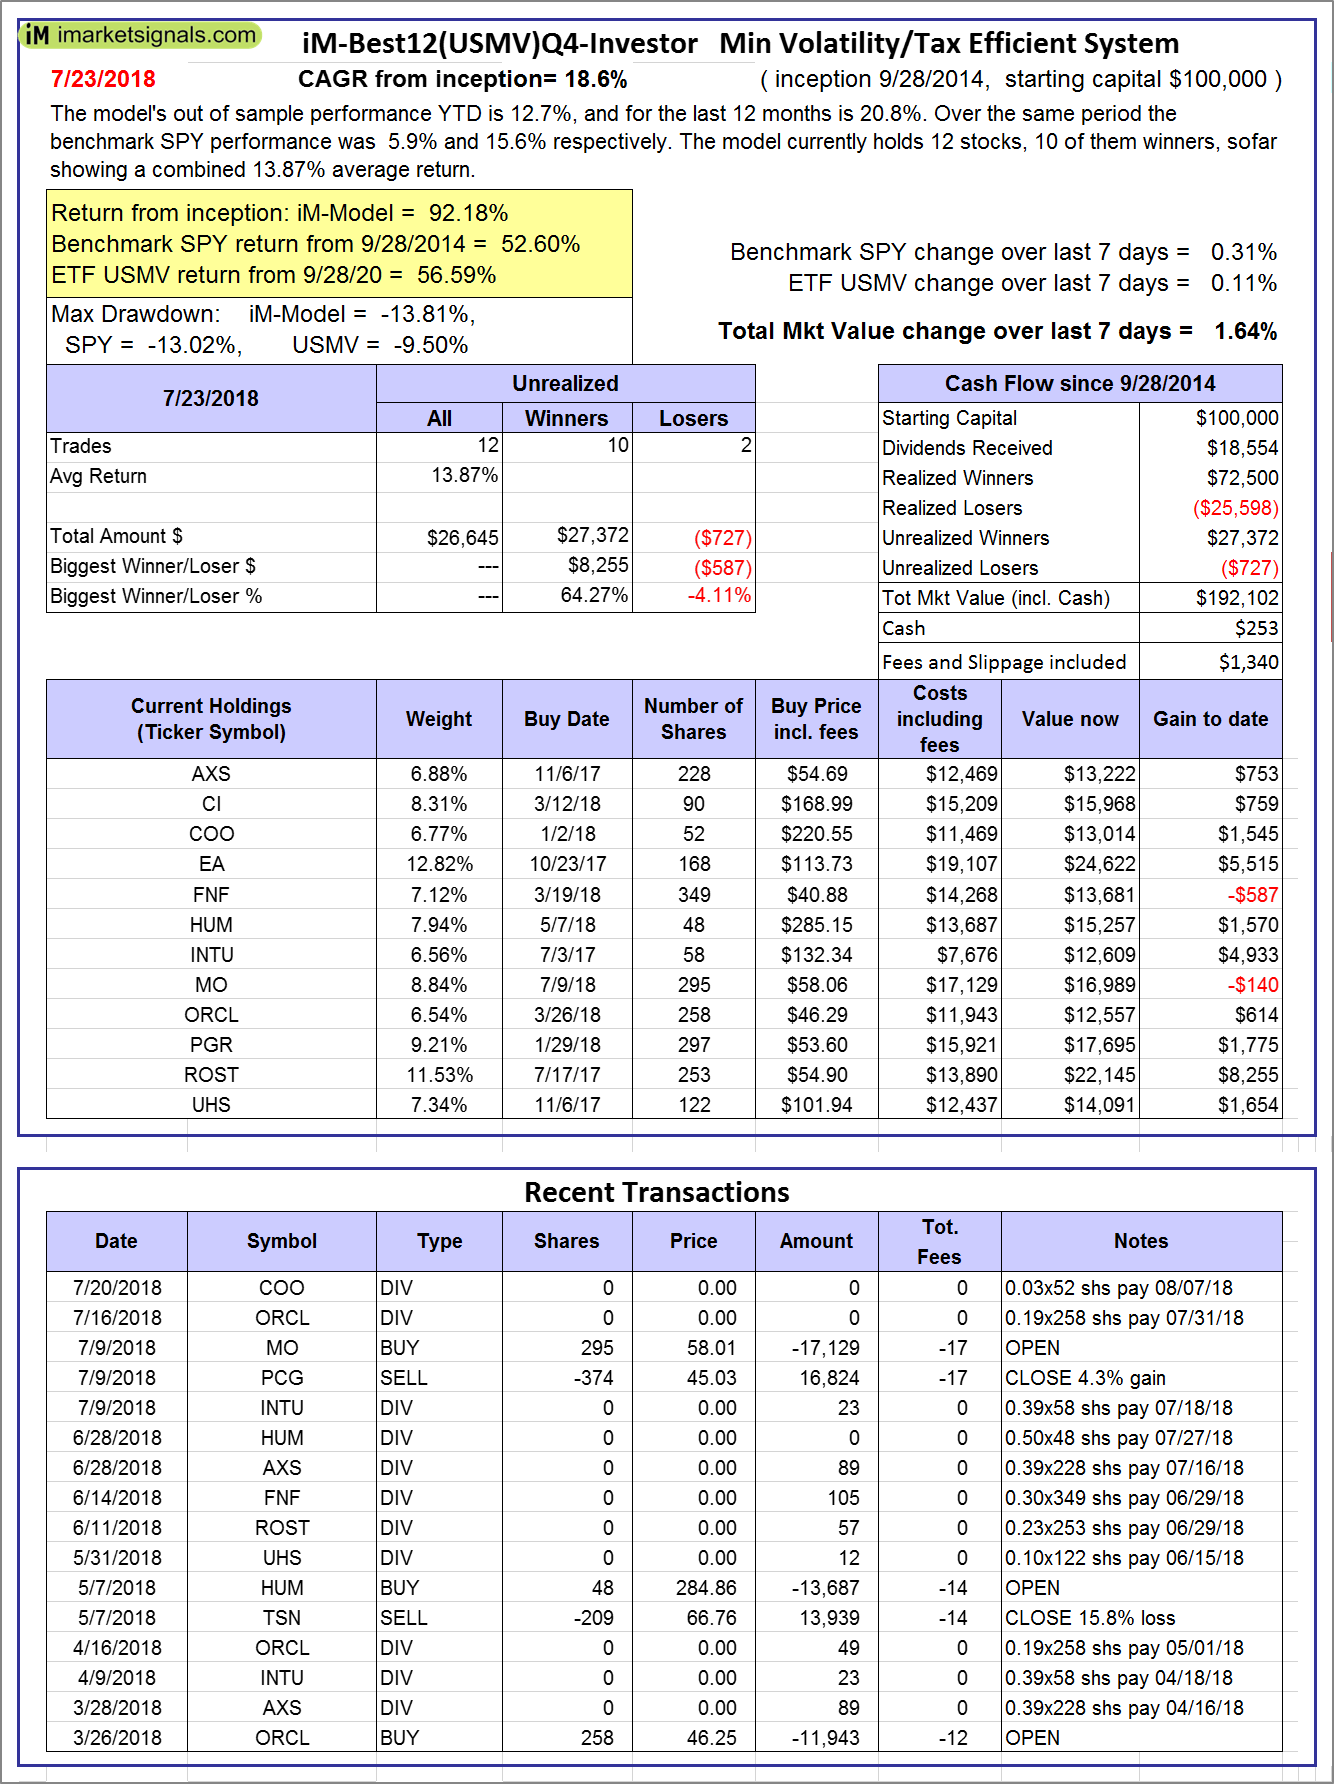
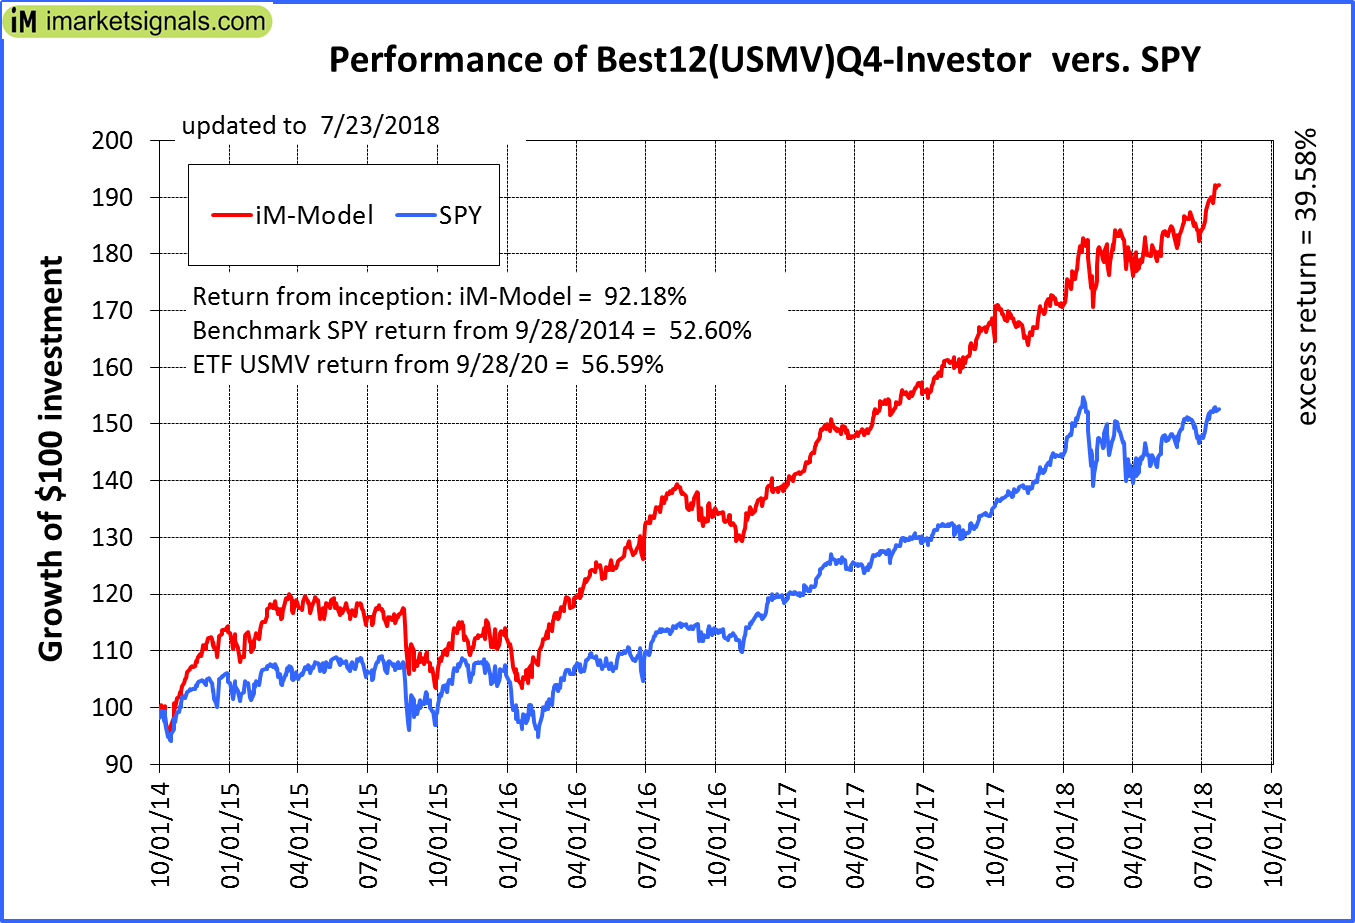
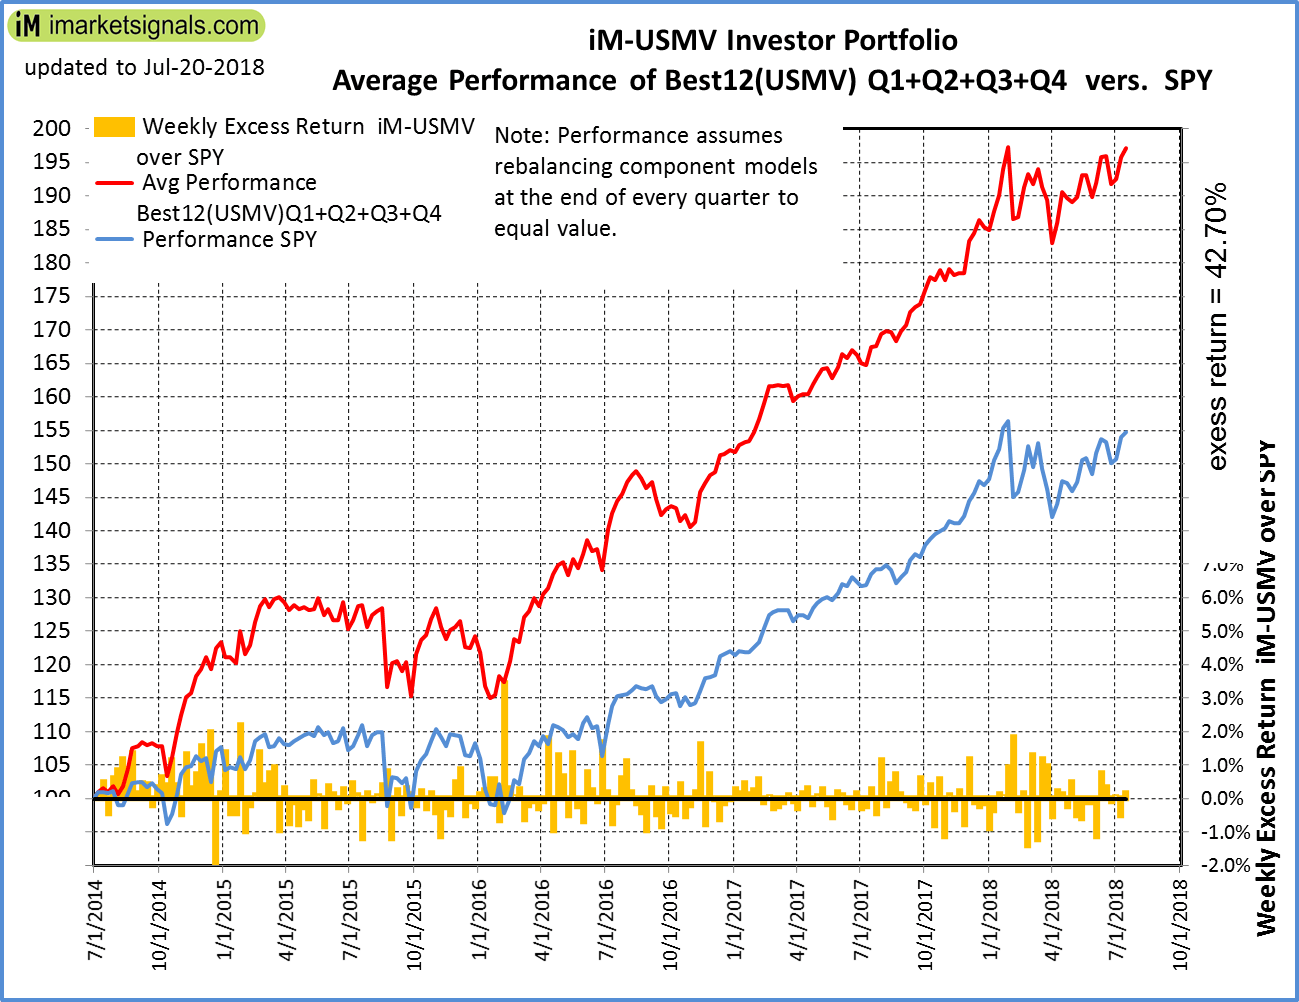
iM-Best12(USMV)Q4-Investor: Since inception, on 9/29/2014, the model gained 92.18% while the benchmark SPY gained 52.60% and the ETF USMV gained 56.59% over the same period. Over the previous week the market value of iM-Best12(USMV)Q4 gained 1.64% at a time when SPY gained 0.31%. A starting capital of $100,000 at inception on 9/29/2014 would have grown to $192,102 which includes $253 cash and excludes $1,340 spent on fees and slippage. |
|
|
Average Performance of iM-Best12(USMV)Q1+Q2+Q3+Q4-Investor resulted in an excess return of 42.70% over SPY. (see iM-USMV Investor Portfolio) |
|
|
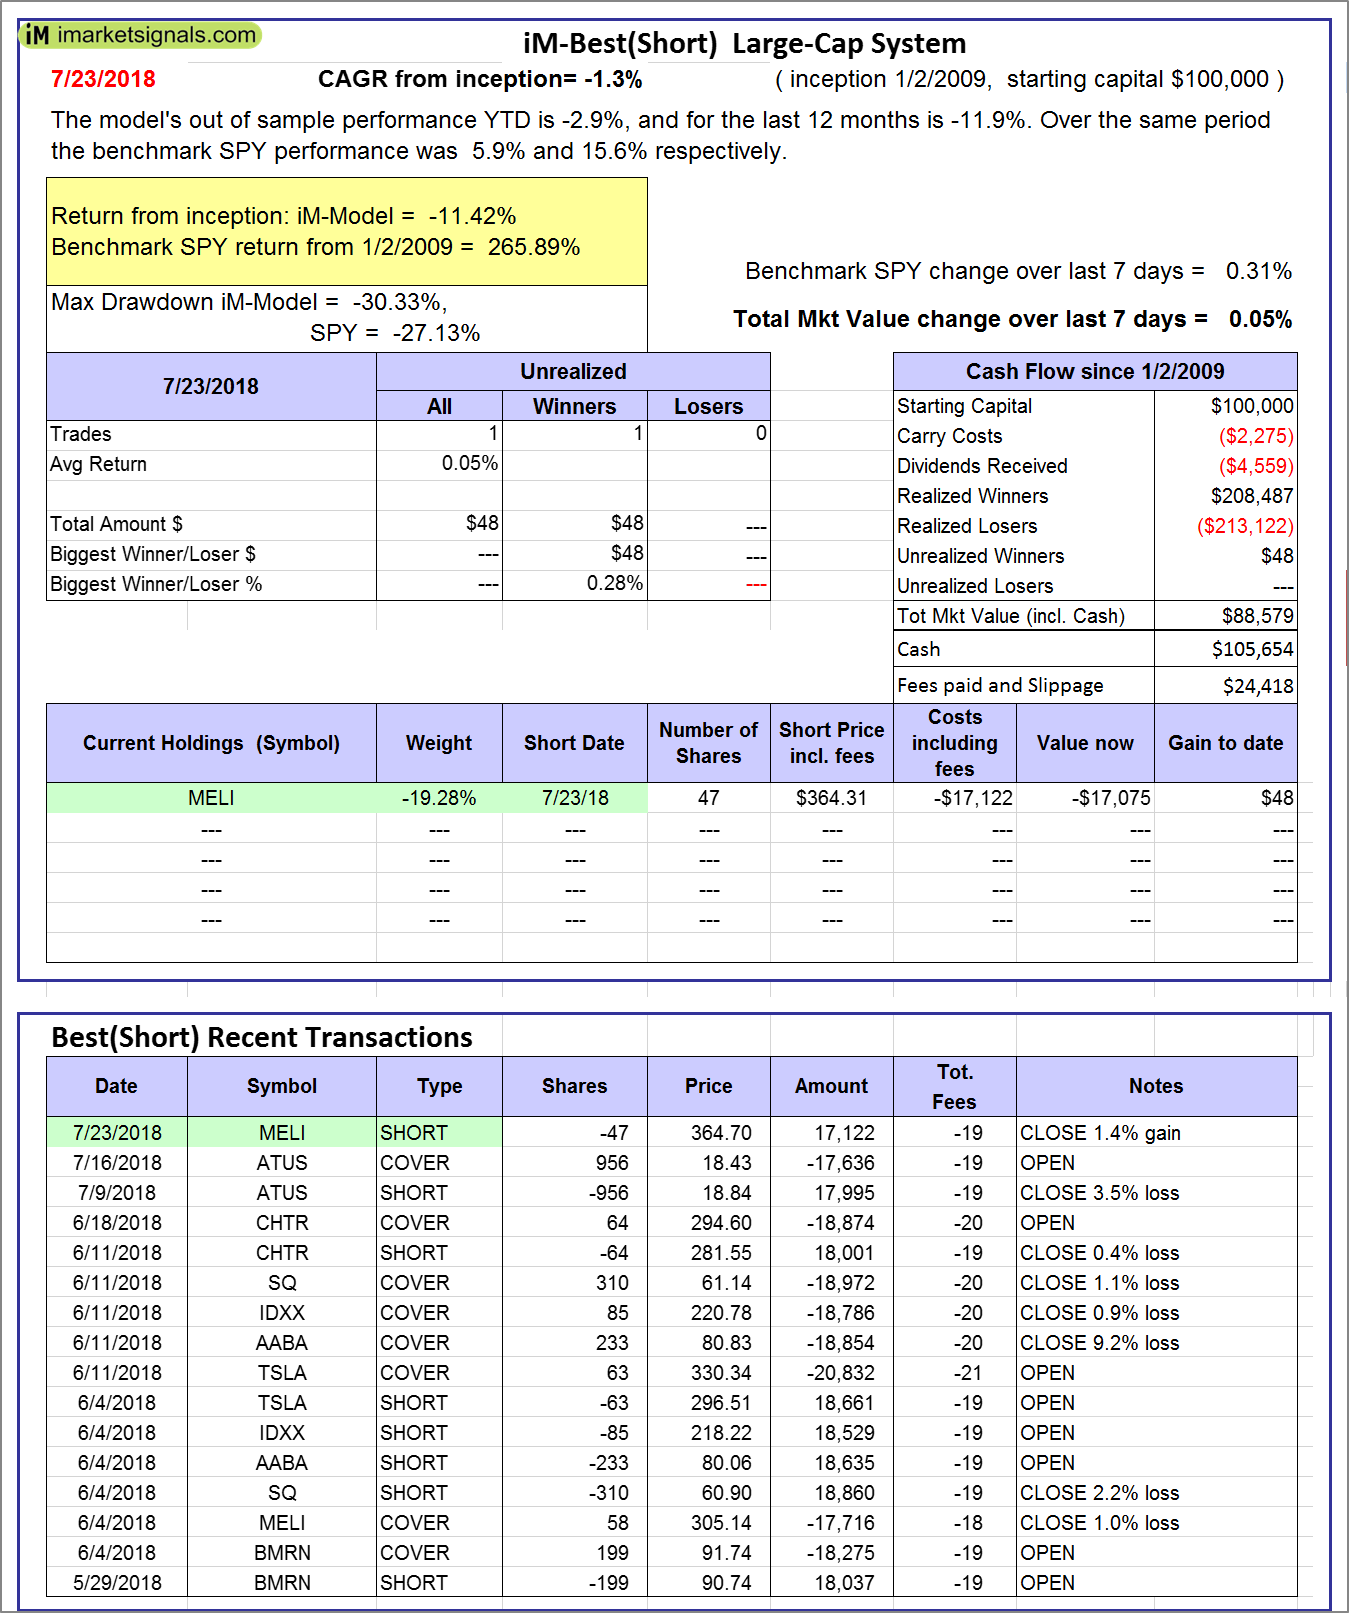
iM-Best(Short): The model’s out of sample performance YTD is -2.9%, and for the last 12 months is -11.9%. Over the same period the benchmark SPY performance was 5.9% and 15.6% respectively. Over the previous week the market value of iM-Best(Short) gained 0.05% at a time when SPY gained 0.31%. Over the period 1/2/2009 to 7/23/2018 the starting capital of $100,000 would have grown to $88,579 which includes $105,654 cash and excludes $24,418 spent on fees and slippage. |
|
|
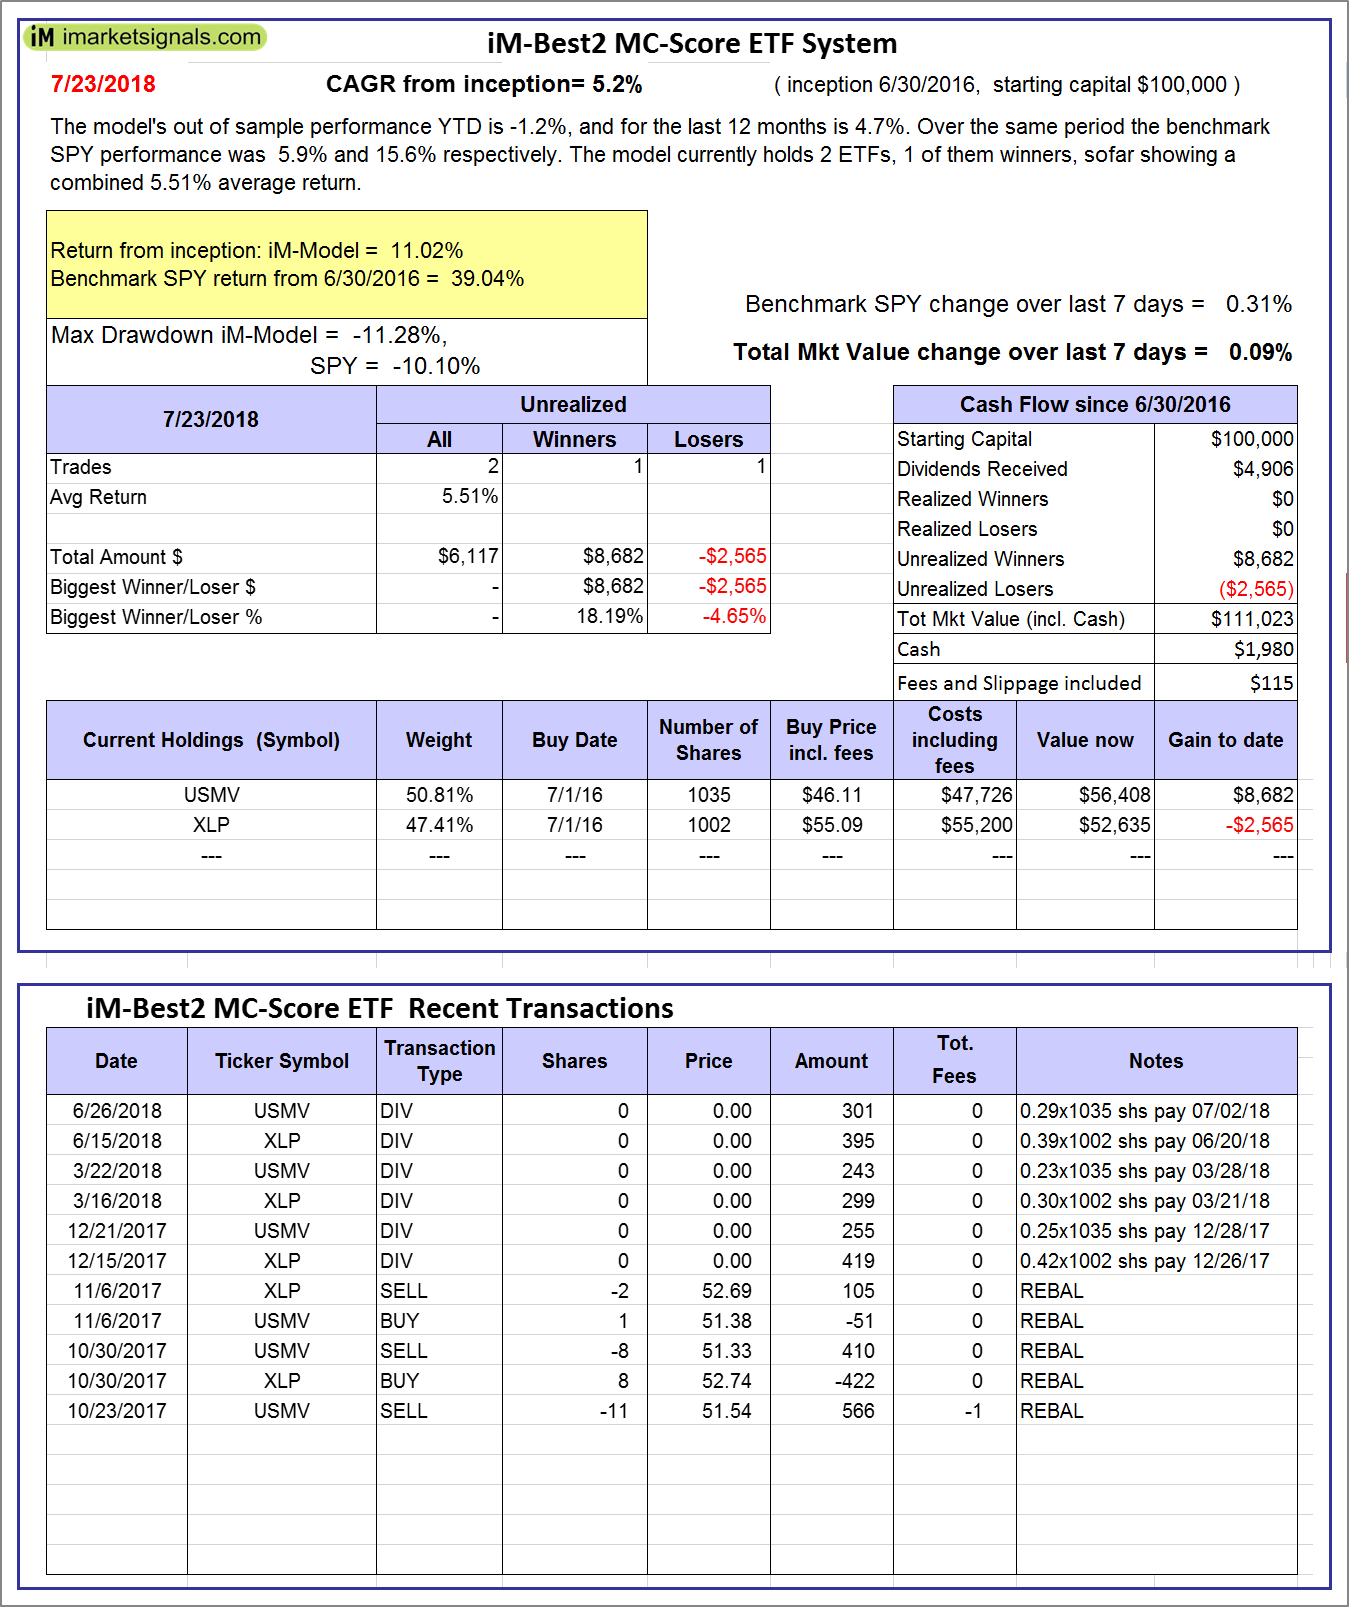
iM-Best2 MC-Score ETF System: The model’s out of sample performance YTD is -1.2%, and for the last 12 months is 4.7%. Over the same period the benchmark SPY performance was 5.9% and 15.6% respectively. Over the previous week the market value of the iM-Best2 MC-Score ETF System gained 0.09% at a time when SPY gained 0.31%. A starting capital of $100,000 at inception on 6/30/2016 would have grown to $111,023 which includes $1,980 cash and excludes $115 spent on fees and slippage. |
|
|
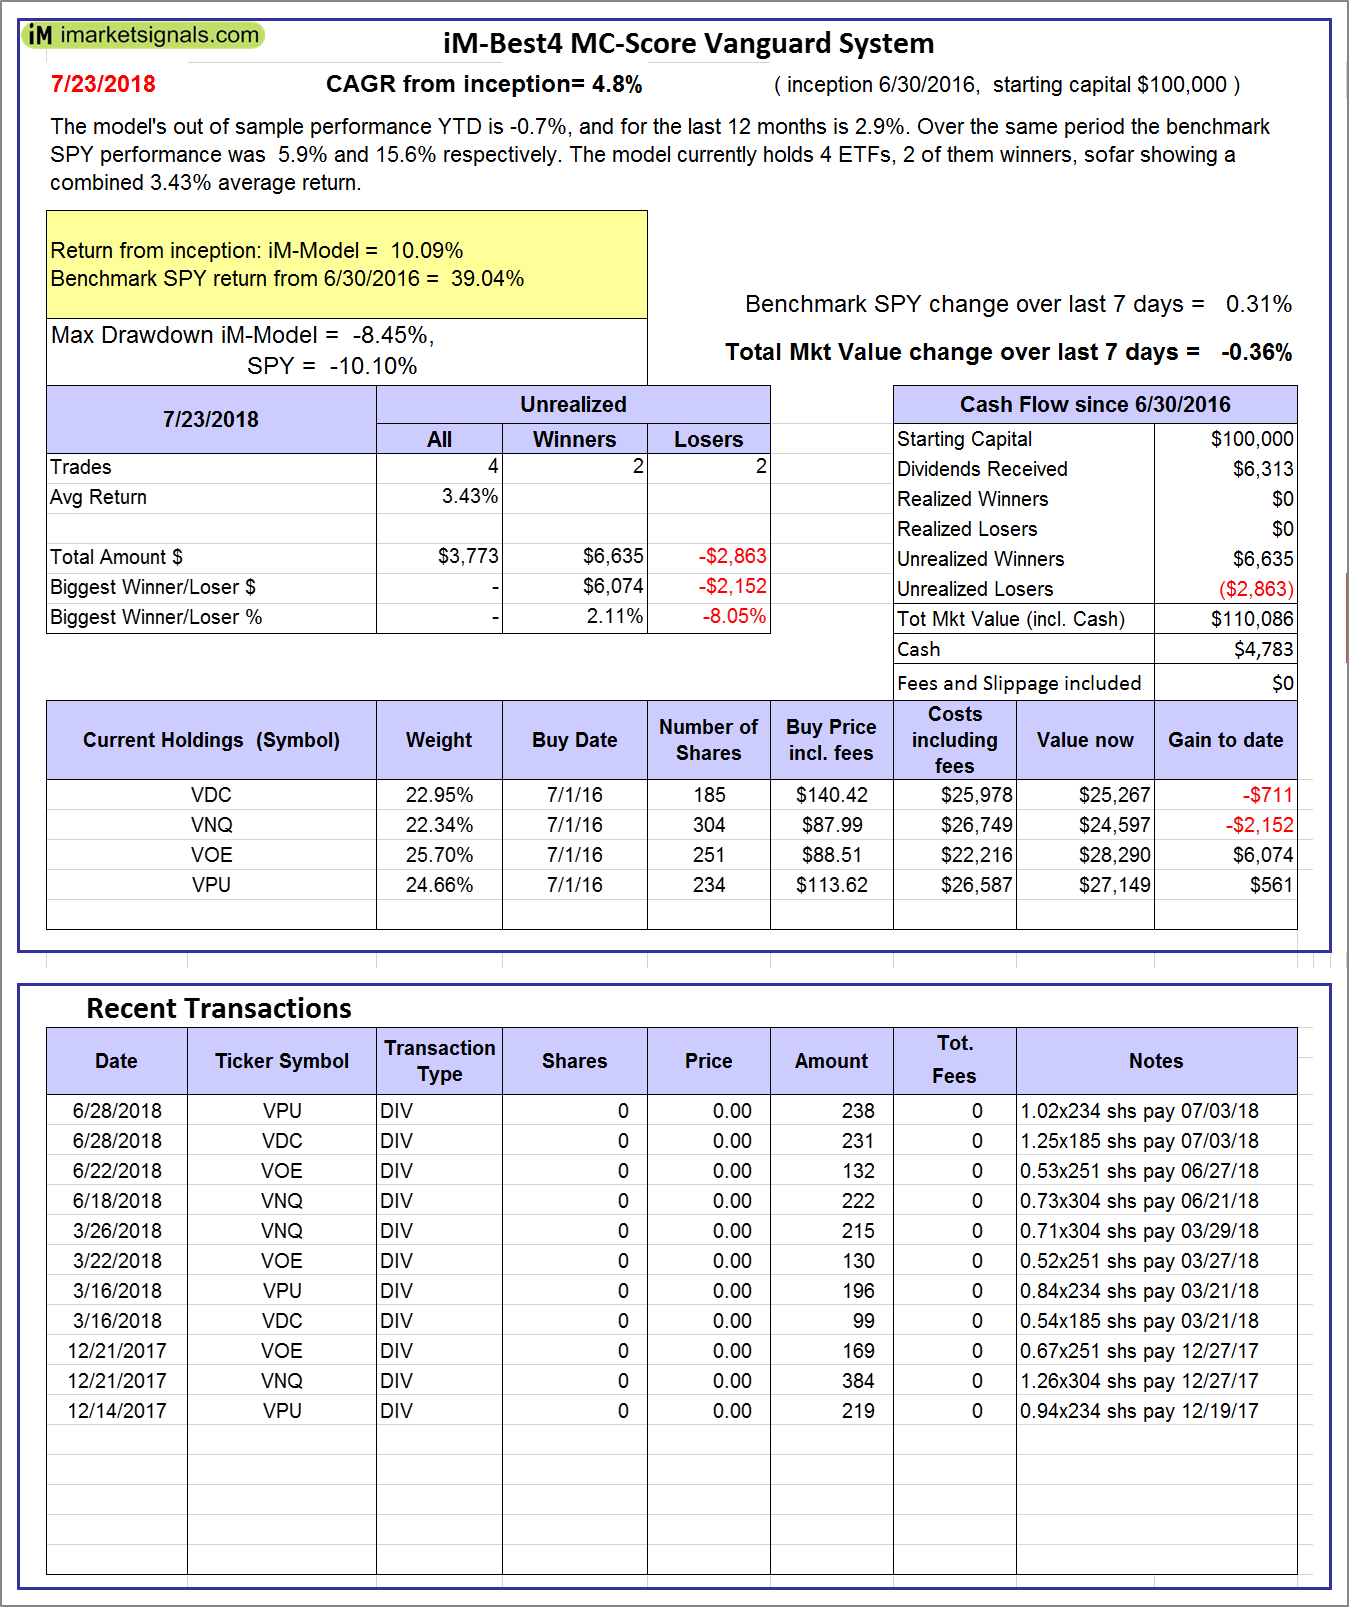
iM-Best4 MC-Score Vanguard System: The model’s out of sample performance YTD is -0.7%, and for the last 12 months is 2.9%. Over the same period the benchmark SPY performance was 5.9% and 15.6% respectively. Over the previous week the market value of the iM-Best4 MC-Score Vanguard System gained -0.36% at a time when SPY gained 0.31%. A starting capital of $100,000 at inception on 6/30/2016 would have grown to $110,086 which includes $4,783 cash and excludes $00 spent on fees and slippage. |
|
|
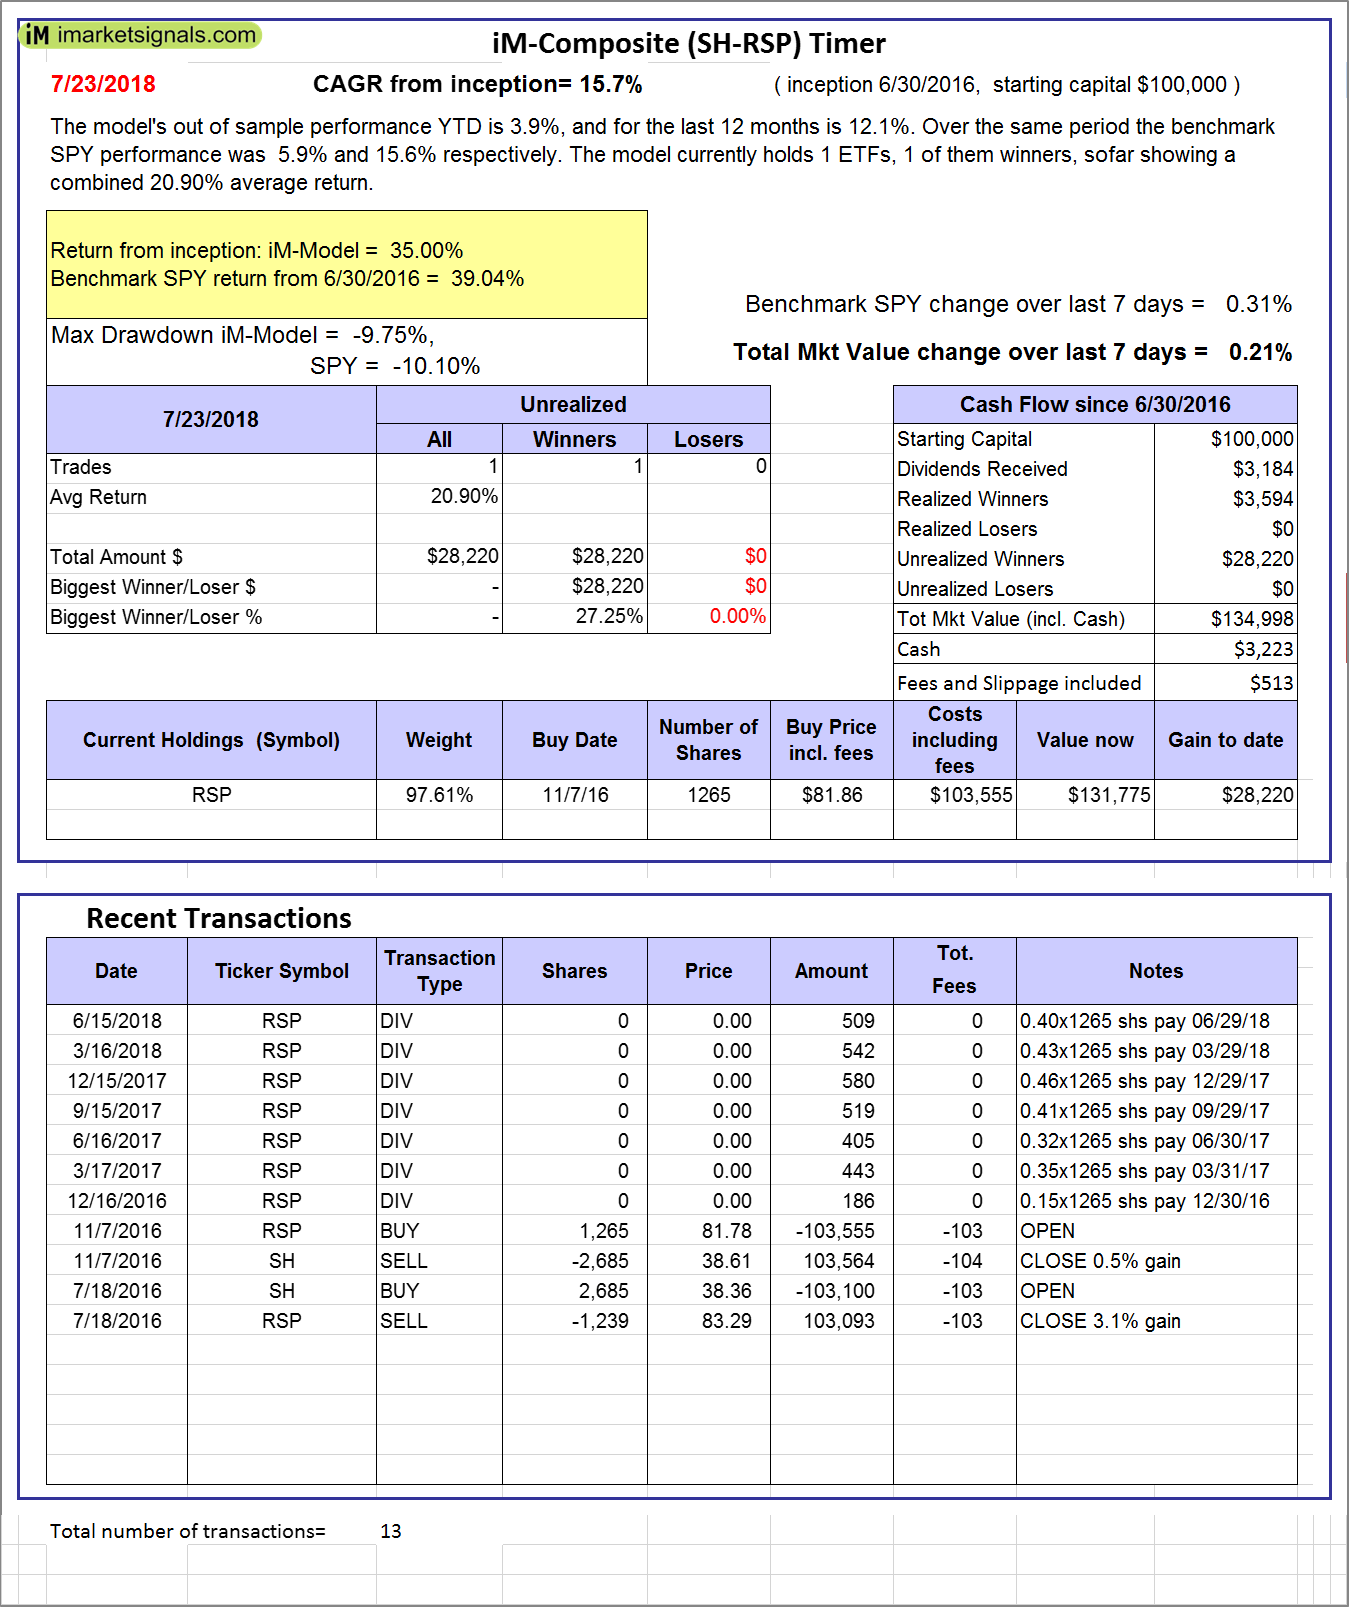
iM-Composite (SH-RSP) Timer: The model’s out of sample performance YTD is 3.9%, and for the last 12 months is 12.1%. Over the same period the benchmark SPY performance was 5.9% and 15.6% respectively. Over the previous week the market value of the iM-Composite (SH-RSP) Timer gained 0.21% at a time when SPY gained 0.31%. A starting capital of $100,000 at inception on 6/30/2016 would have grown to $134,998 which includes $3,223 cash and excludes $513 spent on fees and slippage. |
|
|
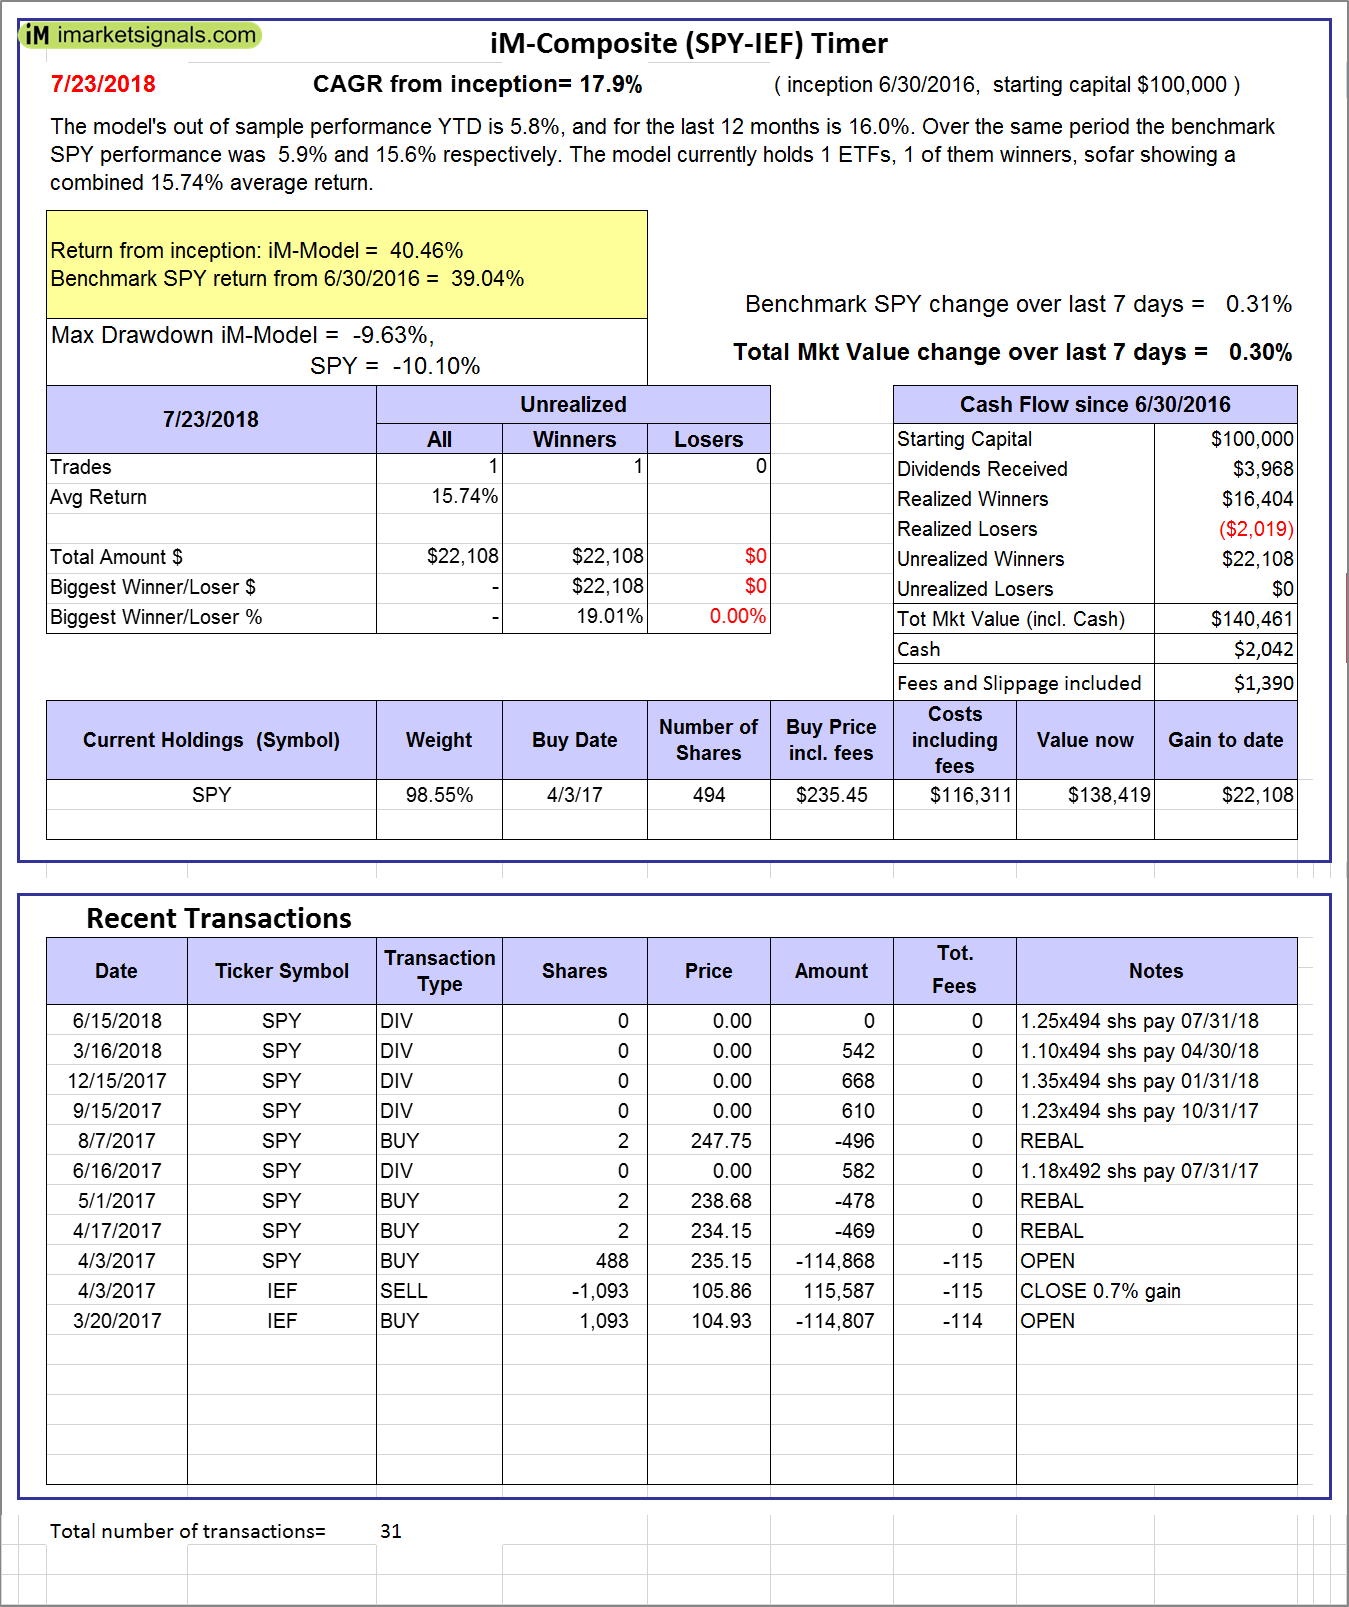
iM-Composite (SPY-IEF) Timer: The model’s out of sample performance YTD is 5.8%, and for the last 12 months is 16.0%. Over the same period the benchmark SPY performance was 5.9% and 15.6% respectively. Over the previous week the market value of the iM-Composite (SPY-IEF) Timer gained 0.30% at a time when SPY gained 0.31%. A starting capital of $100,000 at inception on 6/30/2016 would have grown to $140,461 which includes $2,042 cash and excludes $1,390 spent on fees and slippage. |
|
|
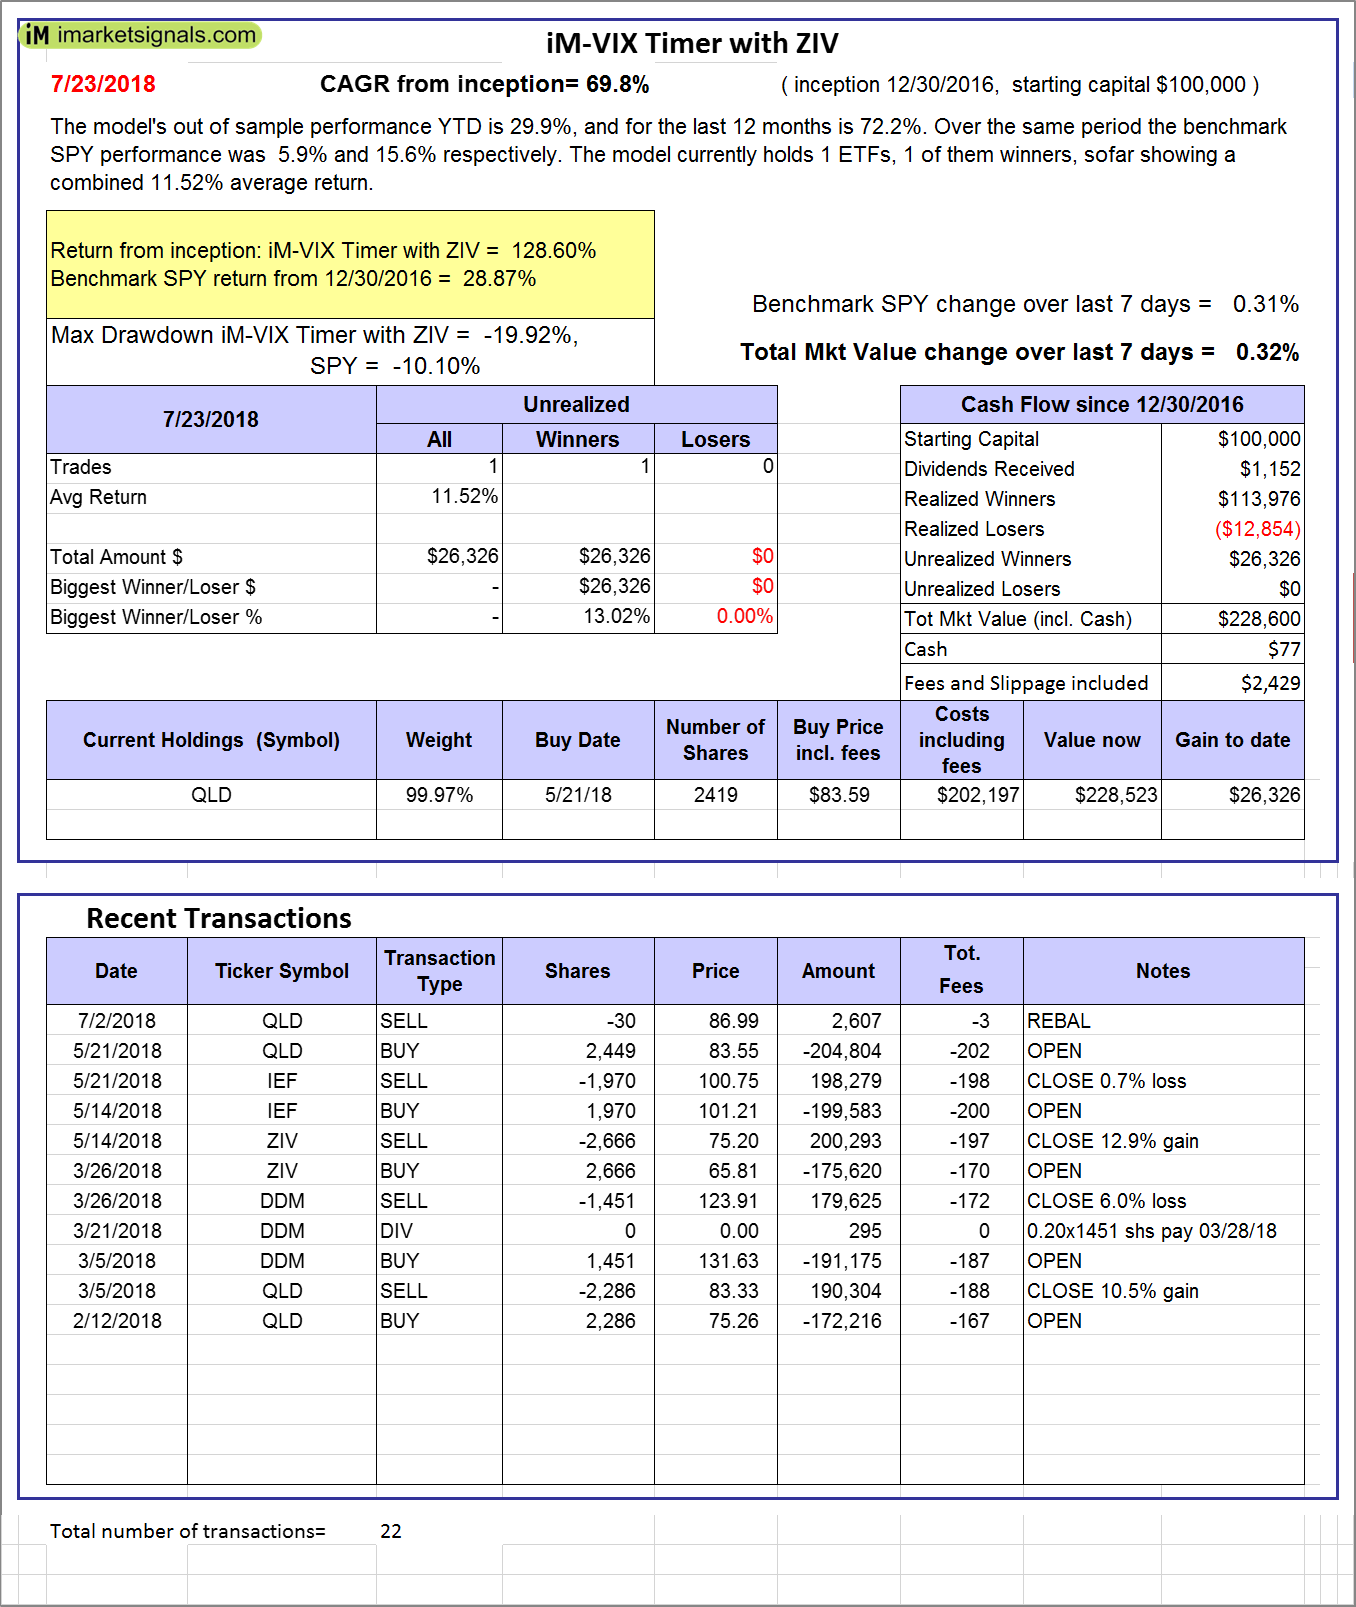
iM-VIX Timer with ZIV: The model’s out of sample performance YTD is 29.9%, and for the last 12 months is 72.2%. Over the same period the benchmark SPY performance was 5.9% and 15.6% respectively. Over the previous week the market value of the iM-VIX Timer with ZIV gained 0.32% at a time when SPY gained 0.31%. A starting capital of $100,000 at inception on 6/30/2016 would have grown to $228,600 which includes $77 cash and excludes $2,429 spent on fees and slippage. |
|
|
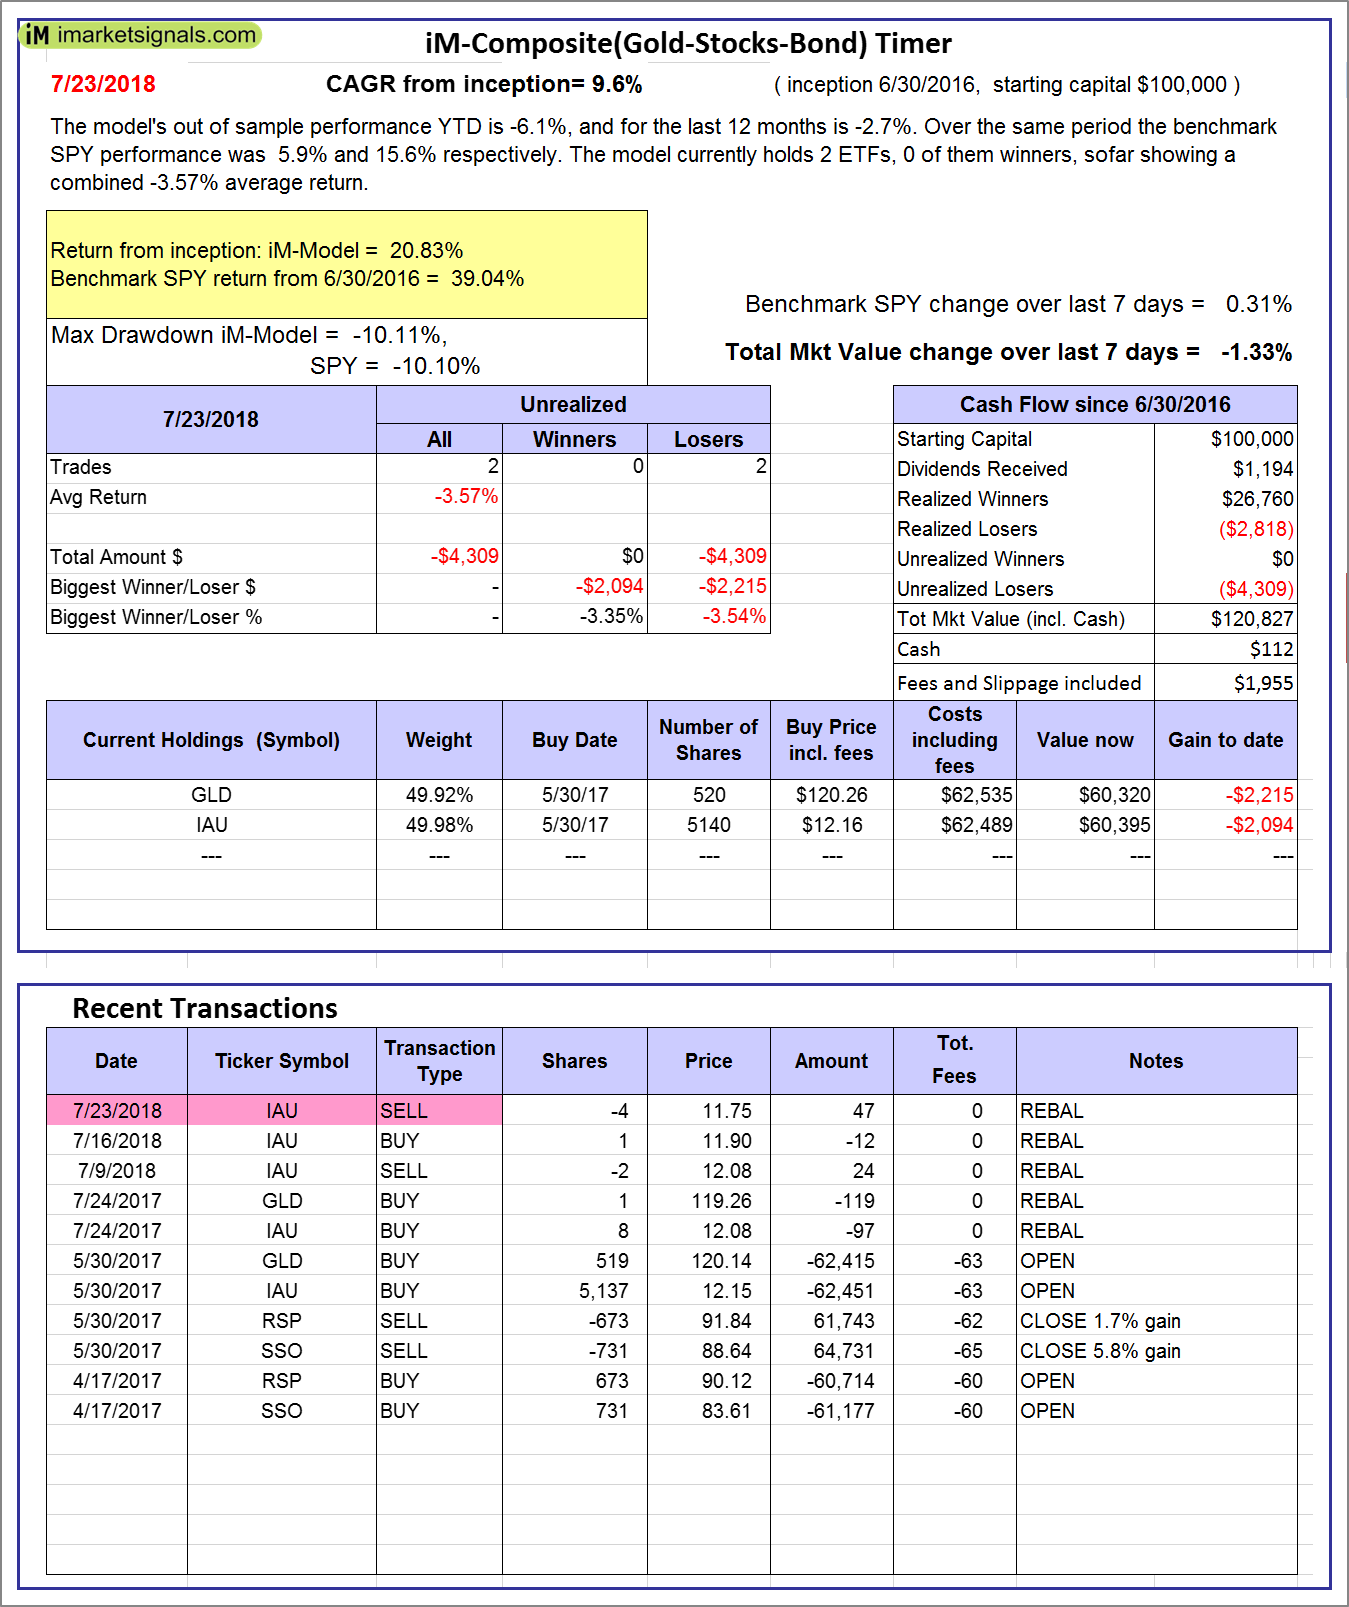
iM-Composite(Gold-Stocks-Bond) Timer: The model’s out of sample performance YTD is -6.1%, and for the last 12 months is -2.7%. Over the same period the benchmark SPY performance was 5.9% and 15.6% respectively. Over the previous week the market value of the iM-Composite(Gold-Stocks-Bond) Timer gained -1.33% at a time when SPY gained 0.31%. A starting capital of $100,000 at inception on 6/30/2016 would have grown to $120,827 which includes $112 cash and excludes $1,955 spent on fees and slippage. |
|
|
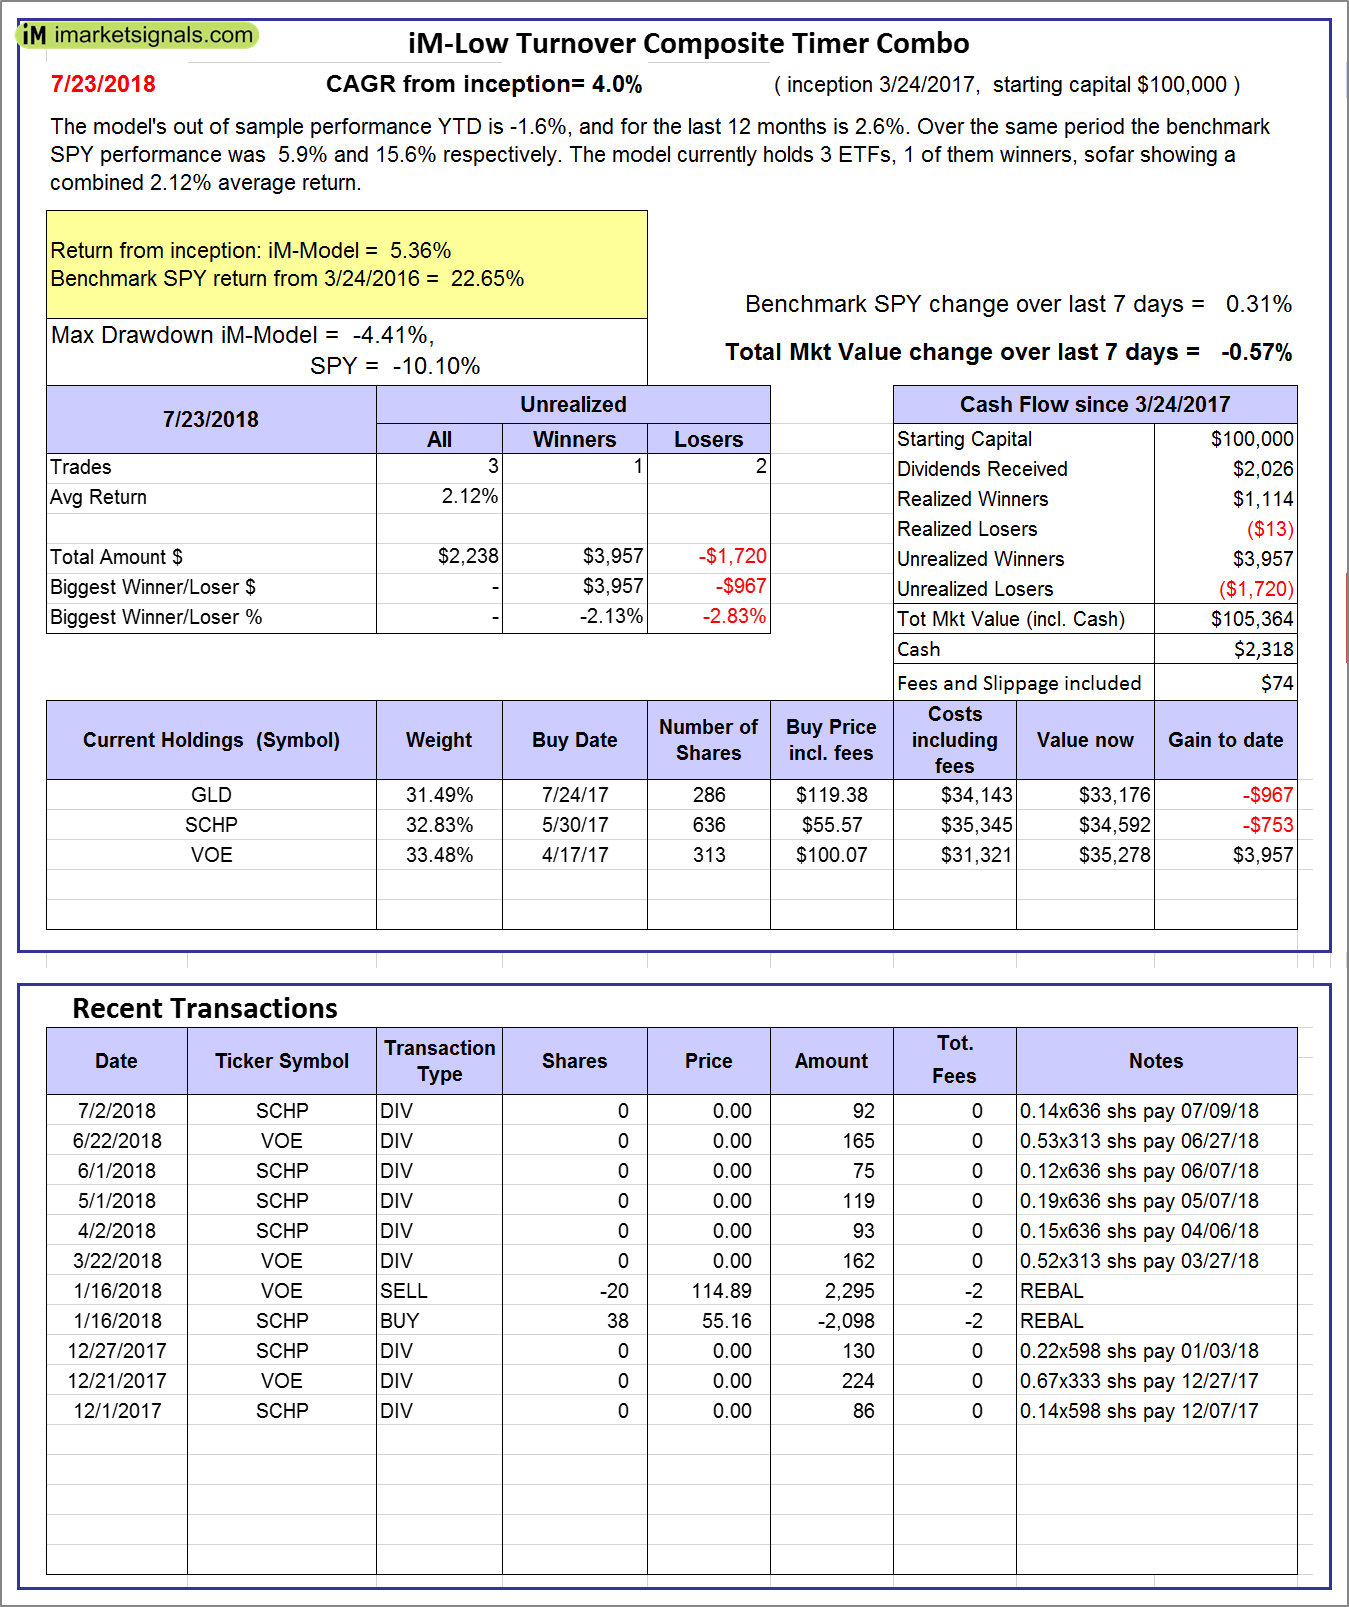
iM-Low Turnover Composite Timer Combo: The model’s out of sample performance YTD is -1.6%, and for the last 12 months is 2.6%. Over the same period the benchmark SPY performance was 5.9% and 15.6% respectively. Over the previous week the market value of the iM-Low Turnover Composite Timer Combo gained -0.57% at a time when SPY gained 0.31%. A starting capital of $100,000 at inception on 3/24/27 would have grown to $105,364 which includes $2,318 cash and excludes $74 spent on fees and slippage. |
|
|
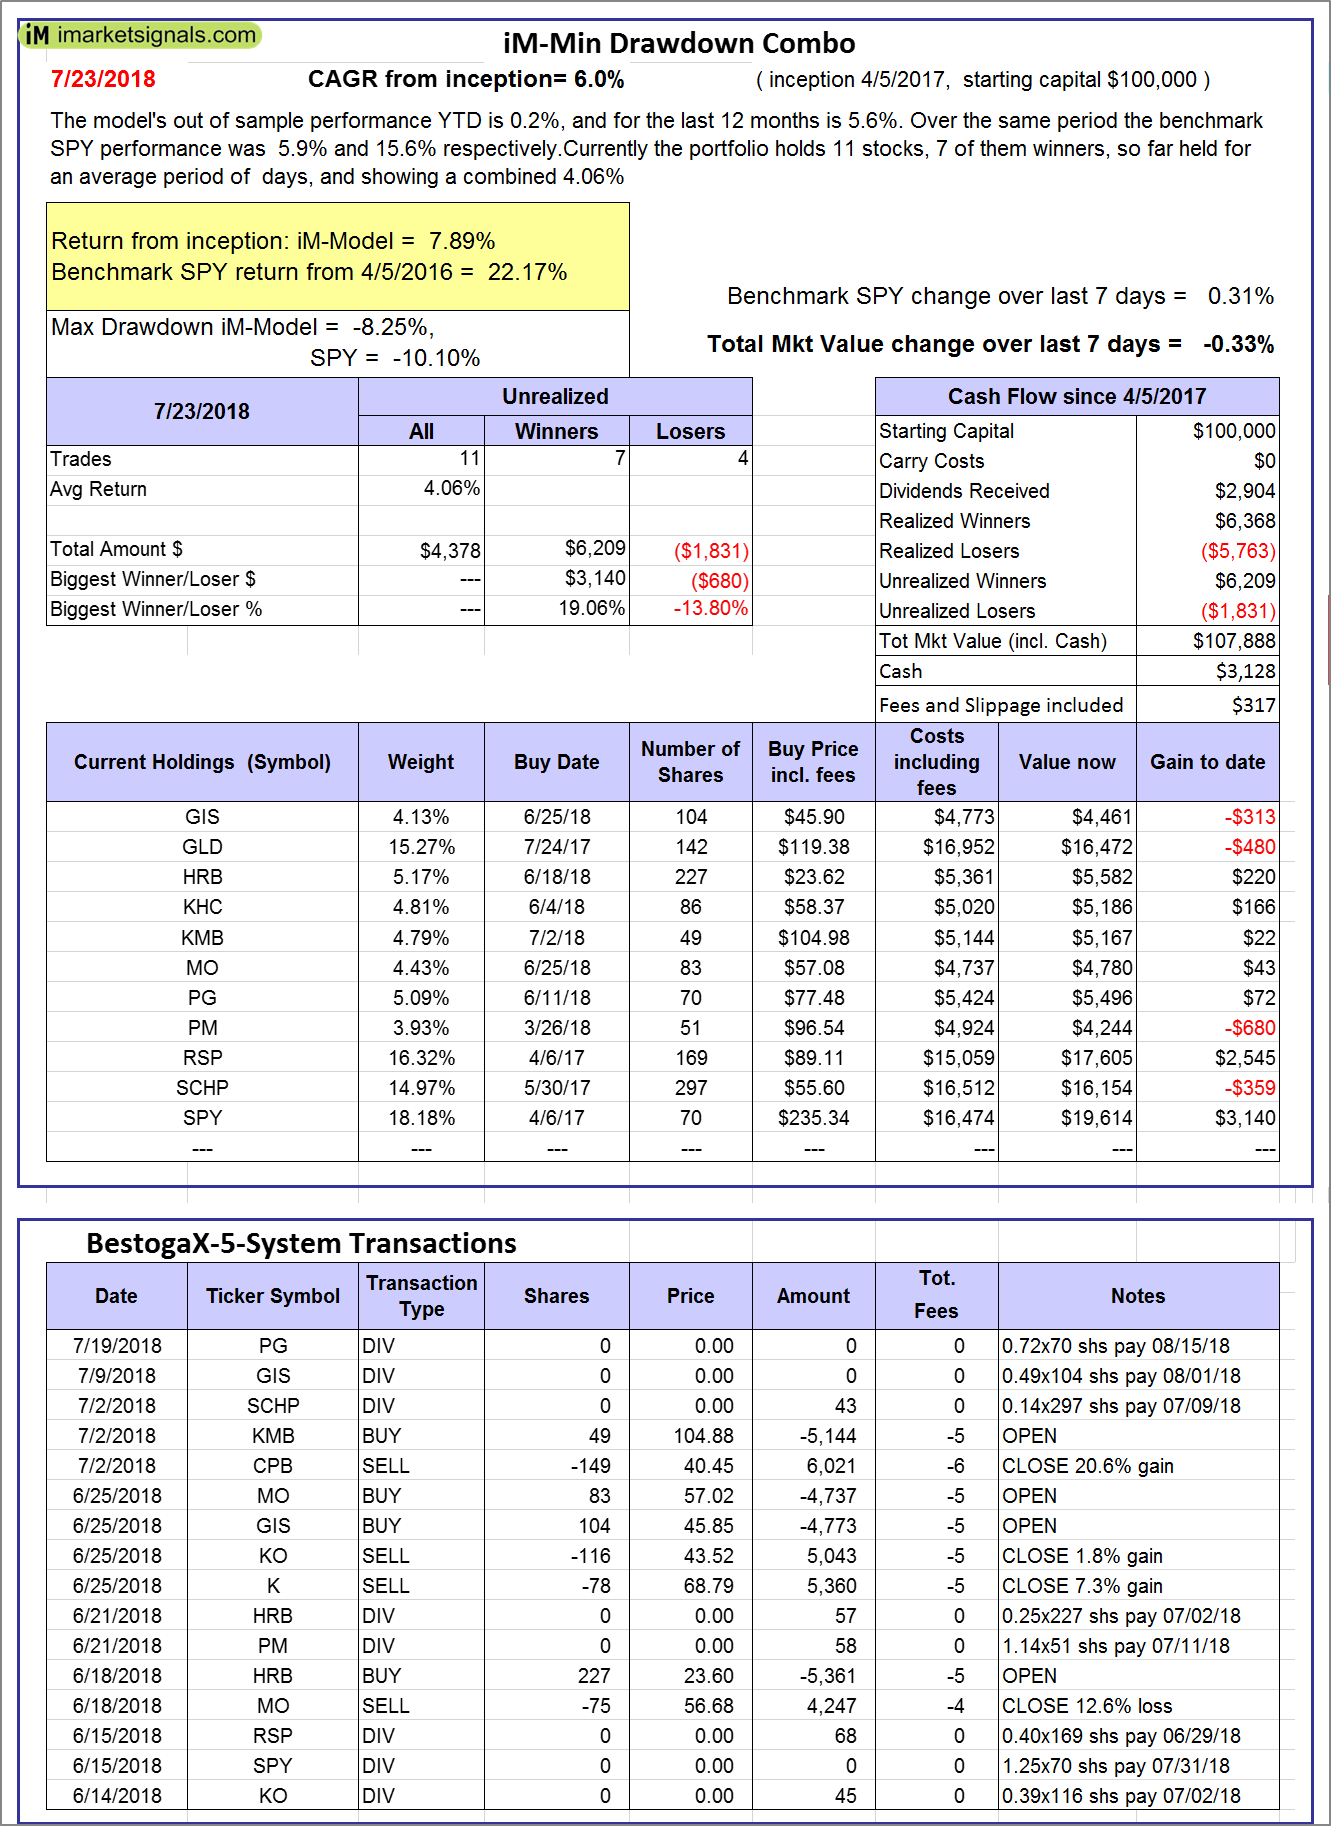
iM-Min Drawdown Combo: The model’s out of sample performance YTD is 0.2%, and for the last 12 months is 5.6%. Over the same period the benchmark SPY performance was 5.9% and 15.6% respectively. Over the previous week the market value of the iM-Min Drawdown Combo gained -0.33% at a time when SPY gained 0.31%. A starting capital of $100,000 at inception on 4/5/2017 would have grown to $107,888 which includes $3,128 cash and excludes $317 spent on fees and slippage. |
|
|
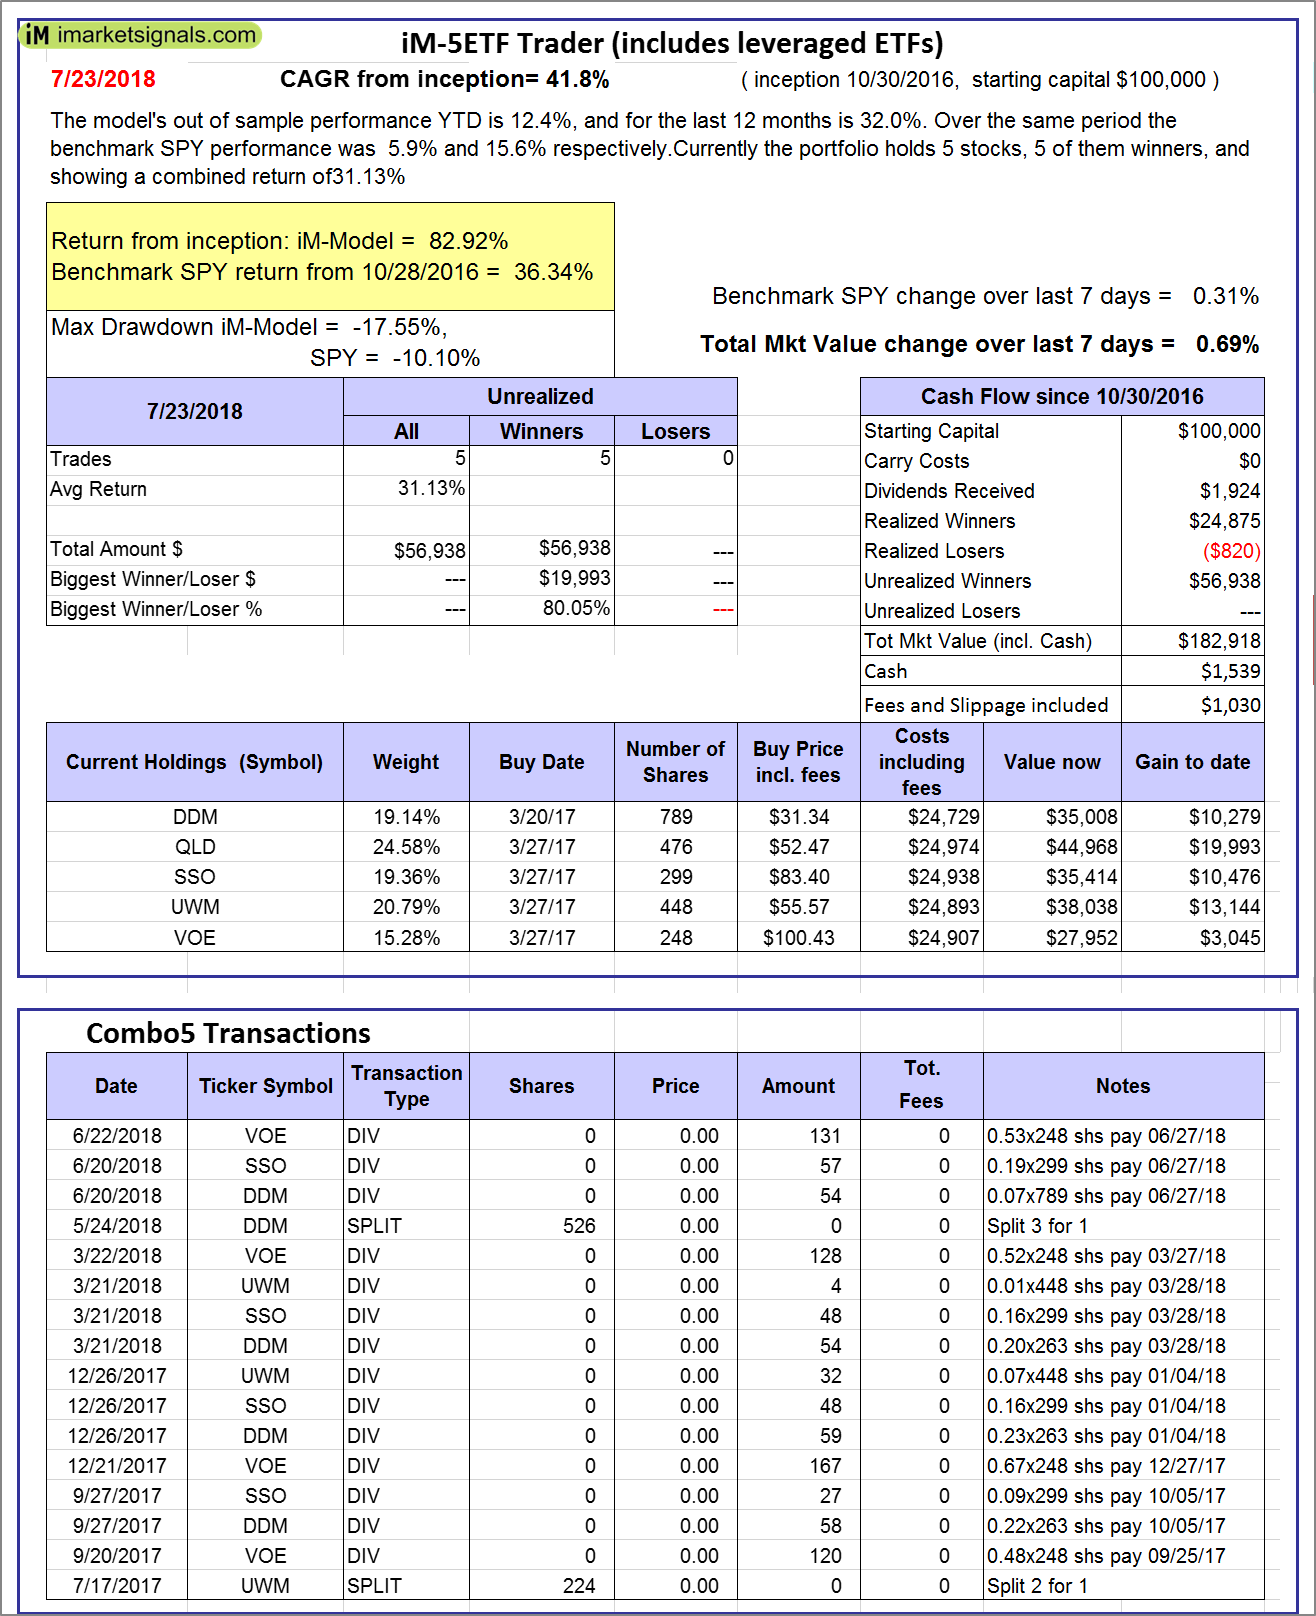
iM-5ETF Trader (includes leveraged ETFs): The model’s out of sample performance YTD is 12.4%, and for the last 12 months is 32.0%. Over the same period the benchmark SPY performance was 5.9% and 15.6% respectively. Over the previous week the market value of the iM-5ETF Trader (includes leveraged ETFs) gained 0.69% at a time when SPY gained 0.31%. A starting capital of $100,000 at inception on 10/30/2016 would have grown to $182,918 which includes $1,539 cash and excludes $1,030 spent on fees and slippage. |
|
|
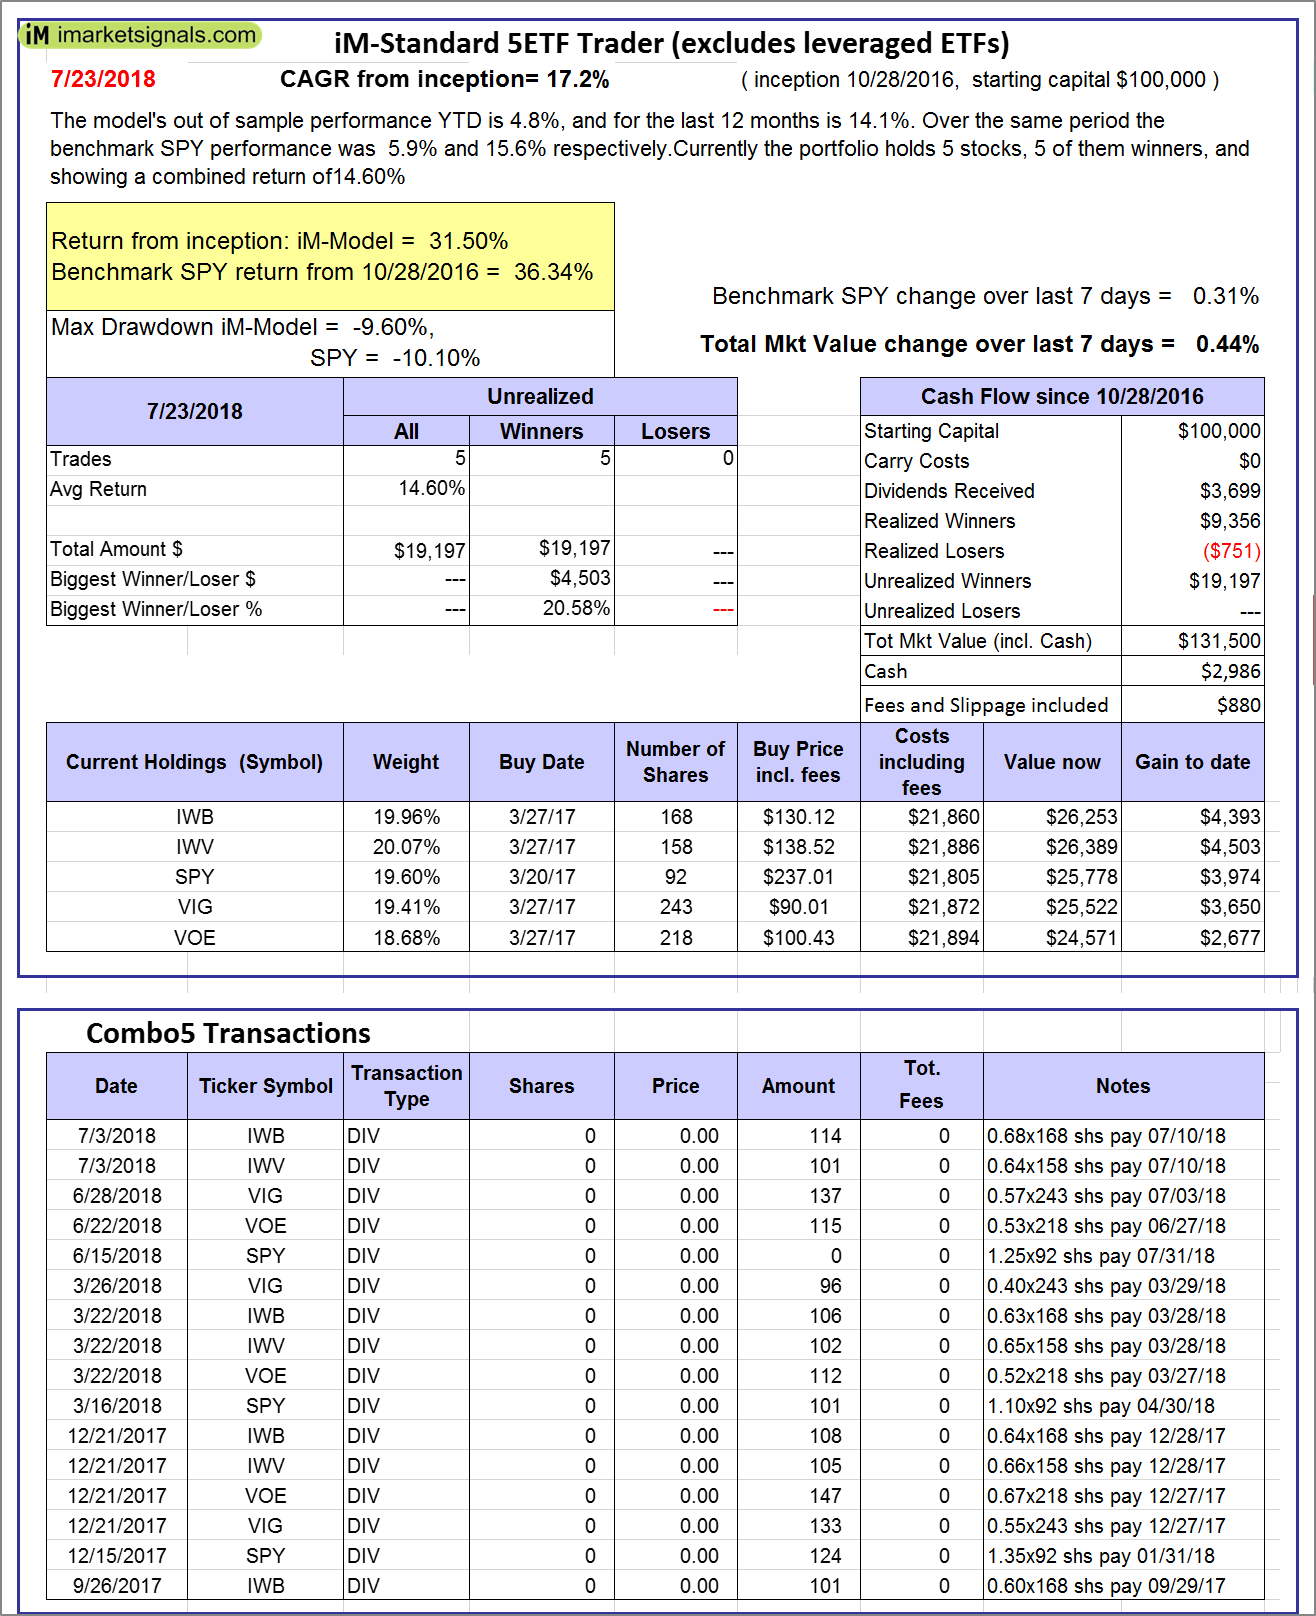
iM-Standard 5ETF Trader (excludes leveraged ETFs): The model’s out of sample performance YTD is 4.8%, and for the last 12 months is 14.1%. Over the same period the benchmark SPY performance was 5.9% and 15.6% respectively. Over the previous week the market value of the iM-Standard 5ETF Trader (excludes leveraged ETFs) gained 0.44% at a time when SPY gained 0.31%. A starting capital of $100,000 at inception on 10/30/2016 would have grown to $131,500 which includes $2,986 cash and excludes $880 spent on fees and slippage. |


Leave a Reply
You must be logged in to post a comment.