
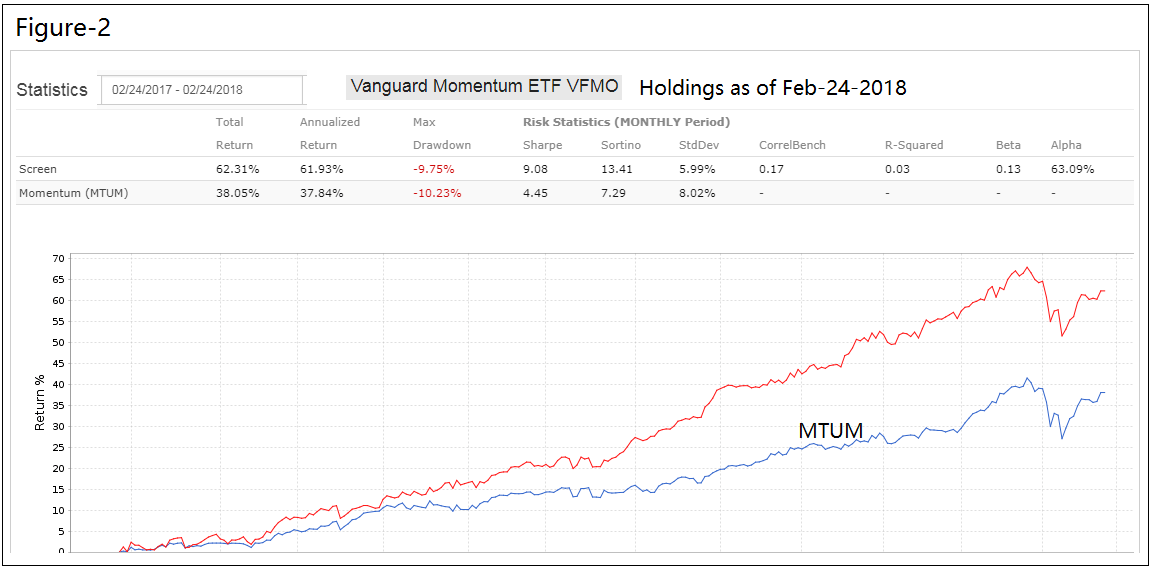
- As of Feb-24-2018 VFMO holds 637 Russell 3000 stocks, selected according to a rules-based screen for relatively strong recent performance and liquidity. They show a 1-year average return of 62%.
- Using similar screening criteria we selected a portfolio of 639 stocks on Feb-24-2018 which had a 1-year average return of 71%. It holds 501 stocks in common with VFMO.
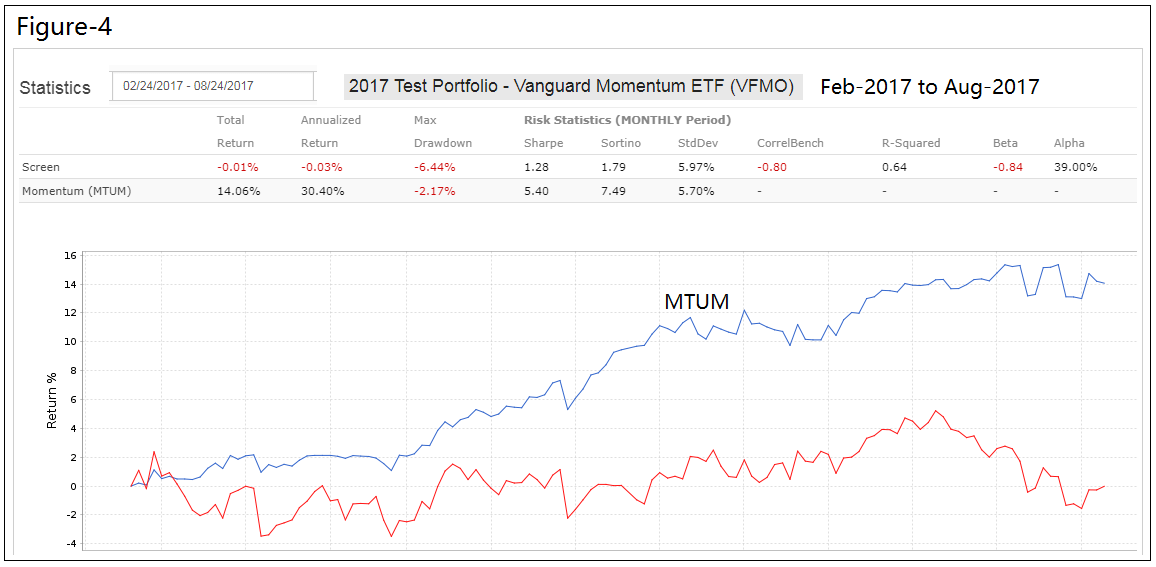
- Similar screening rules selected 576 stocks on Feb-24-2017 which showed an average return of 105% over the preceding year, but 0% return over the following 6 months to Aug-24-2018.
- Vanguard’s easily replicated selection process appears to be greatly influenced by survivorship bias. It is unlikely that VFMO will show a higher return than MTUM or SPY in the future.
Vanguard recently released a set of five actively managed secter ETF’s and one multi-facter ETF. Here we examine the Momentum Facter ETF (VFMO) and estimate its future performance.
Vanguard’s investment strategy
The investment strategy described in VFMO’s prospectus is to target primarily U.S. stocks
… with strong recent performance as determined by the advisor.
According to Vanguard:
Each new facter-based product must adhere to an enduring, logical rationale backed by empirical evidence …
However, there is no evidence presented that stocks with strong recent performance will earn a higher return going forward than those with a weaker recent performance.
Our 2018 test portfolio
On Feb-24-2018 we selected a portfolio of stocks from the Russell 3000 using similar criteria as Vanguard. Using Portfolio123, we designed a universe, which after applying a liquidity and 1-year return filter held 639 stocks. Together those 639 stocks had an average return of 71% over the preceding year (Figure-1), not much different from the 637 stocks of the current holding of VFMO which had an average return of 62% over the same period (Figure-2).
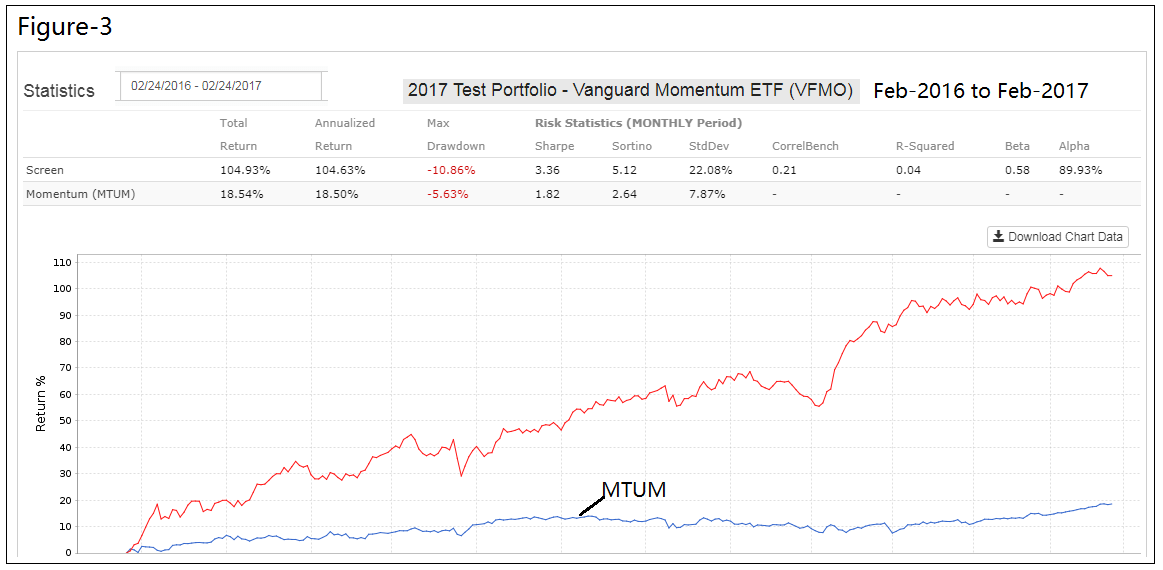
In Figures 1, 2, 3, and 4 the red graph depicts the performance of the universes’ holdings, and the blue graph the performance of benchmark iShares Momentum ETF (MTUM).
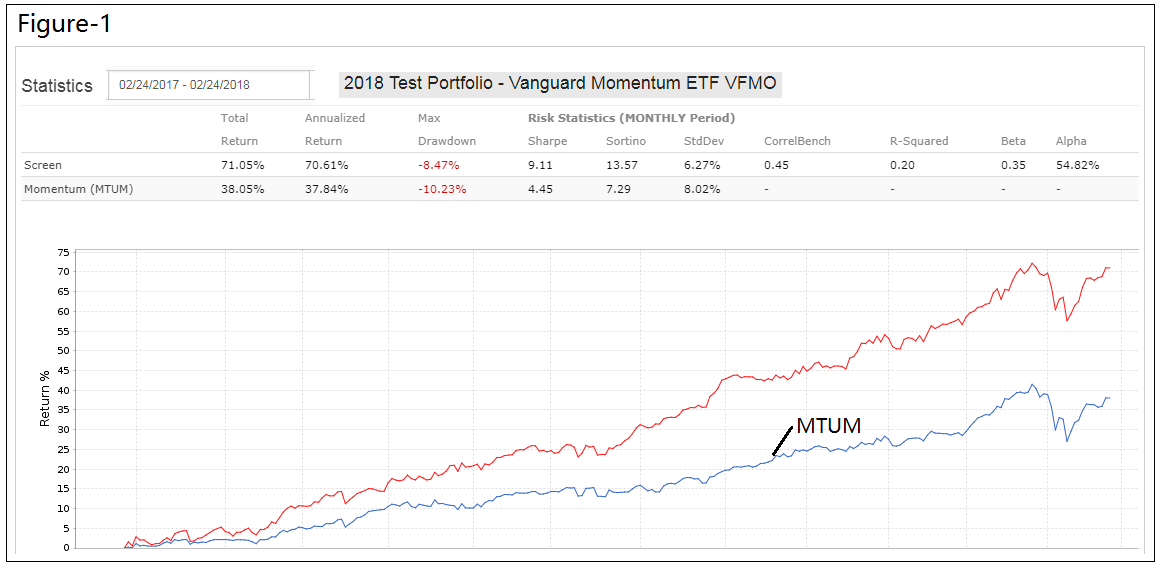
Also our portfolio exhibited an overlap of 79% with VFMO’s holdings, i.e. 501 stocks from our universe were also represented in the holdings of VFMO. One can therefore reasonably conclude that our stock selection process does not differ much from that of Vanguard’s advisors and can be used to simulate past performance of VFMO.
Our 2017 test portfolio
We tested our simulation of Vanguard’s strategy by repeating the stock selection process for a universe dated Feb-24-2017 and found a portfolio of 576 stocks which showed strong recent performance with an average return of 105% over the preceding year (Figure-3).
Our 2014 test portfolio
We again tested our simulation of Vanguard’s strategy by repeating the stock selection process for a universe dated Jul-1-2014 and found a portfolio of 652 stocks which showed strong recent performance with an average return of 77% over the preceding year. For the following 6 month to 12/31/2014 the 2014 portfolio showed a loss of -3.0%, MTUM returned 7.3%, and SPY returned 5.4%.
Conclusion
Vanguards selection strategy targeting stocks with strong recent performance and expecting that they will perform better than stocks with weak recent performance is tainted by survivorship bias.
Past performance does not guarantee future performance, and no stock can go up forever. Our analysis shows that the strongest among the recent winners may be the ones most vulnerable, and does not support Vanguard’s unsubstantiated claim that stocks with strong recent performance have tended to earn a higher return than those with weak recent performance.
It will be interesting to monitor the performance of VFMO over the next year, our expectation is that it will under-perform SPY and MTUM.
i’m interested in your opinion on VFMF, the multifactor one.