  |
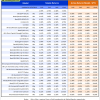
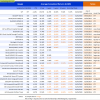
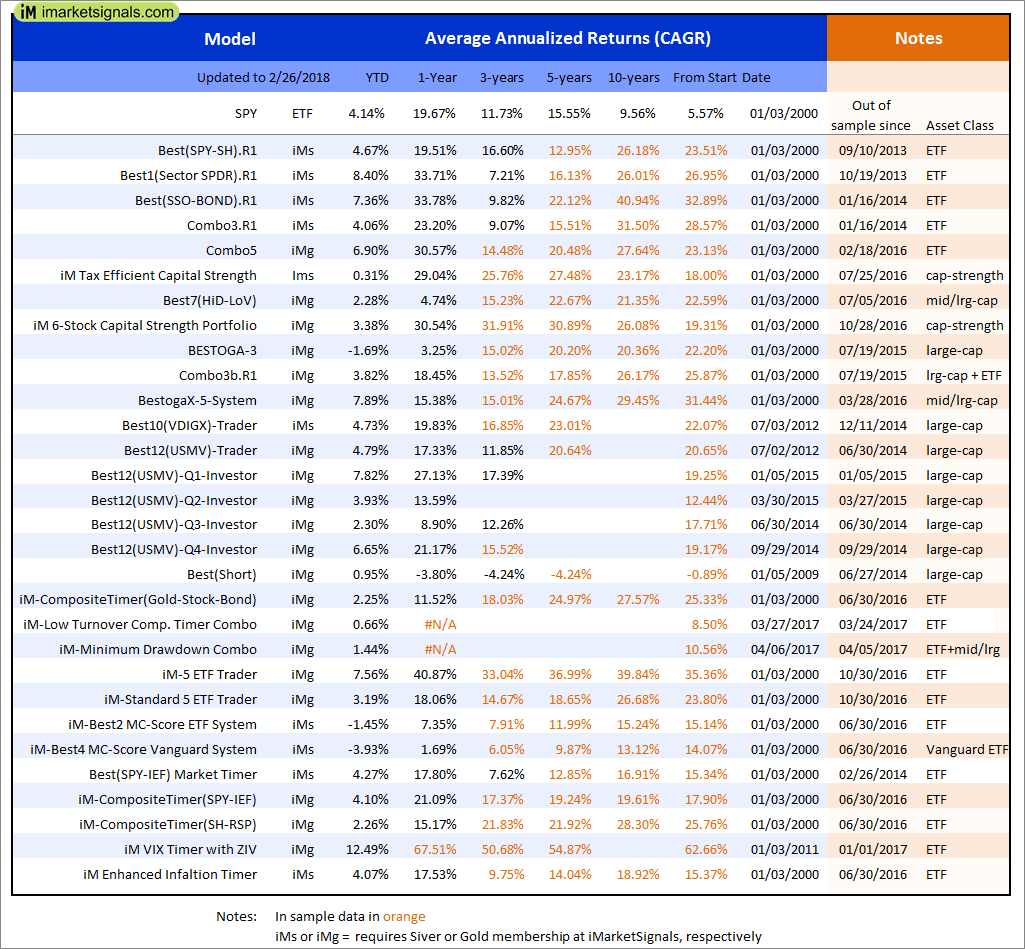
Out of sample performance summary of our models for the past 1, 2, 4 and 13 week periods. The active active return indicates how the models over- or underperformed the benchmark ETF SPY. Also the YTD, and the 1-, 3-, 5- and 10-year annualized returns are shown in the second table |
|
|
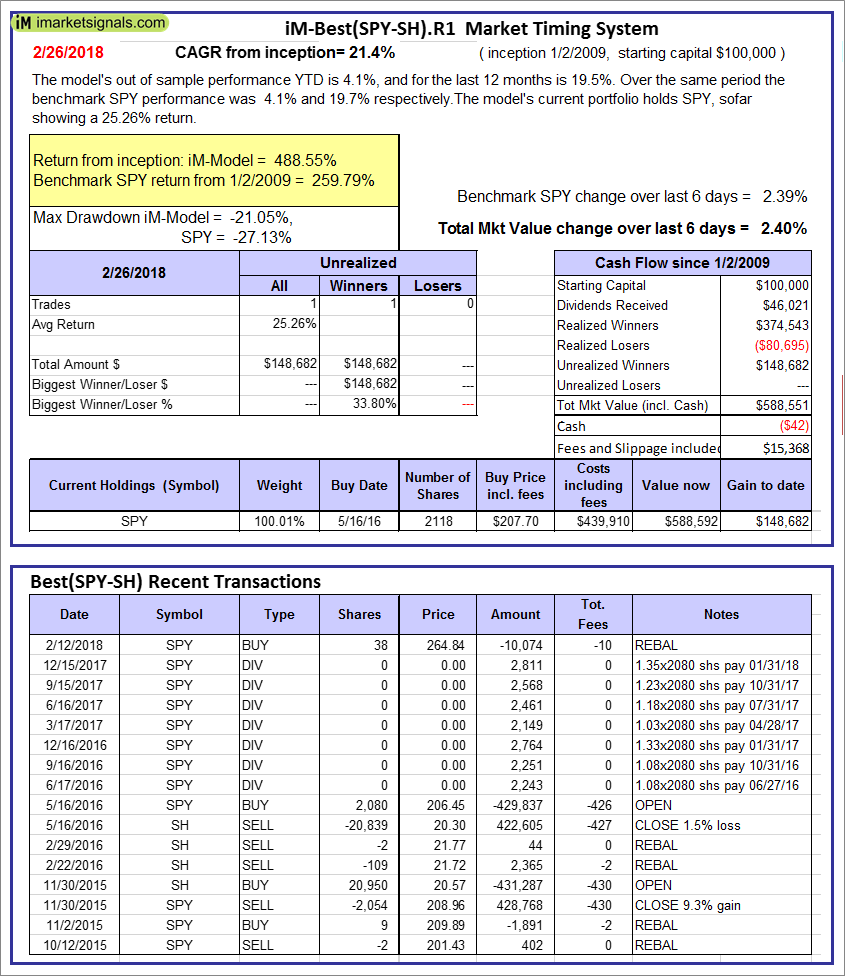
iM-Best(SPY-SH).R1: The model’s out of sample performance YTD is 4.1%, and for the last 12 months is 19.5%. Over the same period the benchmark SPY performance was 4.1% and 19.7% respectively. Over the previous week the market value of Best(SPY-SH) gained 2.40% at a time when SPY gained 2.39%. A starting capital of $100,000 at inception on 1/2/2009 would have grown to $588,551 which includes -$42 cash and excludes $15,368 spent on fees and slippage. |
|
|
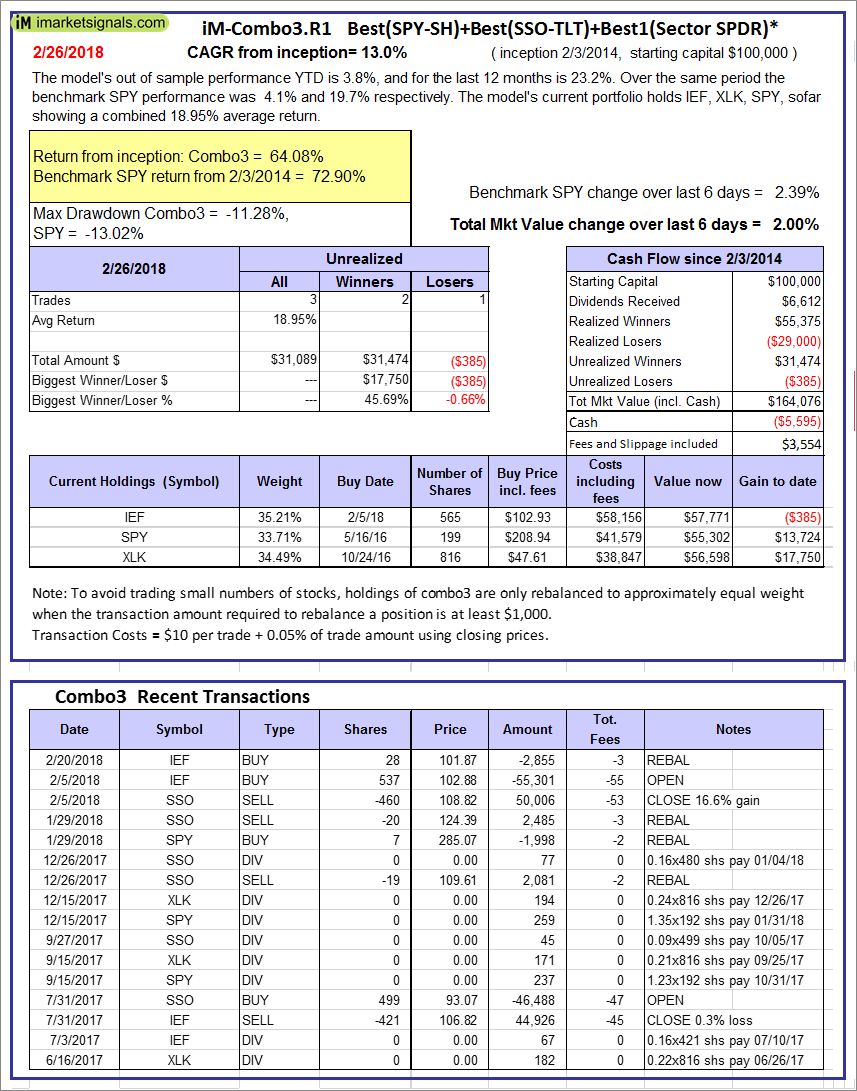
iM-Combo3.R1: The model’s out of sample performance YTD is 3.8%, and for the last 12 months is 23.2%. Over the same period the benchmark SPY performance was 4.1% and 19.7% respectively. Over the previous week the market value of iM-Combo3.R1 gained 2.00% at a time when SPY gained 2.39%. A starting capital of $100,000 at inception on 2/3/2014 would have grown to $164,076 which includes -$5,595 cash and excludes $3,554 spent on fees and slippage. |
|
|
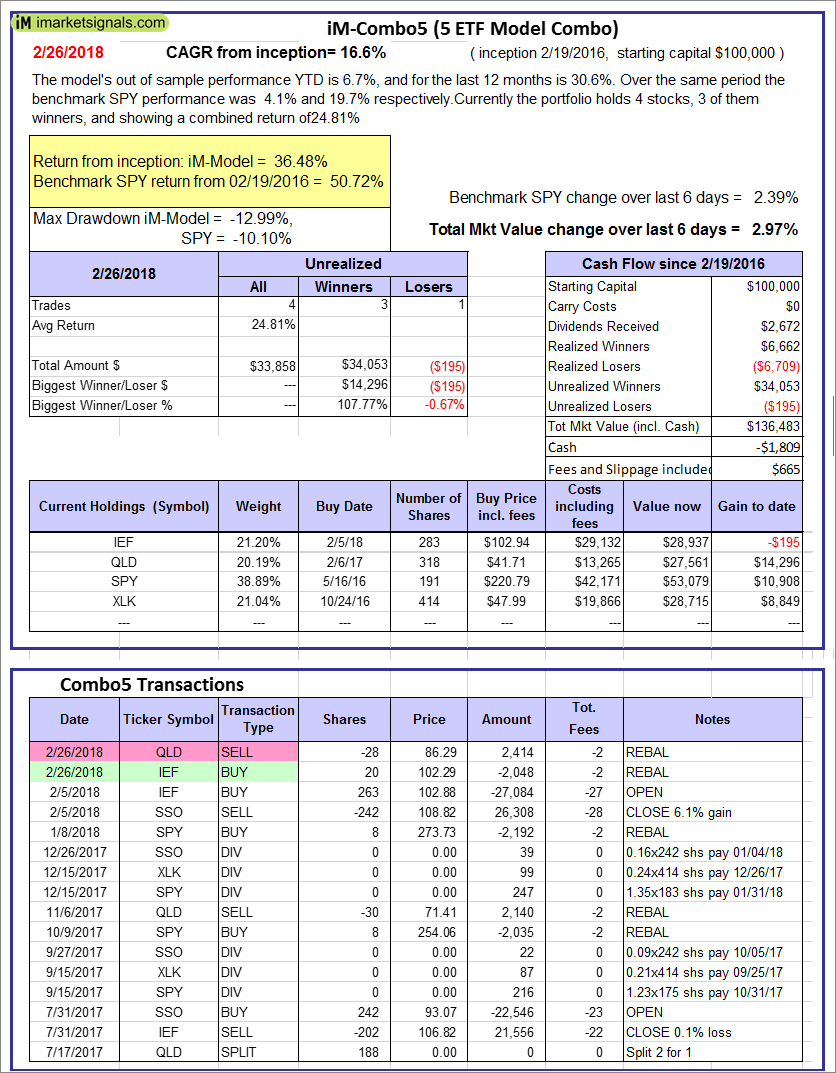
iM-Combo5: The model’s out of sample performance YTD is 6.7%, and for the last 12 months is 30.6%. Over the same period the benchmark SPY performance was 4.1% and 19.7% respectively. Over the previous week the market value of iM-Combo5 gained 2.97% at a time when SPY gained 2.39%. A starting capital of $100,000 at inception on 2/22/2016 would have grown to $136,483 which includes -$1,809 cash and excludes $665 spent on fees and slippage. |
|
|
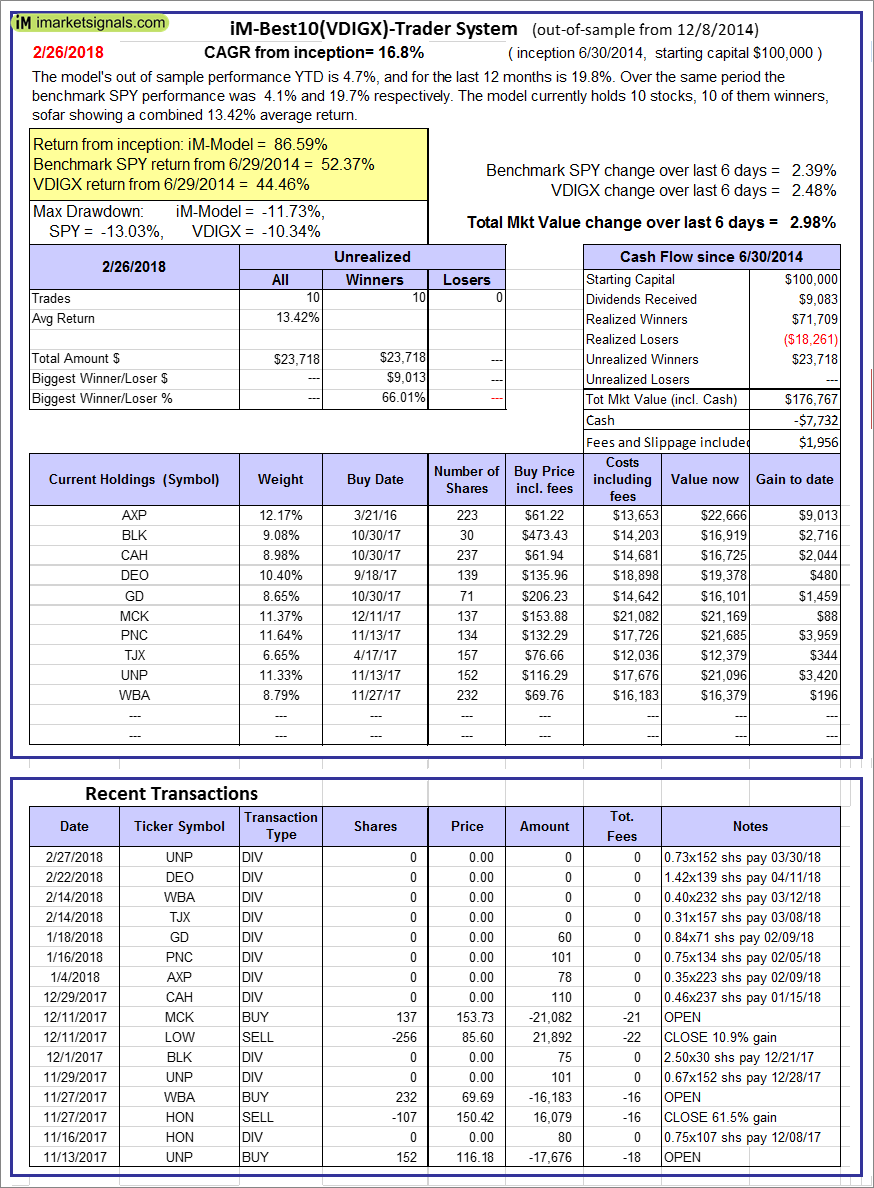
iM-Best10(VDIGX)-Trader: The model’s out of sample performance YTD is 4.7%, and for the last 12 months is 19.8%. Over the same period the benchmark SPY performance was 4.1% and 19.7% respectively. Since inception, on 7/1/2014, the model gained 86.59% while the benchmark SPY gained 52.37% and VDIGX gained 44.46% over the same period. Over the previous week the market value of iM-Best10(VDIGX) gained 2.98% at a time when SPY gained 2.39%. A starting capital of $100,000 at inception on 7/1/2014 would have grown to $176,767 which includes -$7,732 cash and excludes $1,956 spent on fees and slippage. |
|
|
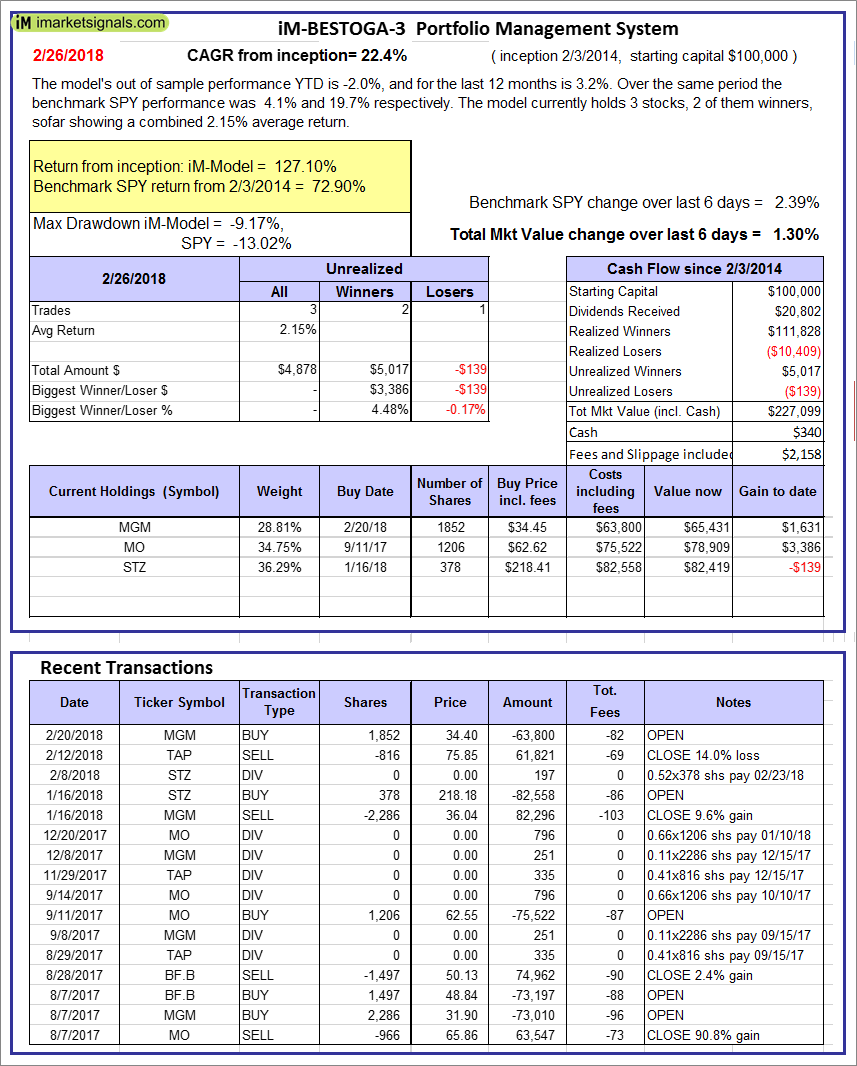
iM-BESTOGA-3: The model’s out of sample performance YTD is -2.0%, and for the last 12 months is 3.2%. Over the same period the benchmark SPY performance was 4.1% and 19.7% respectively. Over the previous week the market value of iM-BESTOGA-3 gained 1.30% at a time when SPY gained 2.39%. A starting capital of $100,000 at inception on 2/3/2014 would have grown to $227,099 which includes $340 cash and excludes $2,158 spent on fees and slippage. |
|
|
iM-Best7(HiD-LoV): The model’s out of sample performance YTD is 1.5%, and for the last 12 months is 4.7%. Over the same period the benchmark SPY performance was 4.1% and 19.7% respectively. Over the previous week the market value of iM-BESTOGA-3 gained -0.36% at a time when SPY gained 2.39%. A starting capital of $100,000 at inception on 6/30/2016 would have grown to $115,065 which includes $153 cash and excludes $1,627 spent on fees and slippage. |
|
|
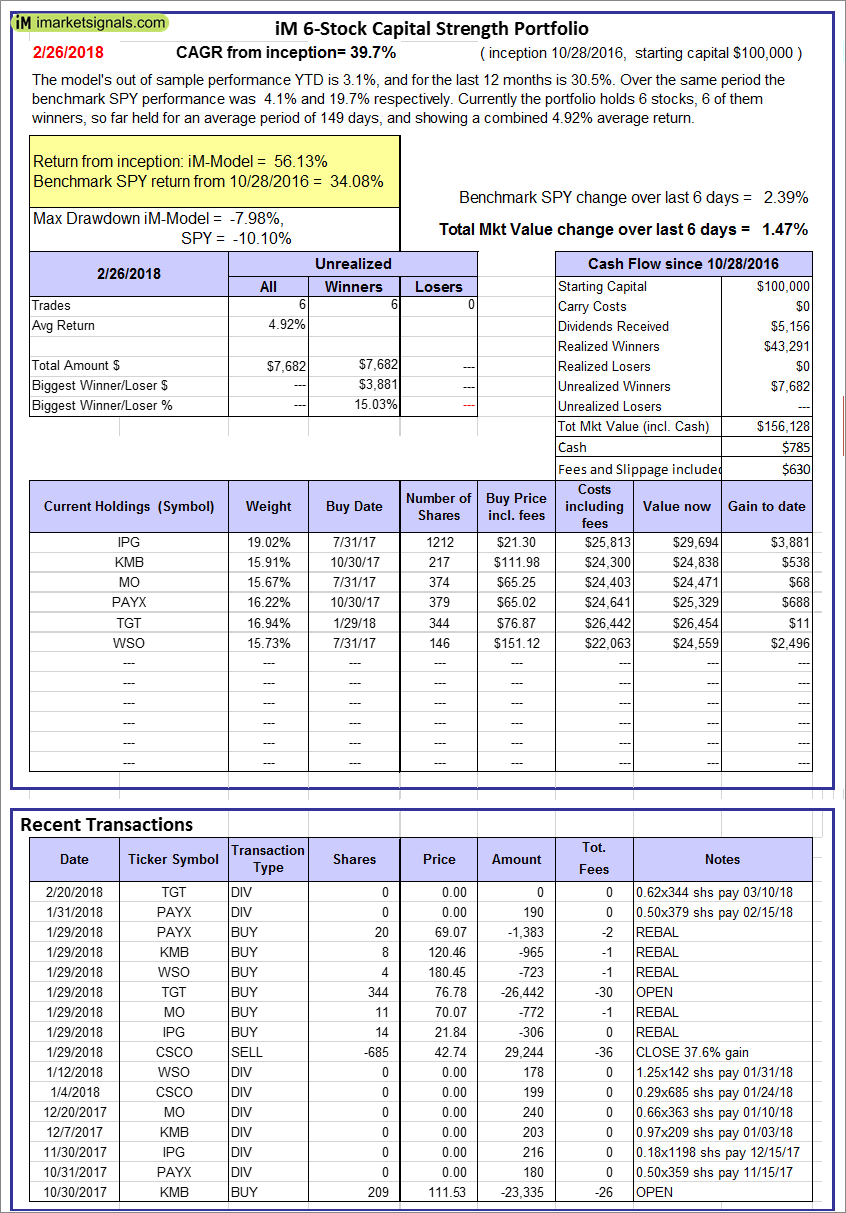
iM 6-Stock Capital Strength Portfolio: The model’s out of sample performance YTD is 3.1%, and for the last 12 months is 30.5%. Over the same period the benchmark SPY performance was 4.1% and 19.7% respectively. Over the previous week the market value of the iM 6-Stock Capital Strength Portfolio gained 1.47% at a time when SPY gained 2.39%. A starting capital of $100,000 at inception on 10/28/2016 would have grown to $156,128 which includes $785 cash and excludes $630 spent on fees and slippage. |
|
|
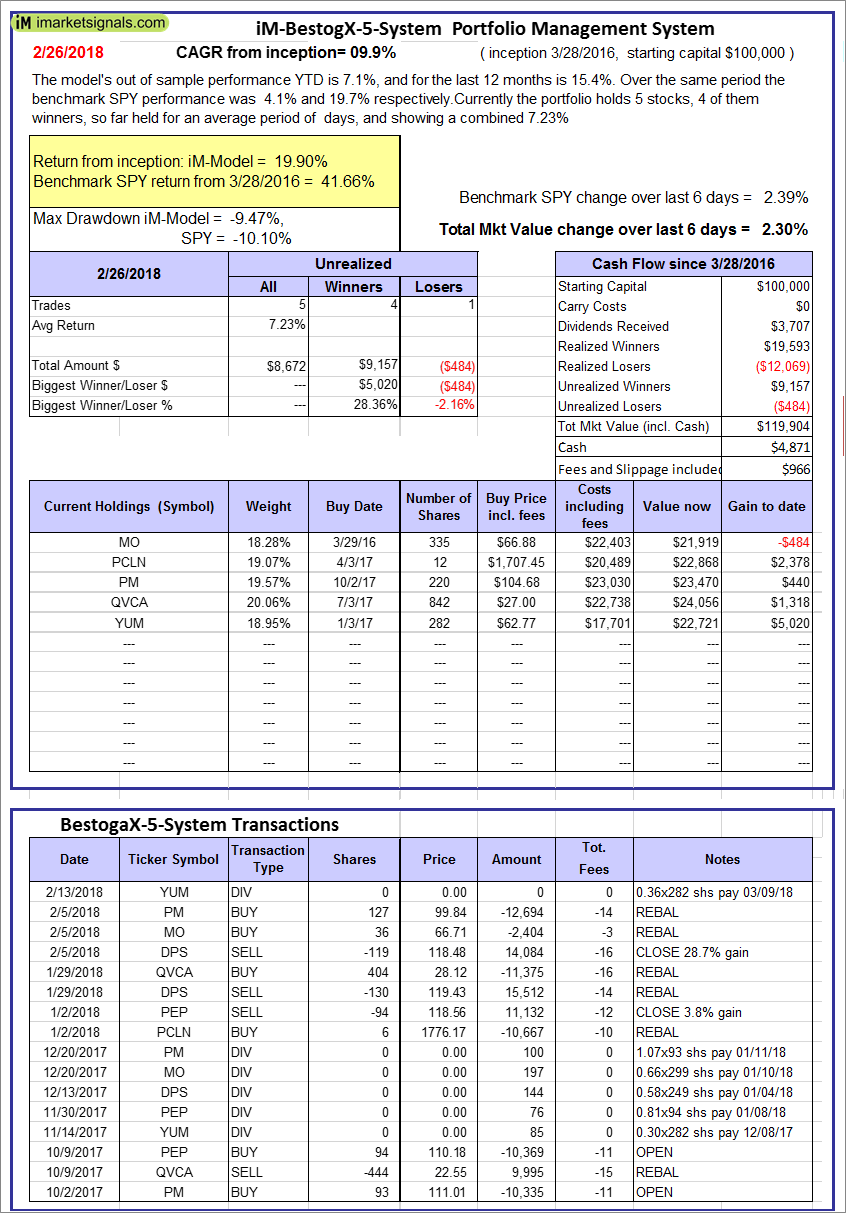
iM-BestogaX5-System: The model’s out of sample performance YTD is 7.1%, and for the last 12 months is 15.4%. Over the same period the benchmark SPY performance was 4.1% and 19.7% respectively. Over the previous week the market value of iM-BestogaX5-System gained 2.30% at a time when SPY gained 2.39%. A starting capital of $100,000 at inception on 3/28/2016 would have grown to $119,904 which includes $4,871 cash and excludes $966 spent on fees and slippage. |
|
|
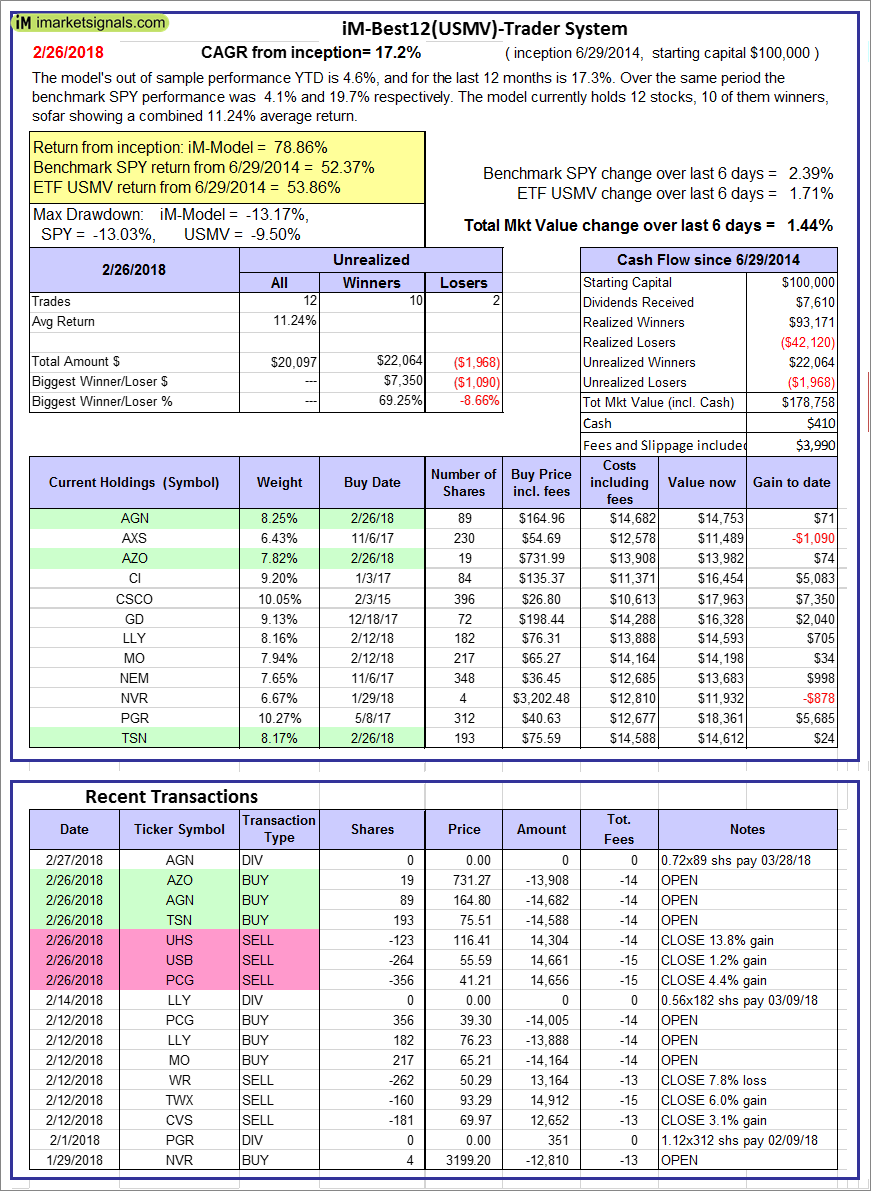
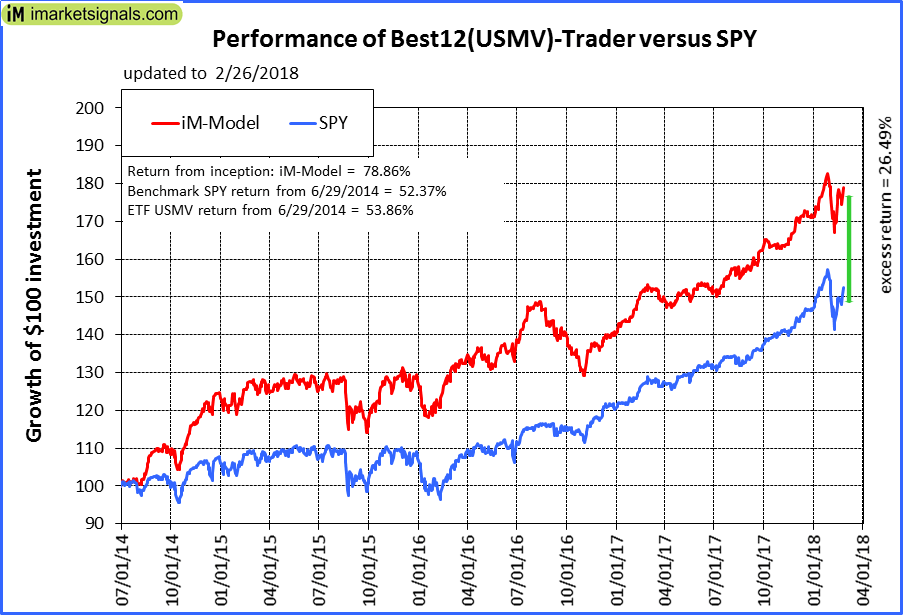
iM-Best12(USMV)-Trader: The model’s out of sample performance YTD is 4.6%, and for the last 12 months is 17.3%. Over the same period the benchmark SPY performance was 4.1% and 19.7% respectively. Since inception, on 6/30/2014, the model gained 78.86% while the benchmark SPY gained 52.37% and the ETF USMV gained 53.86% over the same period. Over the previous week the market value of iM-Best12(USMV)-Trader gained 1.44% at a time when SPY gained 2.39%. A starting capital of $100,000 at inception on 6/30/2014 would have grown to $178,758 which includes $410 cash and excludes $3,990 spent on fees and slippage. |
|
|
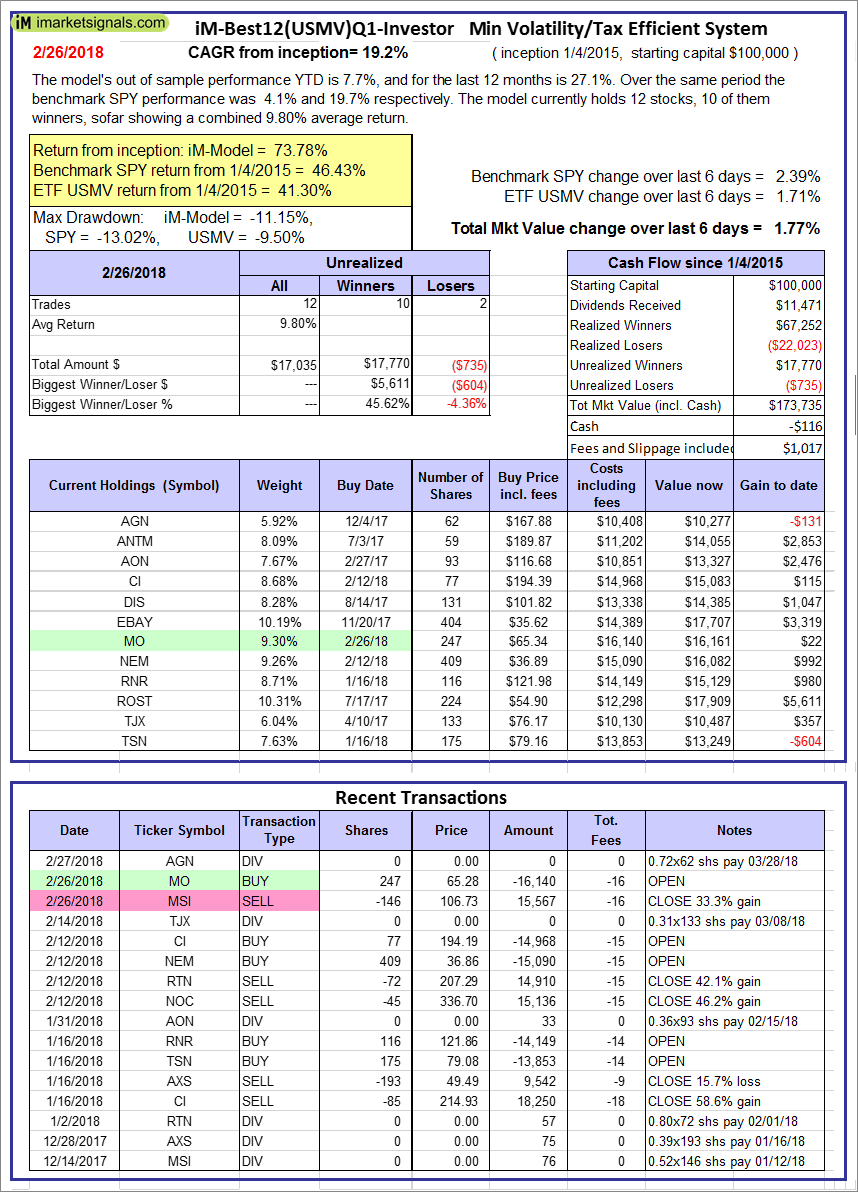
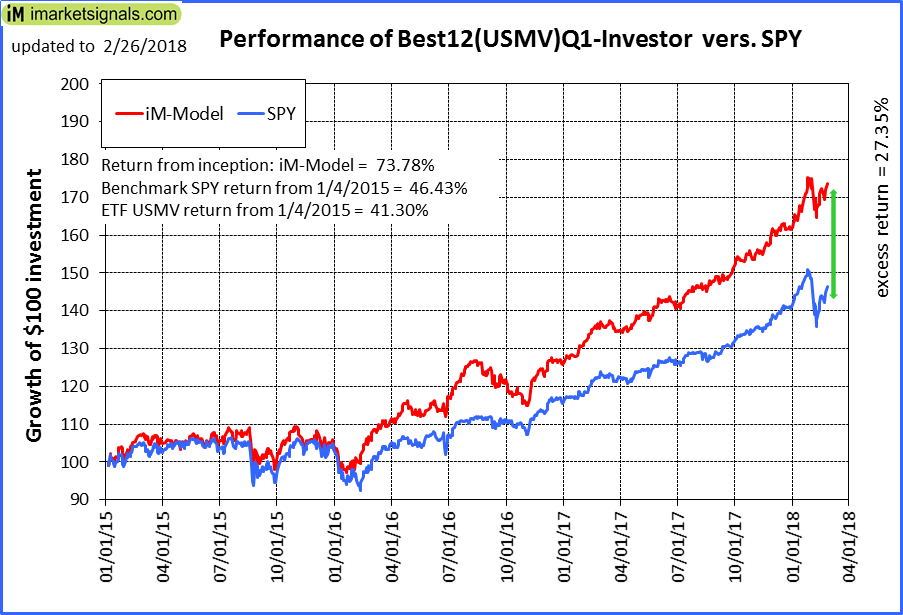
iM-Best12(USMV)Q1-Investor: The model’s out of sample performance YTD is 7.7%, and for the last 12 months is 27.1%. Over the same period the benchmark SPY performance was 4.1% and 19.7% respectively. Since inception, on 1/5/2015, the model gained 73.78% while the benchmark SPY gained 46.43% and the ETF USMV gained 41.30% over the same period. Over the previous week the market value of iM-Best12(USMV)Q1 gained 1.77% at a time when SPY gained 2.39%. A starting capital of $100,000 at inception on 1/5/2015 would have grown to $173,735 which includes -$116 cash and excludes $1,017 spent on fees and slippage. |
|
|
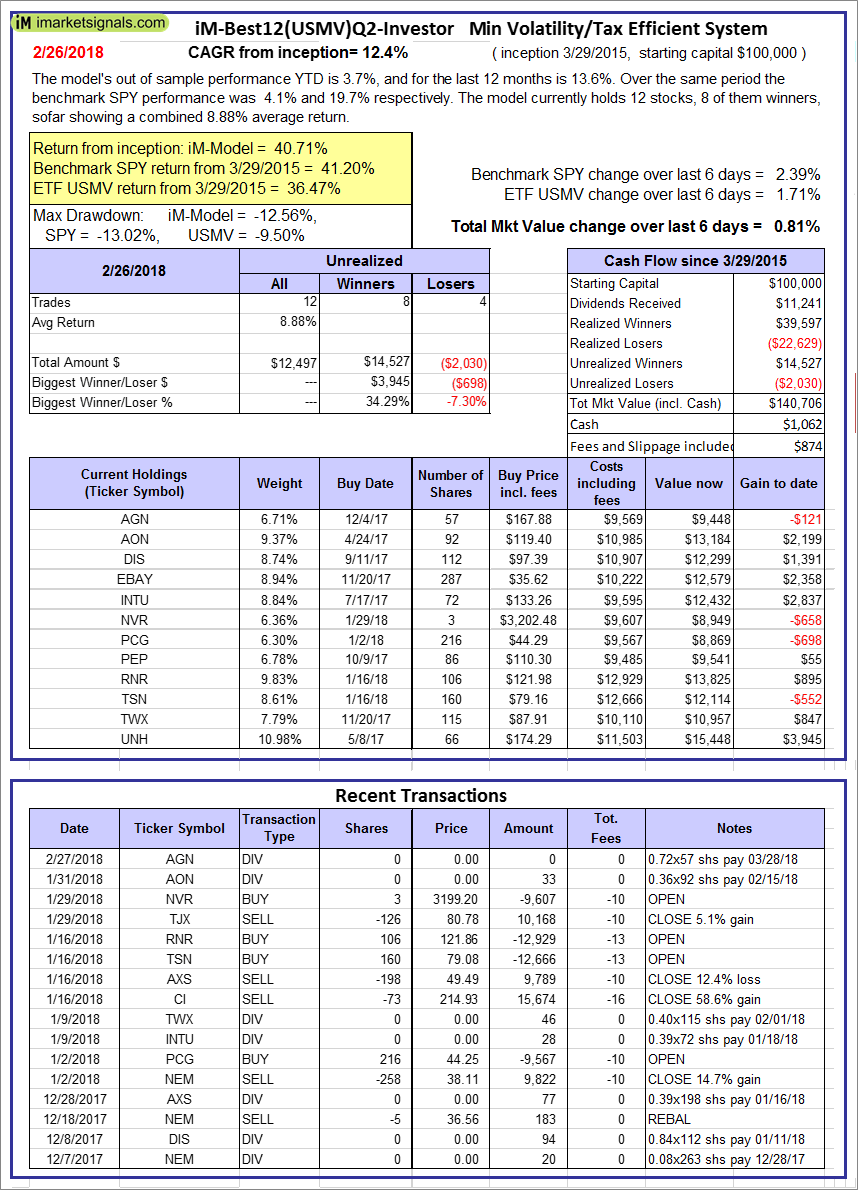
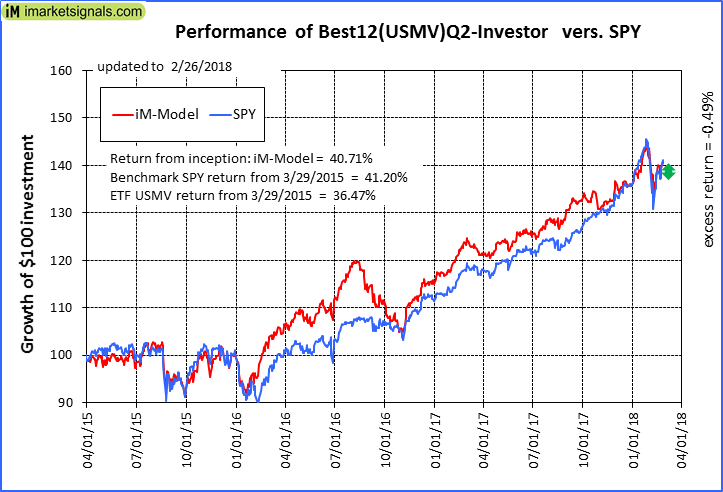
iM-Best12(USMV)Q2-Investor: The model’s out of sample performance YTD is 3.7%, and for the last 12 months is 13.6%. Over the same period the benchmark SPY performance was 4.1% and 19.7% respectively. Since inception, on 3/30/2015, the model gained 40.71% while the benchmark SPY gained 41.20% and the ETF USMV gained 36.47% over the same period. Over the previous week the market value of iM-Best12(USMV)Q2 gained 0.81% at a time when SPY gained 2.39%. A starting capital of $100,000 at inception on 3/30/2015 would have grown to $140,706 which includes $1,062 cash and excludes $874 spent on fees and slippage. |
|
|
iM-Best12(USMV)Q3-Investor: The model’s out of sample performance YTD is 2.2%, and for the last 12 months is 8.9%. Over the same period the benchmark SPY performance was 4.1% and 19.7% respectively. Since inception, on 7/1/2014, the model gained 81.51% while the benchmark SPY gained 52.37% and the ETF USMV gained 53.86% over the same period. Over the previous week the market value of iM-Best12(USMV)Q3 gained 1.18% at a time when SPY gained 2.39%. A starting capital of $100,000 at inception on 7/1/2014 would have grown to $181,377 which includes $691 cash and excludes $1,359 spent on fees and slippage. |
|
|
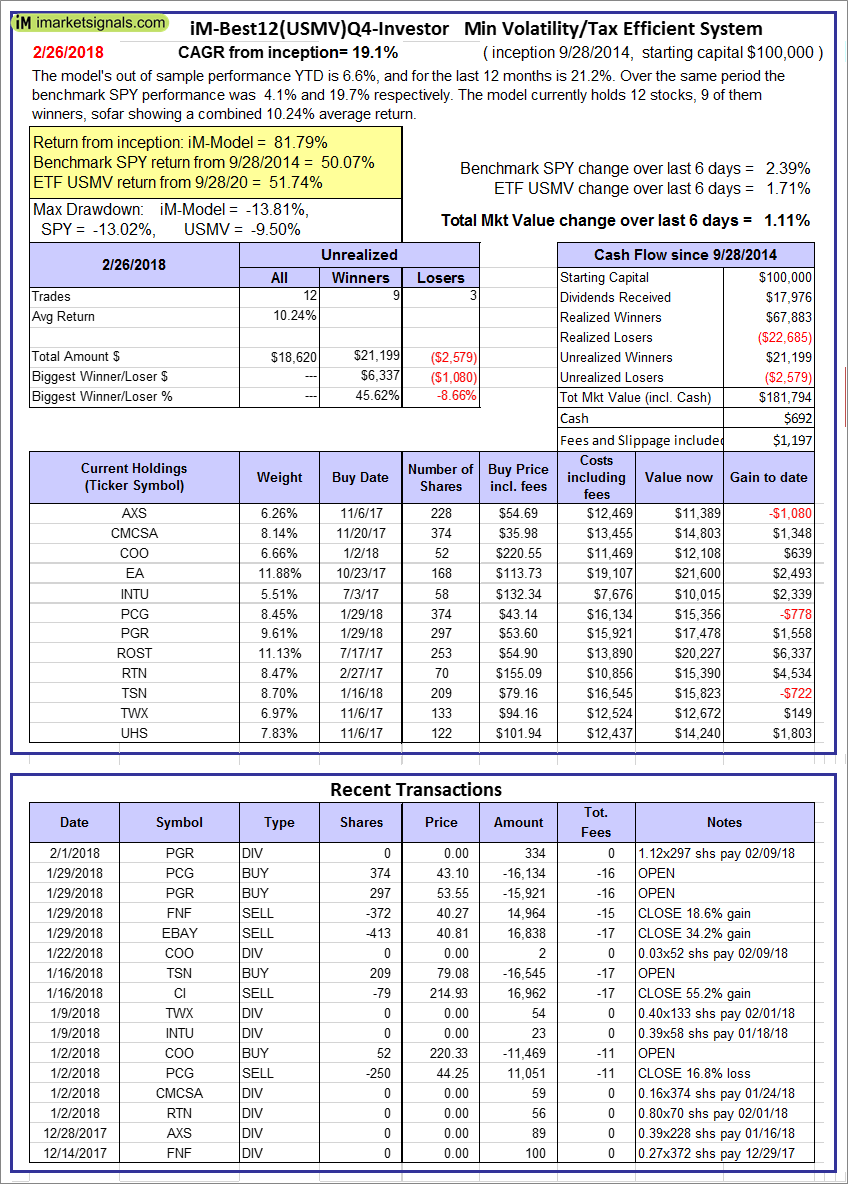
iM-Best12(USMV)Q4-Investor: Since inception, on 9/29/2014, the model gained 81.79% while the benchmark SPY gained 50.07% and the ETF USMV gained 51.74% over the same period. Over the previous week the market value of iM-Best12(USMV)Q4 gained 1.11% at a time when SPY gained 2.39%. A starting capital of $100,000 at inception on 9/29/2014 would have grown to $181,794 which includes $692 cash and excludes $1,197 spent on fees and slippage. |
|
|
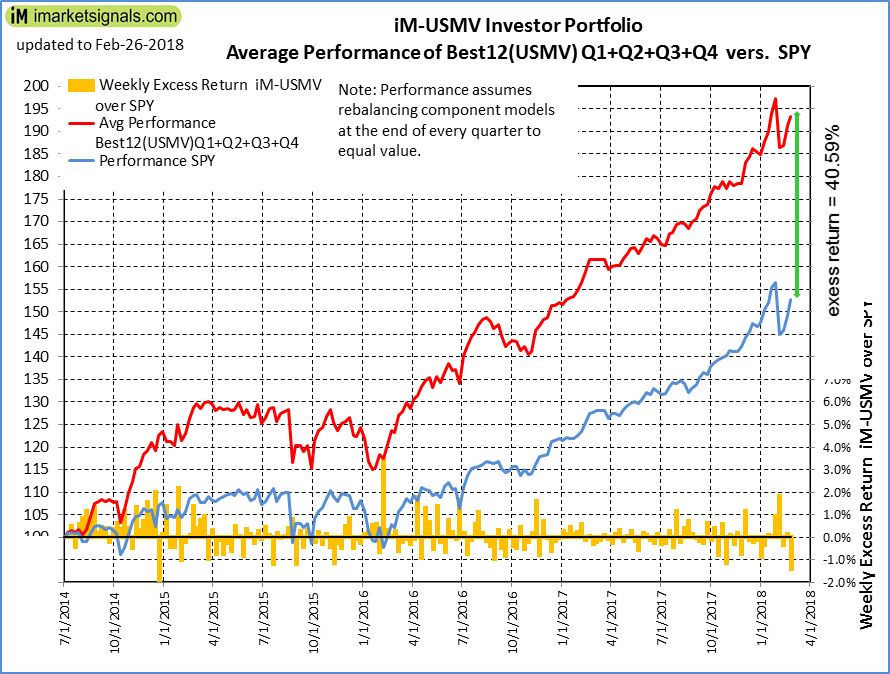
Average Performance of iM-Best12(USMV)Q1+Q2+Q3+Q4-Investor resulted in an excess return of 40.59% over SPY. (see iM-USMV Investor Portfolio) |
|
|
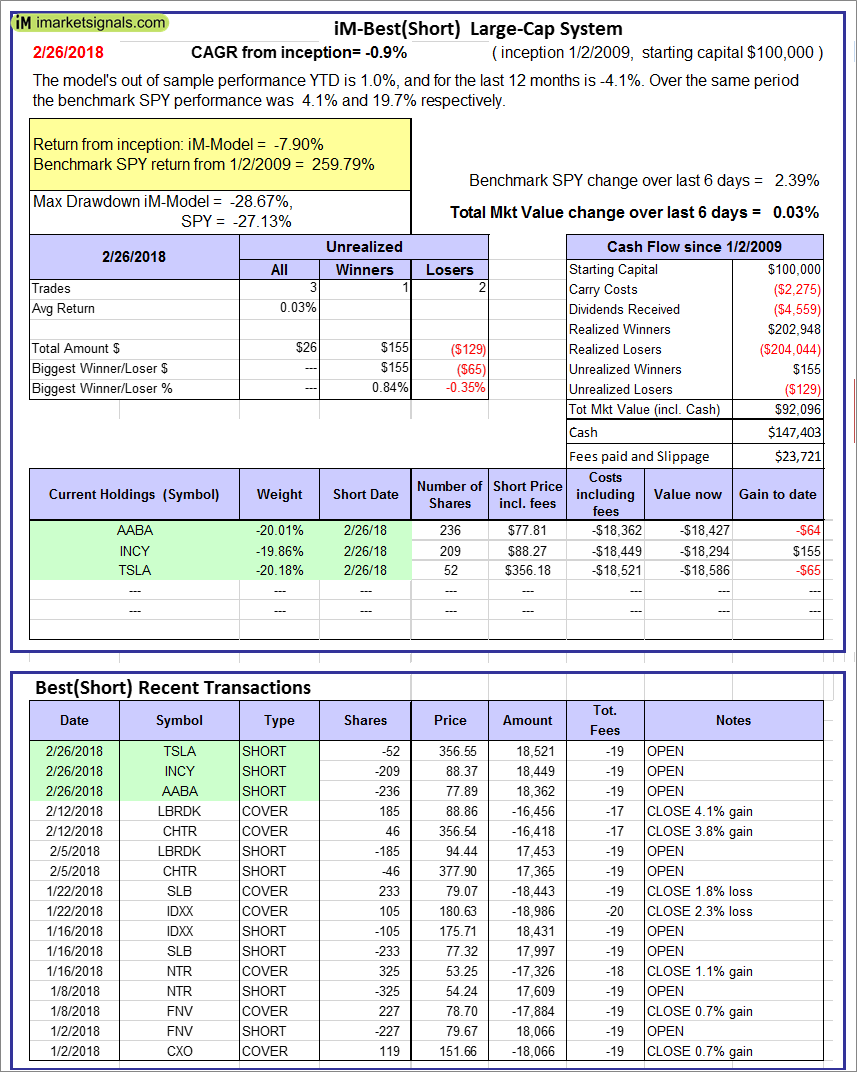
iM-Best(Short): The model’s out of sample performance YTD is 1.0%, and for the last 12 months is -4.1%. Over the same period the benchmark SPY performance was 4.1% and 19.7% respectively. Over the previous week the market value of iM-Best(Short) gained 0.03% at a time when SPY gained 2.39%. Over the period 1/2/2009 to 2/26/2018 the starting capital of $100,000 would have grown to $92,096 which includes $147,403 cash and excludes $23,721 spent on fees and slippage. |
|
|
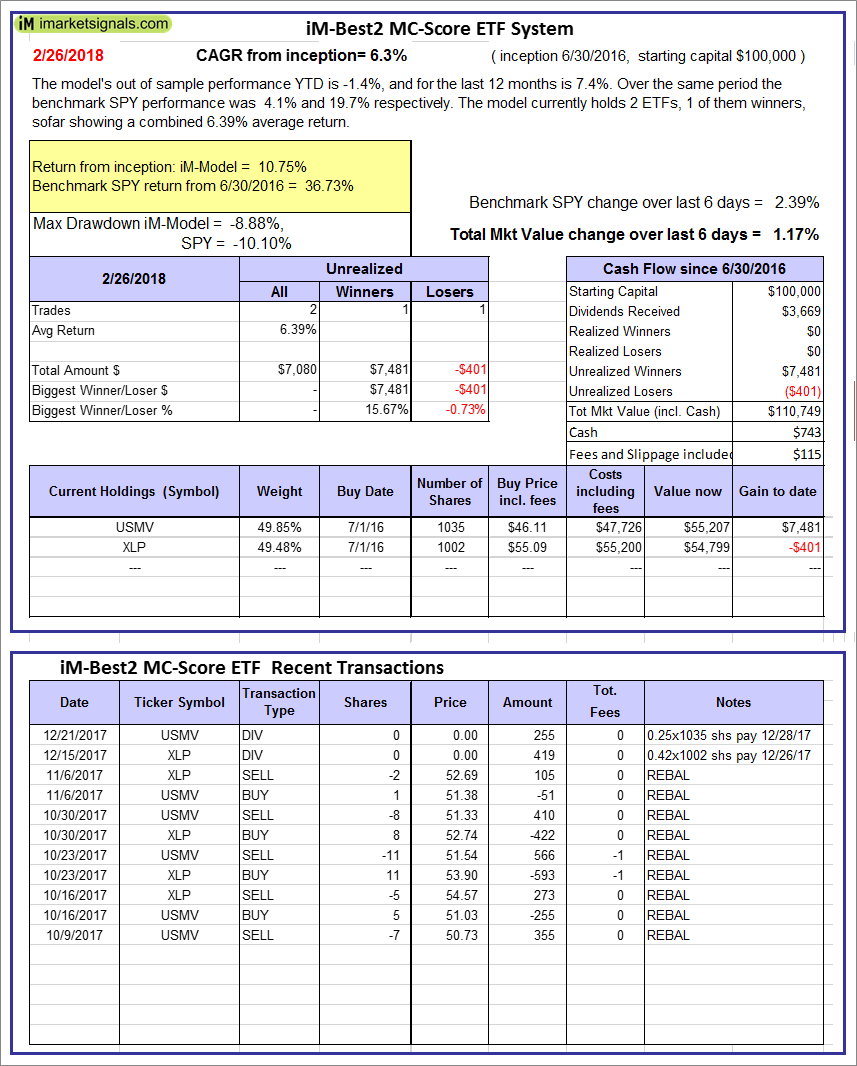
iM-Best2 MC-Score ETF System: The model’s out of sample performance YTD is -1.4%, and for the last 12 months is 7.4%. Over the same period the benchmark SPY performance was 4.1% and 19.7% respectively. Over the previous week the market value of the iM-Best2 MC-Score ETF System gained 1.17% at a time when SPY gained 2.39%. A starting capital of $100,000 at inception on 6/30/2016 would have grown to $110,749 which includes $743 cash and excludes $115 spent on fees and slippage. |
|
|
iM-Best4 MC-Score Vanguard System: The model’s out of sample performance YTD is -3.9%, and for the last 12 months is 1.7%. Over the same period the benchmark SPY performance was 4.1% and 19.7% respectively. Over the previous week the market value of the iM-Best4 MC-Score Vanguard System gained 1.03% at a time when SPY gained 2.39%. A starting capital of $100,000 at inception on 6/30/2016 would have grown to $106,500 which includes $3,320 cash and excludes $00 spent on fees and slippage. |
|
|
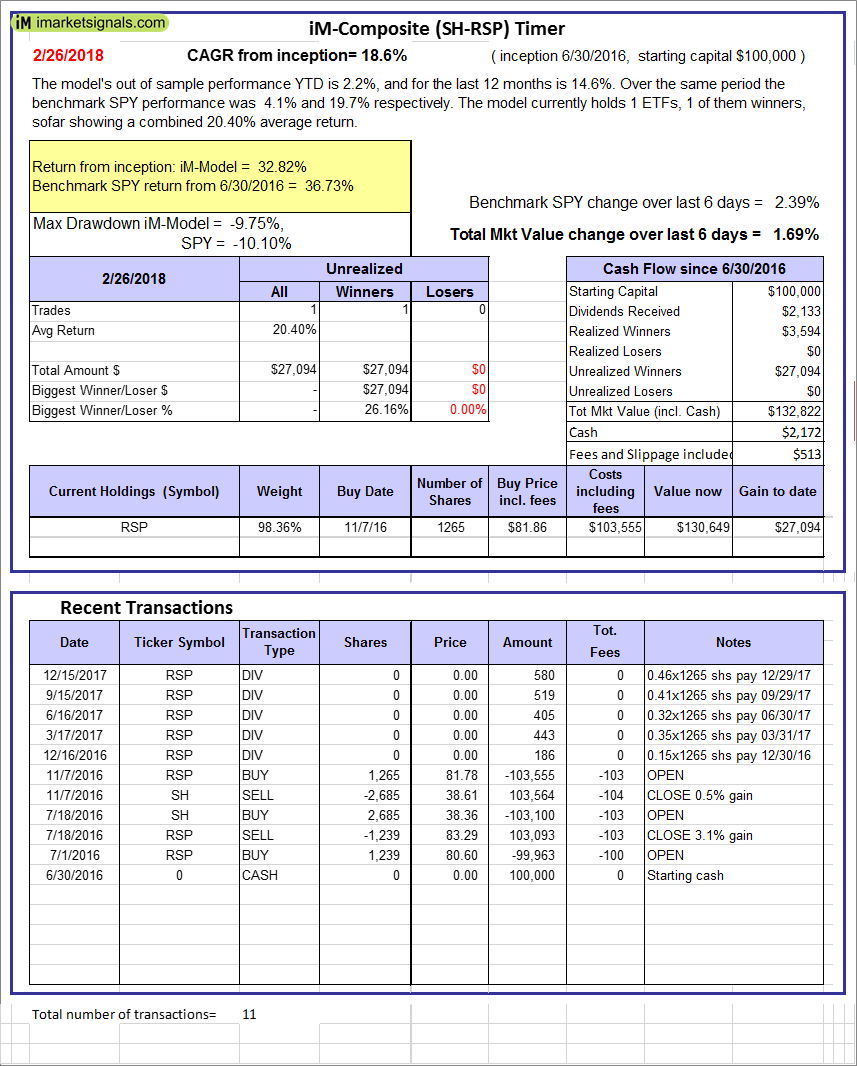
iM-Composite (SH-RSP) Timer: The model’s out of sample performance YTD is 2.2%, and for the last 12 months is 14.6%. Over the same period the benchmark SPY performance was 4.1% and 19.7% respectively. Over the previous week the market value of the iM-Composite (SH-RSP) Timer gained 1.69% at a time when SPY gained 2.39%. A starting capital of $100,000 at inception on 6/30/2016 would have grown to $132,822 which includes $2,172 cash and excludes $513 spent on fees and slippage. |
|
|
iM-Composite (SPY-IEF) Timer: The model’s out of sample performance YTD is 4.1%, and for the last 12 months is 21.0%. Over the same period the benchmark SPY performance was 4.1% and 19.7% respectively. Over the previous week the market value of the iM-Composite (SPY-IEF) Timer gained 2.37% at a time when SPY gained 2.39%. A starting capital of $100,000 at inception on 6/30/2016 would have grown to $138,783 which includes $1,500 cash and excludes $1,390 spent on fees and slippage. |
|
|
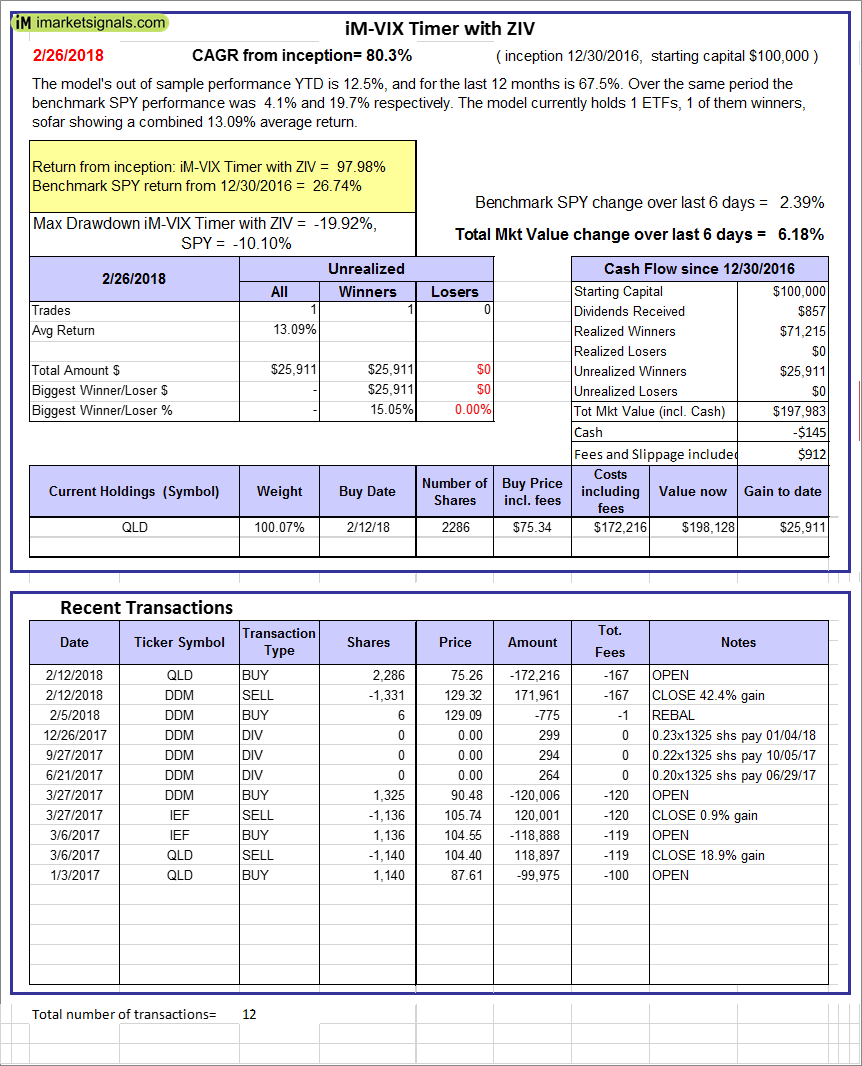
iM-VIX Timer with ZIV: The model’s out of sample performance YTD is 12.5%, and for the last 12 months is 67.5%. Over the same period the benchmark SPY performance was 4.1% and 19.7% respectively. Over the previous week the market value of the iM-VIX Timer with ZIV gained 6.18% at a time when SPY gained 2.39%. A starting capital of $100,000 at inception on 6/30/2016 would have grown to $197,983 which includes -$145 cash and excludes $912 spent on fees and slippage. |
|
|
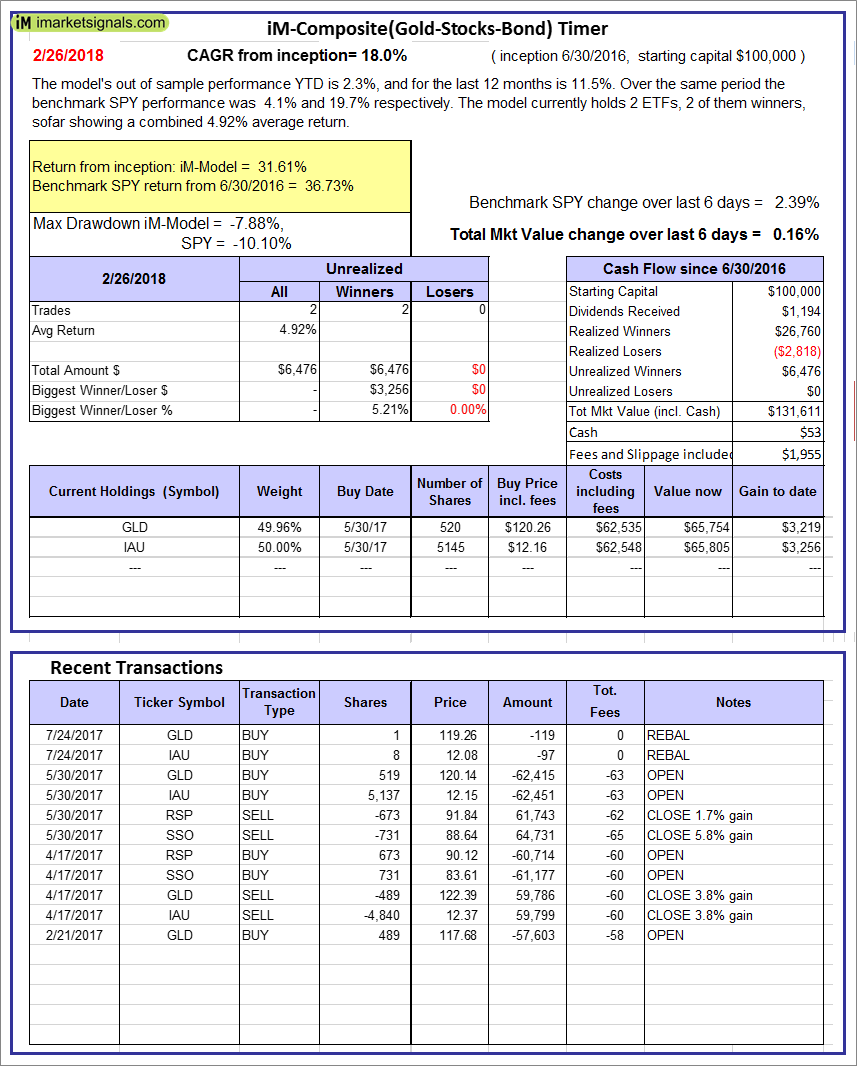
iM-Composite(Gold-Stocks-Bond) Timer: The model’s out of sample performance YTD is 2.3%, and for the last 12 months is 11.5%. Over the same period the benchmark SPY performance was 4.1% and 19.7% respectively. Over the previous week the market value of the iM-Composite(Gold-Stocks-Bond) Timer gained 0.16% at a time when SPY gained 2.39%. A starting capital of $100,000 at inception on 6/30/2016 would have grown to $131,611 which includes $53 cash and excludes $1,955 spent on fees and slippage. |
|
|
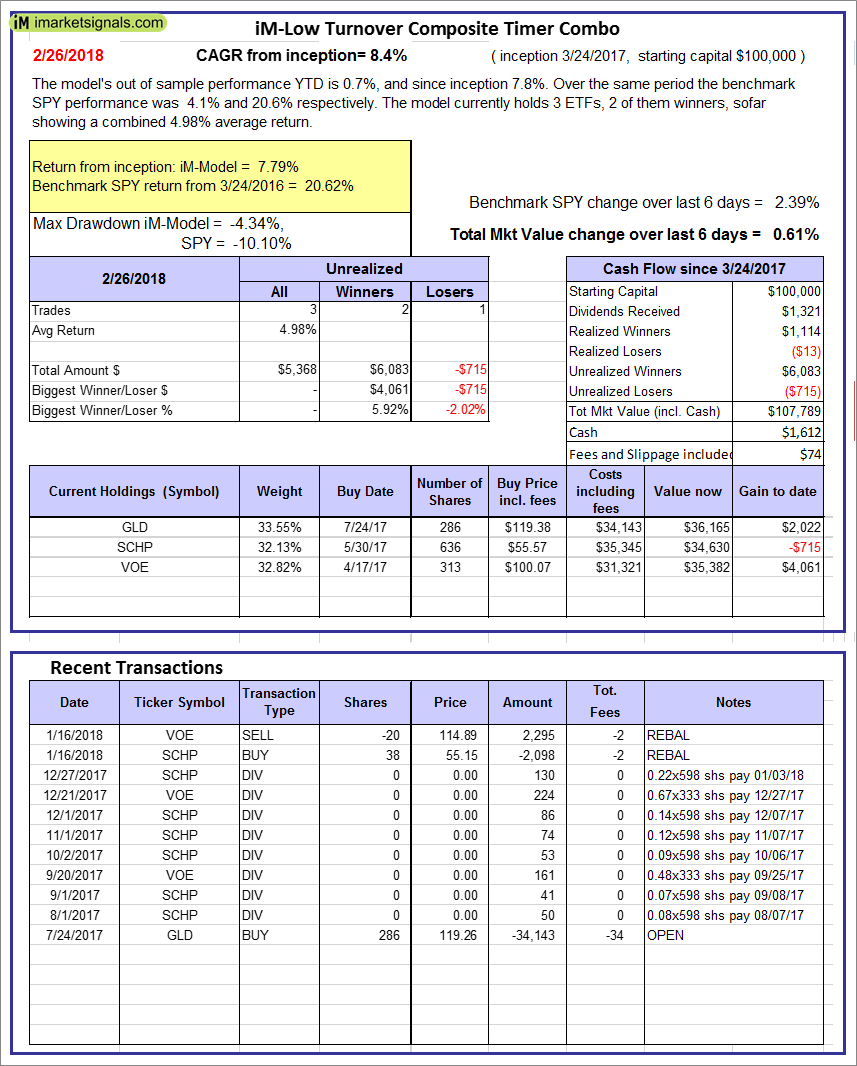
iM-Low Turnover Composite Timer Combo: The model’s out of sample performance YTD is 0.7%, and since inception 7.8%. Over the same period the benchmark SPY performance was 4.1% and 20.6% respectively. Over the previous week the market value of the iM-Low Turnover Composite Timer Combo gained 0.61% at a time when SPY gained 2.39%. A starting capital of $100,000 at inception on 3/24/27 would have grown to $107,789 which includes $1,612 cash and excludes $74 spent on fees and slippage. |
|
|
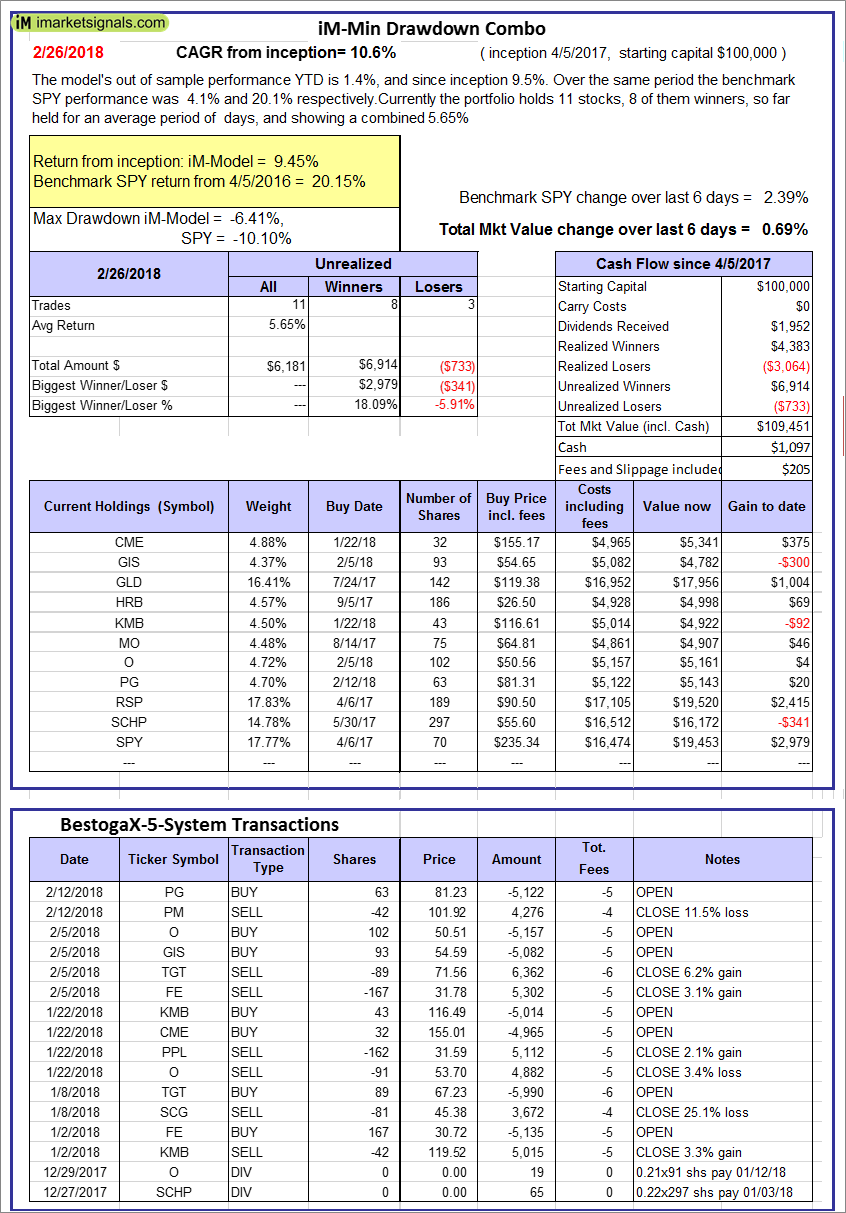
iM-Min Drawdown Combo: The model’s out of sample performance YTD is 1.4%, and since inception 9.5%. Over the same period the benchmark SPY performance was 4.1% and 20.1% respectively. Over the previous week the market value of the iM-Min Drawdown Combo gained 0.69% at a time when SPY gained 2.39%. A starting capital of $100,000 at inception on 4/5/2017 would have grown to $109,451 which includes $1,097 cash and excludes $205 spent on fees and slippage. |
|
|
iM-5ETF Trader (includes leveraged ETFs): The model’s out of sample performance YTD is 7.6%, and for the last 12 months is 40.8%. Over the same period the benchmark SPY performance was 4.1% and 19.7% respectively. Over the previous week the market value of the iM-5ETF Trader (includes leveraged ETFs) gained 4.53% at a time when SPY gained 2.39%. A starting capital of $100,000 at inception on 10/30/2016 would have grown to $175,054 which includes $1,064 cash and excludes $1,030 spent on fees and slippage. |
|
|
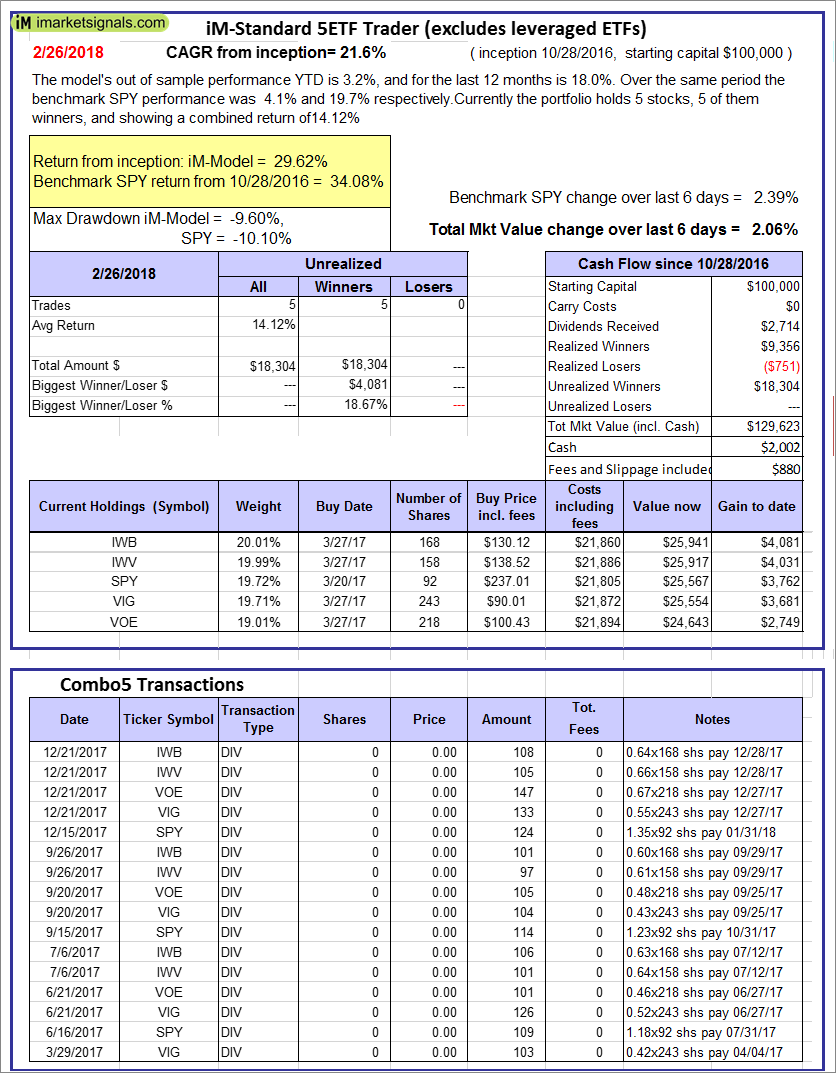
iM-Standard 5ETF Trader (excludes leveraged ETFs): The model’s out of sample performance YTD is 3.2%, and for the last 12 months is 18.0%. Over the same period the benchmark SPY performance was 4.1% and 19.7% respectively. Over the previous week the market value of the iM-Standard 5ETF Trader (excludes leveraged ETFs) gained 2.06% at a time when SPY gained 2.39%. A starting capital of $100,000 at inception on 10/30/2016 would have grown to $129,623 which includes $2,002 cash and excludes $880 spent on fees and slippage. |


Leave a Reply
You must be logged in to post a comment.