
Unemployment
 The unemployment rate recession model (article link), has been updated with the August UER of 4.2%. Based on the historic patterns of the unemployment rate indicators prior to recessions one can reasonably conclude that the U.S. economy is not likely to go into recession anytime soon. The growth rate UERg is at minus 11.13% (same as last month) and EMA spread of the UER is at minus 0.25% (last month minus 0.21%).
Here is the link to the full update.
The Dynamic Linearly Detrended Enhanced Aggregate Spread:
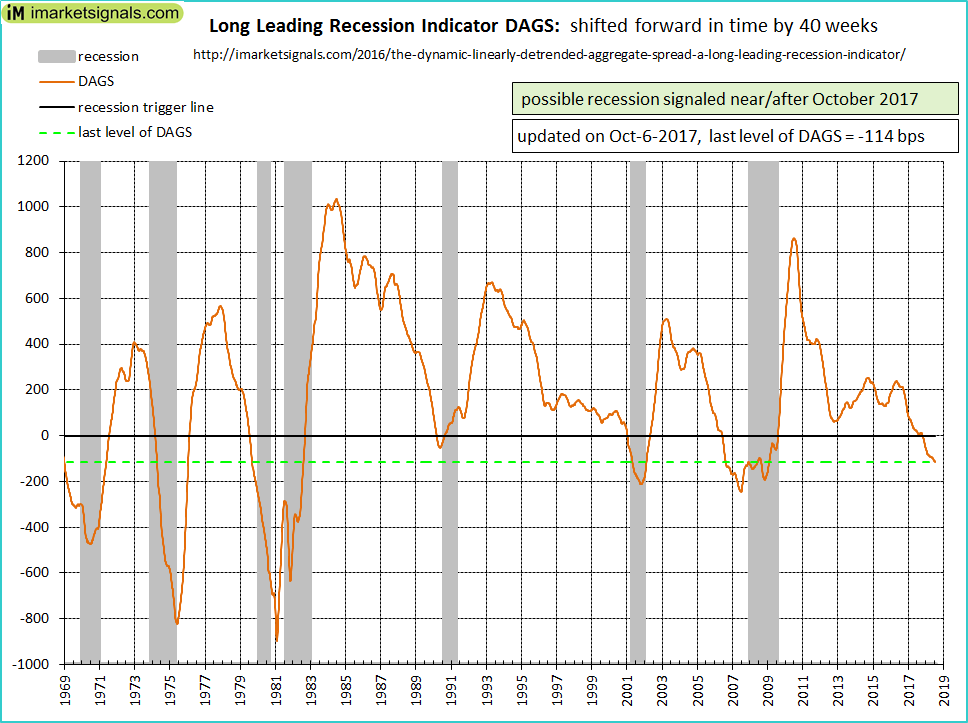 The updated level of this indicator, -114bps (last months -104bps), confirms the January 20, 2017 signal. Based on past history a recession could start at the earliest in October 2017, but not later than May 2019. The average lead time to previous recessions provided by DAGS was 15 months which would indicate a recession start for April 2018.
Coppock Indicator for the S&P500
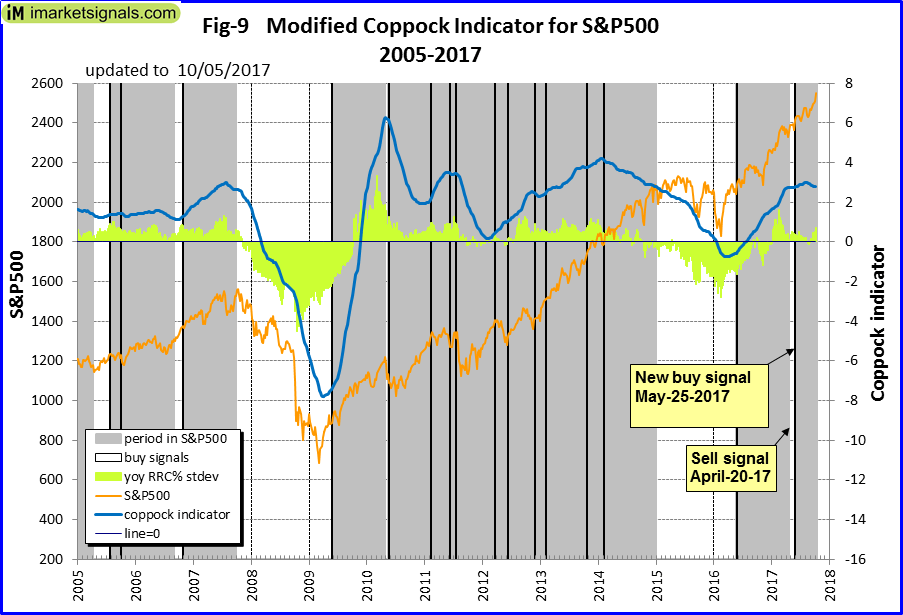 The Coppock indicator for the S&P500 entered the market end May 2017. This model is in stocks. This indicator is described here.
CAPE-Cycle-ID
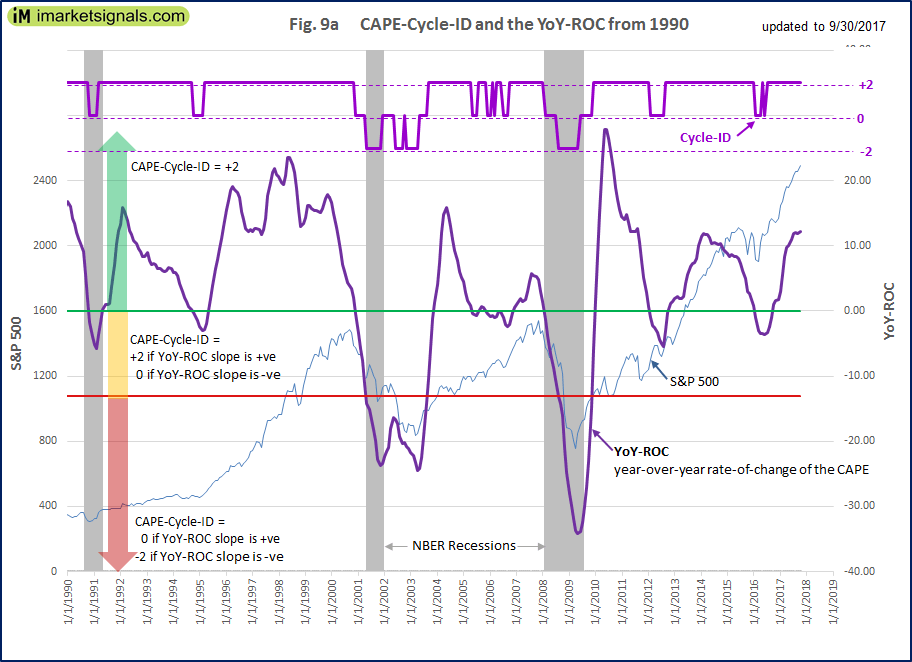 Fig 9a depicts the CAPE-Cycle-ID and the year-on-year rate-of-change of the Shiller CAPE. A model using this indicator invests in the market when the Cycle-ID is +2 or 0, and when the Cycle-ID equals -2 the model is in cash. This indicator is described here.
Trade Weighted USD
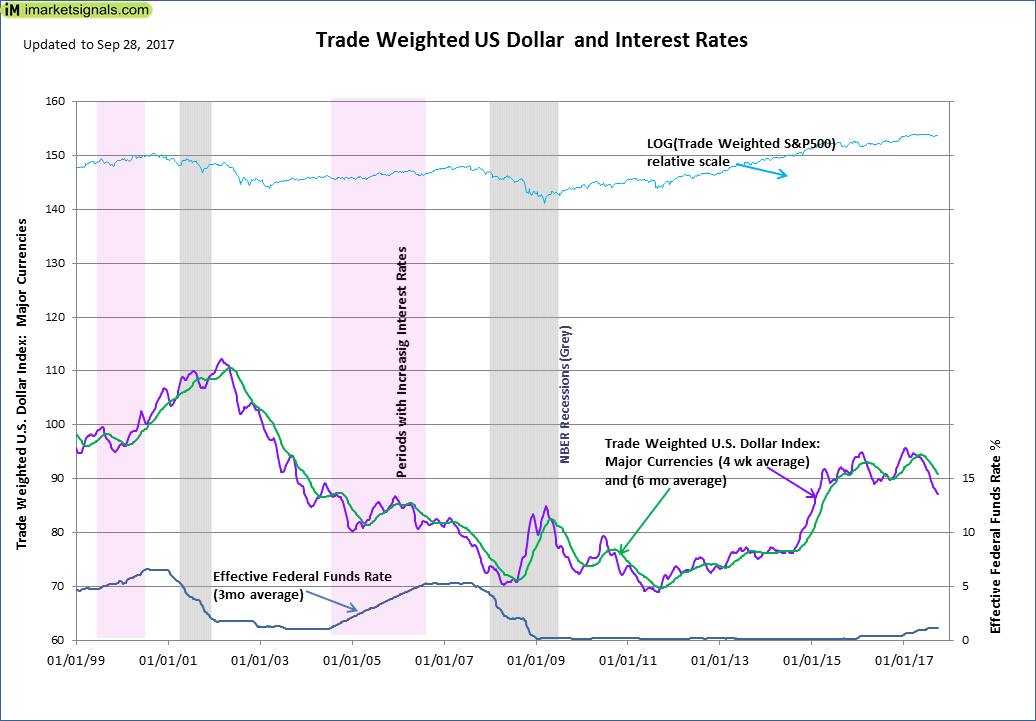 The TW$ value is continually weakening in spite of increasing federal fund rates.
TIAA Real Estate Account
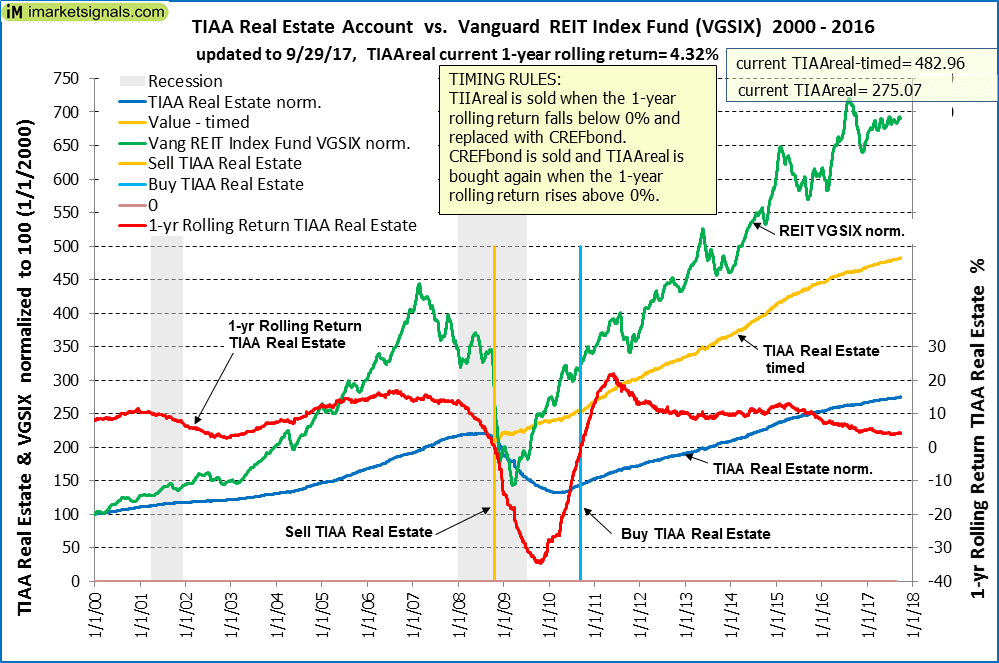 The 1-year rolling return for the end of last month is 4.32%. A sell signal is not imminent.
Leave a Reply
You must be logged in to post a comment.