
- The founder of Vanguard, Jack Bogle, says that over the next decade a conservative portfolio of bonds will only return about 3% a year and stocks about 4% a year.
- However, returns can be improved with a dynamic asset-allocation strategy that adjusts stock- and bond-fund holdings in a retirement account according to market climate.
- The Vanguard LifeStrategy Moderate Growth Fund (VSMGX) holds static investments of 60% equity and 40% bond funds and is compared to our dynamic strategy model.
- Our iM-DMAC(60:40) model, designed for retirement saving and withdrawal management, holds identical assets as VSMGX in up-market conditions but switches to 100% bond funds during equity down-market periods.
- The result, the iM-DMAC(60:40) vastly outperforms VSMGX.
For a $1 million initial VSMGX investment in January 1999, one could have withdrawn on average a real (inflation-adjusted) $2,420 per month and still keep the original investment intact to November 2017. The monthly withdrawal amount can be more than doubled by adjusting the investment according to market climate, as indicated by a 50-200 day moving-average-crossover system of the S&P 500. This would have allowed an average withdrawal of a real $5,480 per month for almost 19 years, while still retaining a real $1,000,000 in the retirement account at the end.
We backtested the model on the on-line simulation platform Portfolio123, which provides historical economic and financial data as well as extended price data for ETFs before their start dates. The model assumptions are:
- The simulation uses closing prices, zero trading costs and ignores slippage, which would be the case when trading the equivalent Vanguard mutual funds.
- Trades occur on the first business day of a week based on signals from the market climate indicator.
- The minimum holding period is forty days in line with the rules pertaining to mutual funds when they are used instead of the ETFs in the simulation.
- At the end of each calendar year, the investment is rebalanced to the nominal 60% stocks and 40% bonds, but only if the rebalance amount exceeds 5% of total investment.
The start date of the backtest was 1/2/1999, because this is the earliest start date for a simulation on Portfolio123.
Model philosophy
The model holds ETFs matching the underlying mutual funds of the Vanguard LifeStrategy Moderate Growth Fund (VSMGX), and in the same allocation of 60% stocks and 40% bonds during equity up-markets. During equity down-markets the model switches to 100% bonds, unlike Vanguard’s VSMGX which remains in 60% stocks in these down-periods.
Holdings during equity up-markets: (same as for VSMGX):
- 36% Vanguard Total Stock Market ETF (VTI)
- 24% Vanguard FTSE Developed Markets ETF (VEA)
- 28% Vanguard Total Bond Market ETF (BND)
- 12% Vanguard Total International Bond ETF (BNDX)
Holdings during equity down-markets:
- 17.5% Vanguard Total Bond Market ETF (BND)
- 7.5% Vanguard Total International Bond ETF (BNDX)
- 75% Vanguard Mortgage-Backed Securities ETF (VMBS)
A 50-200 day moving-average-crossover system of the S&P 500 defines market conditions. Equity down-markets prevail when the 50-day moving average is below the 200-day moving average, and the opposite for up-markets. On entering the down-market period stock ETFs VTI and VEA are sold and replaced with the bond ETFs, which are and held until the 50-day moving average is above the 200-day moving average. Both the entry and exit trades are constrained by the 40-day minimum holding period.
Performance of the iM-DMAC(60:40)
Figure-1 below, compares the performance of the iM-DMAC(60:40) strategy (red graph) with that of Vanguard’s VSMGX (black graph).
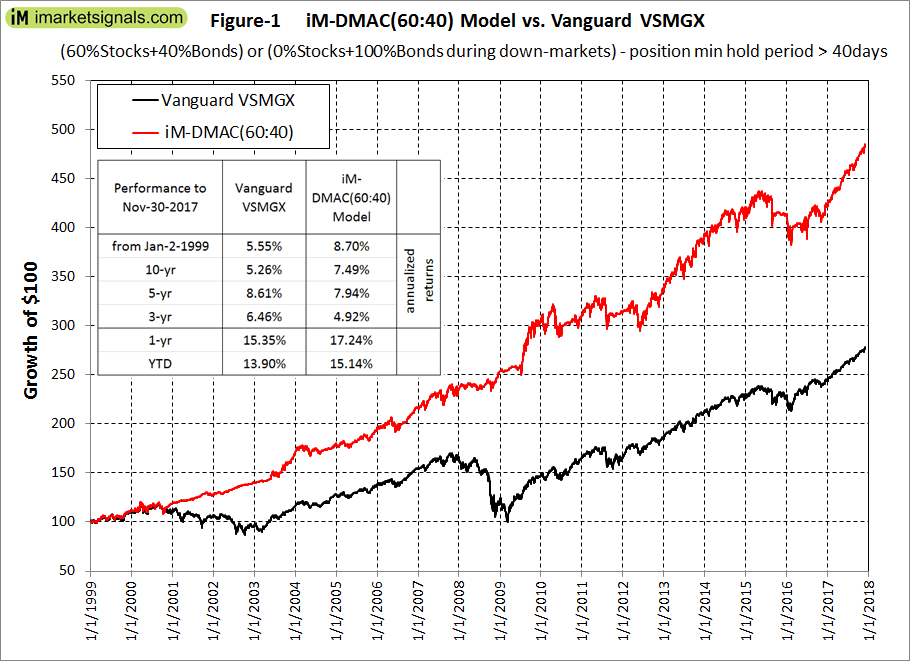
Obviously, a dynamic asset strategy is preferable to the buy-and-hold investment of VSMGX.
Risk
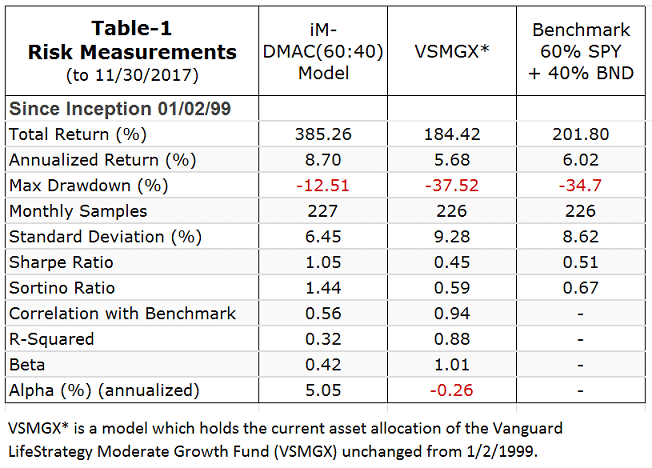
A simulation of VSMGX (shown as VSMGX*) using current asset allocation of the Vanguard LifeStrategy Moderate Growth Fund unchanged since January 2, 1999. The results of this simulated closely matches that of Vanguard’s VSMGX. (see table below)
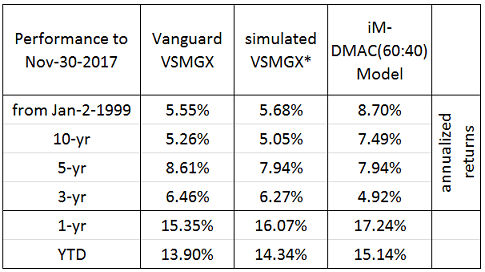
Table-1 below compares the risk measurements for iM-DMAC(60:40), VSGMX* and Portfolio123’s 60:40 benchmark. For most cases VSMGX* underperforms the benchmark, whereas iM-DMAC(60:40) outperforms both. To buy-and-hold a static 60:40 stock-bond investment is a risky strategy, evidenced by high maximum drawdowns, high standard deviations and the low Sharpe and Sortino ratios. In contrast, the iM-DMAC(60:40) provides higher returns at lower risks.
An additional risk consideration is that portfolios holding stock- and bond-funds should lose less during black swan events. An example is the October-November 1987 stock-market crash when the S&P 500 lost approximately 27% in a few days. Over the same period the Vanguard GNMA Fund (VFIIX) gained about 5%. A 60:40 stock-bond fund with VFIIX would have had a more tolerable loss of about 14%. Thus, it is prudent to invest in blended funds of stocks and bonds, provided one changes the investment to 100% bonds during equity down-markets.
Trading effort
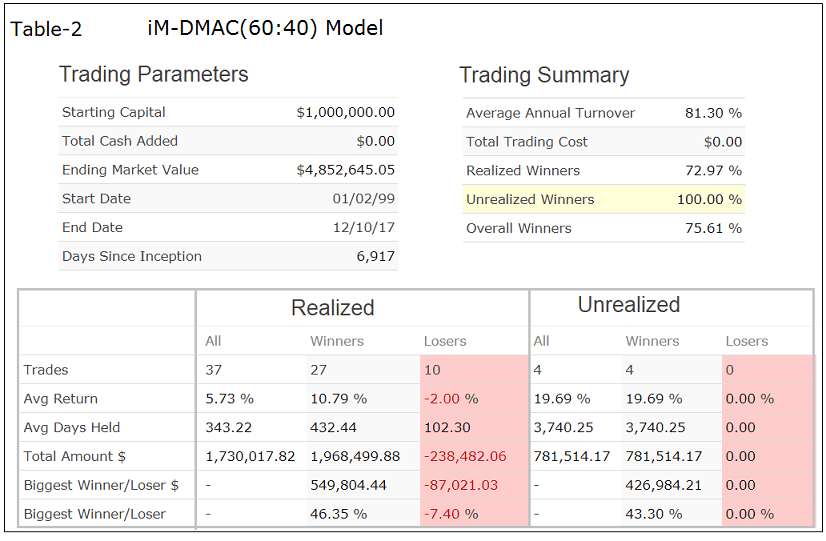
Very little effort is required to adjust and rebalance the stock-bond allocation of the model over time. Table 2 below shows the trading statistics for the Dynamic 60:40 MAC Model. Over a period of almost 19 years, from January 1999 to November 2017, there were only 37 realized trades, including annual rebalancing transactions. A listing of realized transactions (not reproduced here) shows that trading occurred only on 34 days over this 19-year period.
Maximum withdrawals
From January 1999 to November 2017 the average annual inflation rate was 2.17%. Thus, an initial investment of $1,000,000 would have needed to rise to approximately $1,500,000 by the end of November 2017 to keep pace with inflation. Figure 2 examines the maximum withdrawal rate from both VSMGX and iM-DMAC(60:40) to retain a $1,000,000 investment in January 1999, a real value of $1,500,000 today.
In Figure 2 below, the green graph shows the value of an initial investment of $100 inflation adjusted over time. The red graph shows the value of the iM-DMAC(60:40) after monthly withdrawals equivalent to an annual 6.1% of the portfolio value. Similarly, the black graph shows the value of VSMGX with a 3.2% annual withdrawal rate, which is less than the typical 4% generally applied in retirement.
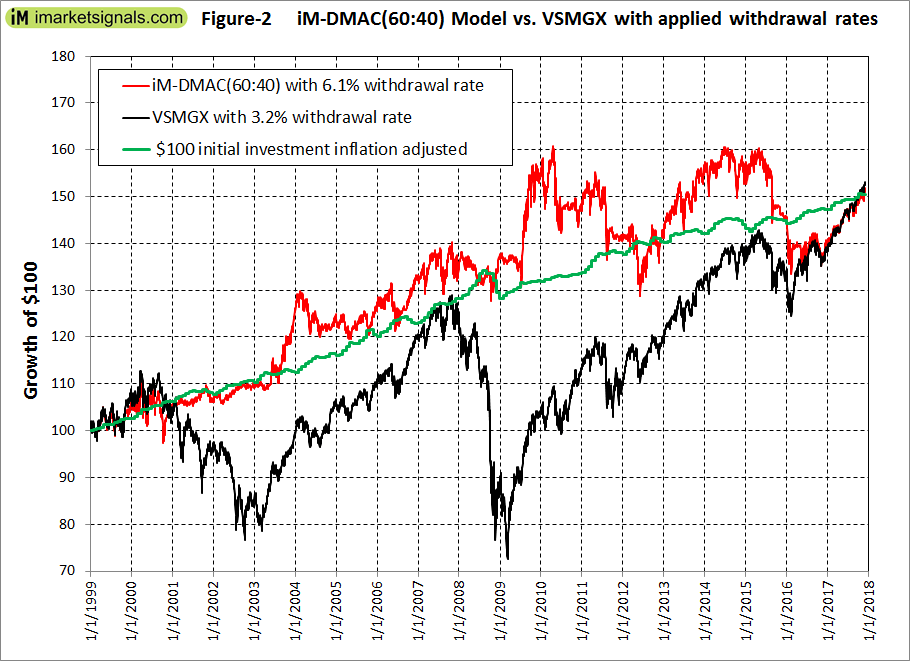
All three graphs have the same values at the start and at the end dates. However, the VSMGX’s investment value, with monthly withdrawals, suffered drawdowns of 32% and 42% in 2002 and 2009, respectively. For most of the time the value was well below the inflation adjusted initial investment, and the possibility of running out of money was a real threat.
In contrast, the value of the iM-DMAC(60:40) portfolio with monthly withdrawals tracked the real value of the initial investment most of the time and suffered only a 23% maximum drawdown in 2012.
To retain an inflation adjusted $1 million initial investment in VSMGX made in January 1999 the maximum allowable annual withdrawal was 3.2% of the portfolio value. This translates to an average of a real $2420 per month for almost 19 years. The simulated actual monthly withdrawal amounts for 2017 are about $4000, and for 2009 about $2400, and over the period 1999 to 2017 the total of all actual withdrawal would have been $672,000.
For the same period, and same initial investment in the iM-DMAC(60:40) portfolio, the maximum allowable annual withdrawal was 6.1% of the portfolio value. This is an average of a real $5,480 per month. For 2017 the actual monthly withdrawal would have been $7,700 and for 2009 about $7,300, and the total of all withdrawals amounts to $1,539,000.
Thus a dynamic bond-stock allocation strategy based on market climate provides a lower risk, much higher and more stable income for retirees than what a static bond-stock investment can produce.
Conclusion
Investors should heed the warning of Vanguard’s founder, Jack Bogle, who says that over the next decade a conservative portfolio of bonds will only return about 3% a year and stocks about 4% a year. Passively holding funds like the Vanguard LifeStrategy Funds or Target-Date Retirement Funds would, according to Bogle, then only return about 3.5%.
Over the last 19 years blended 60% stock and 40% bond portfolios provided a return of about 5.5%. This would have increased to about 8.7% with the dynamic asset allocation strategy described here. If over the next decade returns from blended portfolios are as low as 3.5%, then the iM-DMAC(60:40) strategy probably could increase the return to 5.5%.
We have shown that with little effort one can improve returns significantly over the longer-term by switching to 100% bonds during down-market periods, which is easily identified by a simple 50-200 day moving-average-crossover system of the S&P 500, a dataset available to all.
I was wondering why you used the 50-200 mov-avg-cross system as opposed to your MAC-US Timer?
What would the results be if you used your MAC-US timer.
Thanks
This model is designed to be of interest to the general public and was published initially at Advisor Perspectives.
https://www.advisorperspectives.com/articles/2017/12/18/a-dynamic-strategy-that-outperforms-vanguards-lifestrategy-fund
We wanted to keep the market timing element as simple as possible to avoid any criticism of the model. Everybody knows that a 50-200 moving average crossover to the downside spells trouble for the stock-market. So anybody can use this model.
One can get much higher returns using our Composite Market Timer to define the periods to be in 100% bonds, but the minimum holding period has to be shortened from six to two weeks.
Is the drawdown of the iM-DMAC(60:40)-12.51% (per the table) or “23% maximum drawdown in 2012” per the narrative?
Nice work. I’ve looked at something similar but hadn’t thought about a minimum holding period.
The 23% maximum drawdown in 2012 is for the monthly withdrawal model. The 12.51% drawdown applies to the model without withdrawals.
Hi Georg,
thanks for this model. Again nice work !
How would the numbers look if you used this strategy with 100% stocks and the “IM-Composite Market Timer”?
Using the iM-Composite Market Timer instead of the S&P500 50/200 MAC provides much higher returns and would allow much higher monthly withdrawals. However, there would be many more changes in asset allocations than for the MAC.
I’m afraid I’ve gotten myself a little confused. On the home page which timer is the iM-Composite Market Timer as noted above?
Related to that, do you use the Stock Market Confidence Level (first thing on home page) as a timer? If so, do you have a link to that one’s description and performance?
Thanks.
In iM-Best Holdings the iM-Composite Market Timer is the 8th model from the top.
We have so far no model following the Stock Market Confidence Level.
Hi Georg,
A couple of comments.
The 19 year period includes two major downturns in equities (which the model deals with) but bonds were mostly in a bull market generating capital appreciation over the whole period. A 3% forward expected return in bonds is a much different scenario than in the last 19 years. Since the model relies on being in bonds more than the benchmark, the model cannot be expected to outperform to the same degree going forward.
Also, the model appeared to outperform the benchmark in only 3-4 of the 19 years – the years of the two major downturns – and under-performed in much of the rest of the period. It under-performs during periods where there are smaller or shorter-duration corrections because the 50-200 day MA system essentially gives false positives. Perverse as it may seem, the model hopes for an equity market characterized by large, long-lasting downturns rather than a series of smaller, short-lived corrections. But, for the retiree, avoiding the risk of a major downturn makes it worth it.
Actually the model underperformed the 60:40 benchmark only during 6 years, and then only by a small amount, except for 1999 – the dot.com bubble year.
Year …. Model …. Bench …. Excess
1999 …. 1.10 …. 11.75 …. -10.66
2000 …. 11.27 …. -1.10 …. 12.37
2001 …. 8.07 …. -3.59 …. 11.67
2002 …. 9.54 …. -9.30 …. 18.83
2003 …. 24.45 …. 18.36 …. 6.09
2004 …. 11.07 …. 8.24 …. 2.84
2005 …. 6.86 …. 3.95 …. 2.90
2006 …. 13.97 …. 11.18 …. 2.79
2007 …. 8.67 …. 6.47 …. 2.20
2008 …. 8.10 …. -20.33 …. 28.44
2009 …. 20.53 …. 17.82 …. 2.71
2010 …. 10.71 …. 11.94 …. -1.23
2011 …. 0.11 …. 5.09 …. -4.98
2012 …. 11.59 …. 11.25 …. 0.34
2013 …. 16.63 …. 17.47 …. -0.84
2014 …. 6.21 …. 10.55 …. -4.34
2015 …. 0.40 …. 1.31 …. -0.90
2016 …. 6.54 …. 8.36 …. -1.83
2017 …. 15.34 …. 14.18 …. 1.15
Good article, I have just started reading about dynamic asset allocation. It makes a lot of sense! One thing about this article though:
“Equity down-markets prevail when the 200-day moving average is below the 50-day moving average, and the opposite for up-markets.”
Not sure this is correct? Is it not that the equity down-markets prevail when the 200-day is above the 50-day moving average? Or in otherwords when the 50-day crosses below the 200 MDA? Been scratching my head wondering if I’m just reading it wrong!
This is a typo.
“Equity down-markets prevail when the 50-day moving average is below the 200-day moving average, and the opposite for up-markets.”
Thanks for reporting.