
- This system holds three ETFs according to stock market climate.
- Typically, during good-equity markets it holds equity- and leveraged-equity ETFs SPY, SSO, and UPRO.
- During bad-equity markets it holds leveraged short equity, short equity, and gold-ETFs SDS, SH, and GLD.
- It never holds fixed income ETFs, so we don’t have to worry about rising rates.
The model was backtested on the on-line simulation platform Portfolio 123 which also provides extended price data for ETFs prior to their inception dates calculated from their proxies. Trading costs, including slippage, were assumed as 0.1% of the trade amounts using closing prices.
Market timing Rules
Up- and down-markets definition is based on:
- the S&P 500 Risk Premium,
- the score of the iM-Composite Market Timers,
- and the current-year consensus S&P 500 EPS estimate.
(Risk Premium = SP500 Estimated Earnings Yield – 10Y T-Note Yield,
Down-markets are defined as periods when up-market conditions are absent.)
Performance of the 3ETF-Trader plus
Performance 2000-2017
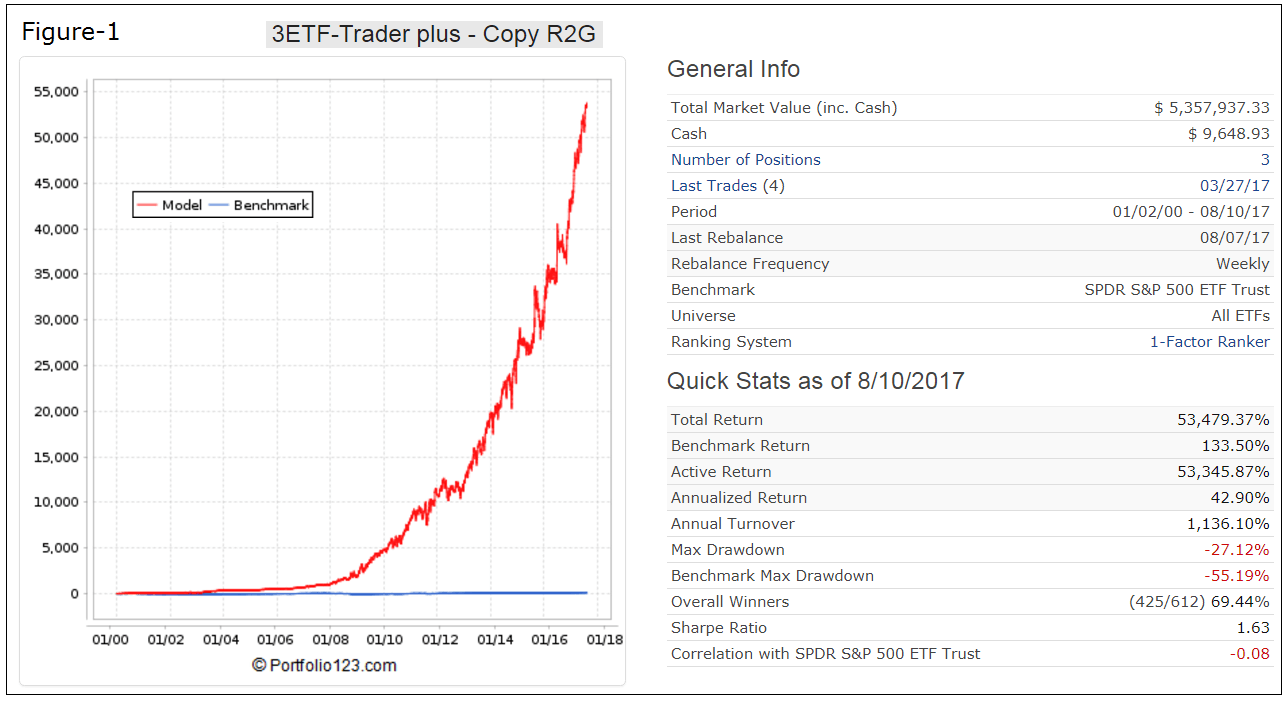
Performance from Jan-2000 to Aug-2017 is shown in Figure-1. The model showed an annualized return 42.9% with a -27.1% maximum drawdown.
Performance 2009-2017
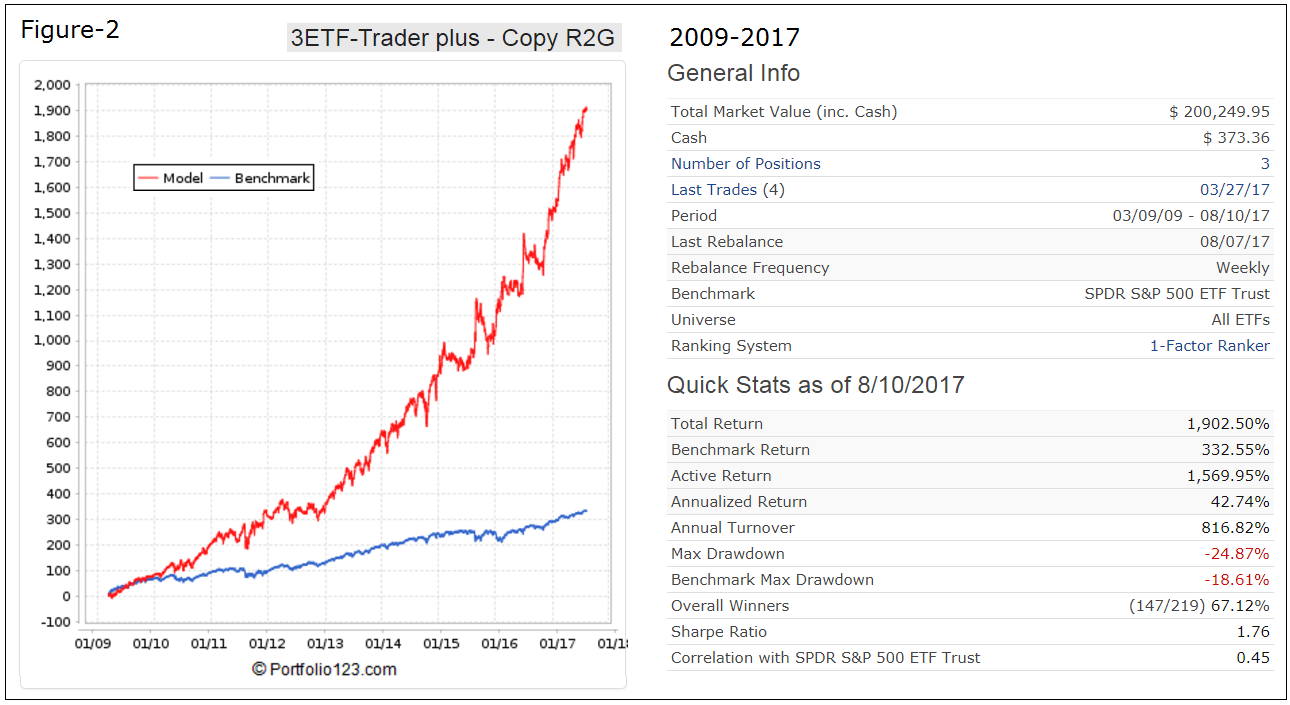
The simulated performance from Mar-9-2009 to Aug-2017 is shown in Figure-2. The start date for this period is the date when the S&P 500 was at its lowest level during the financial crisis recession. For the approximately 8-year backtest period the simulated annualized return was 42.7% with a maximum drawdown of -24.9%. The model significantly out-performed, but with higher drawdown, the SPDR S&P 500 ETF (SPY) over this up-market period.
Performance Histogram 2000-2017
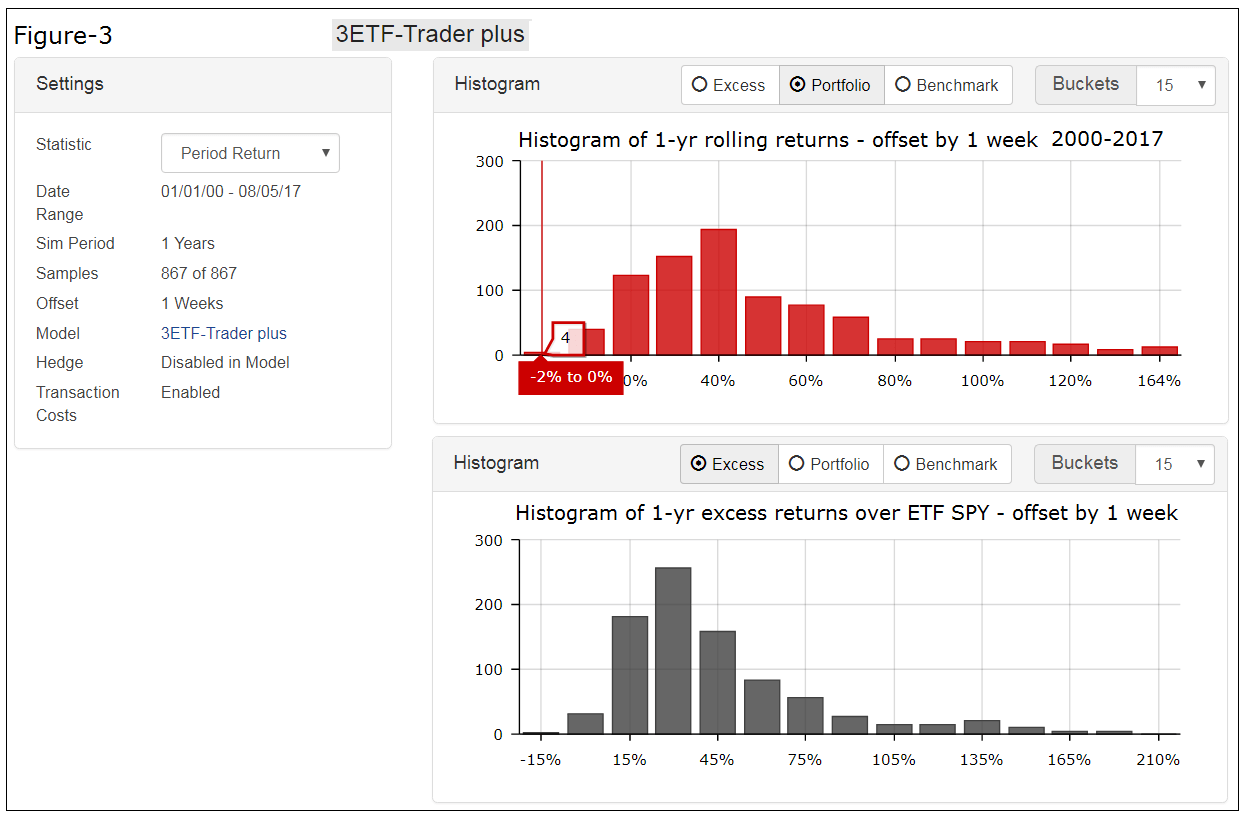
Rolling 1-year returns with a 1 week offset are shown in Figure-3. There were 4 out of 867 samples with a small negative 1-year return of about -2% to 0.0%, with trading costs included.
Calendar year performance
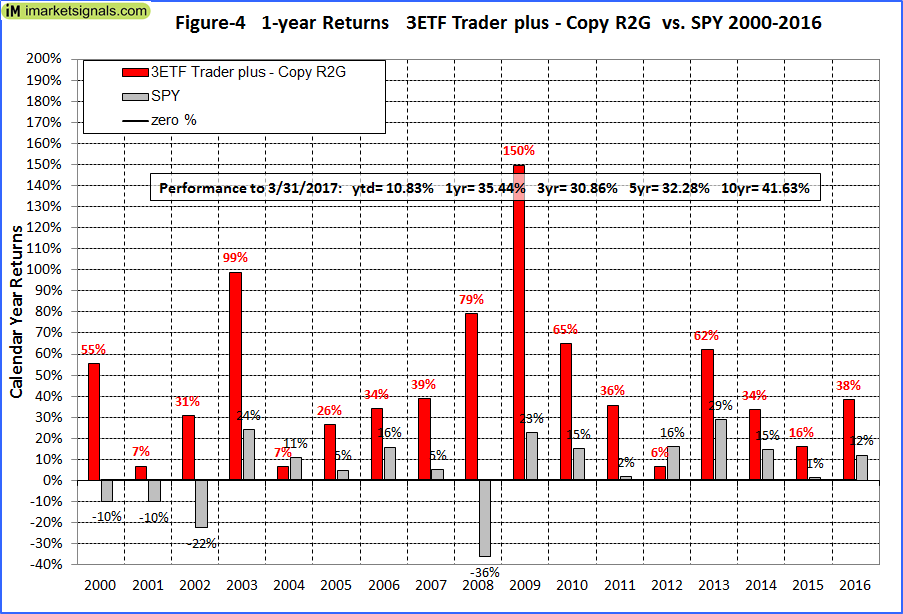
Calendar year returns are shown in Figure-4. There was never a year when the model had a negative return, but id did underperform SPY in 2004 and 2012.
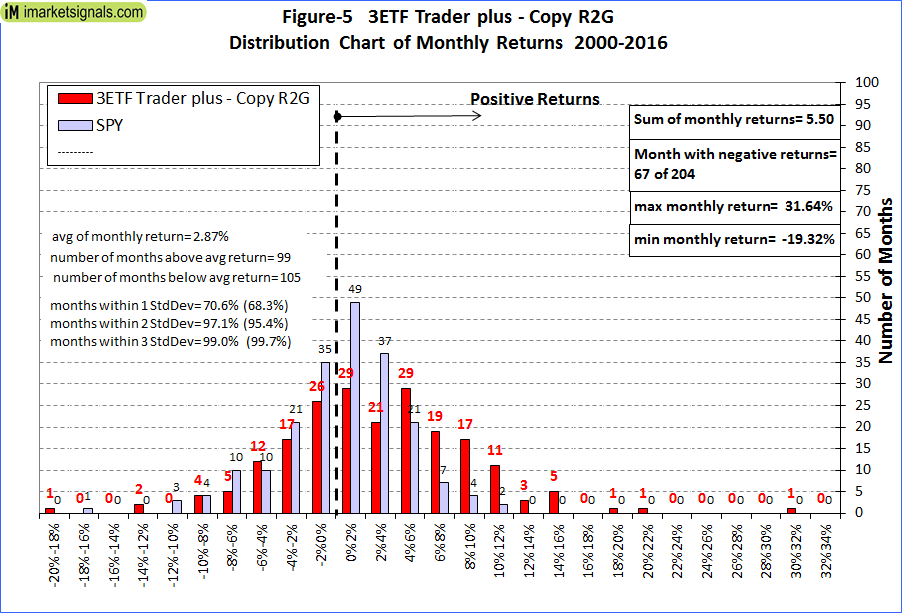
Distribution of monthly returns
Monthly return distribution is shown in Figure-5. There were only 67 negative monthly returns out of 204, versus 84 for SPY. Also, 99% of all monthly returns are within three standard deviations away from the mean, indicating that performance is not due to a few outliers with extreme returns. The values in brackets are for normal distribution.
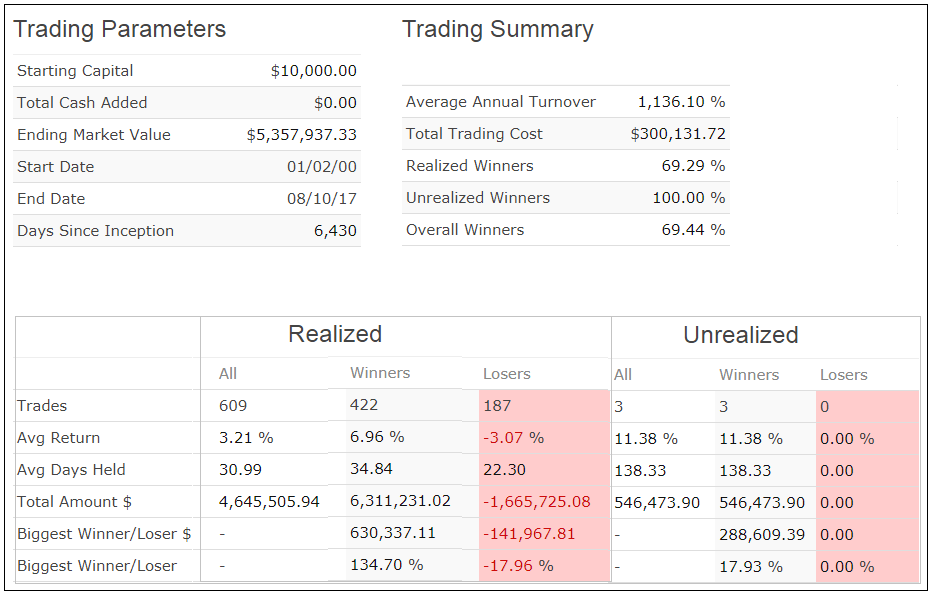
Trading Statistics
This is a trading model with an average annual turnover of about 1,136% (11 x). The average holding period of a position was 31 days, 69% of all trades were winners, and the biggest loss of any trade was -18.0%, all as shown in the table below.
Risk Measurements
Risk measurements are from Portfolio 123.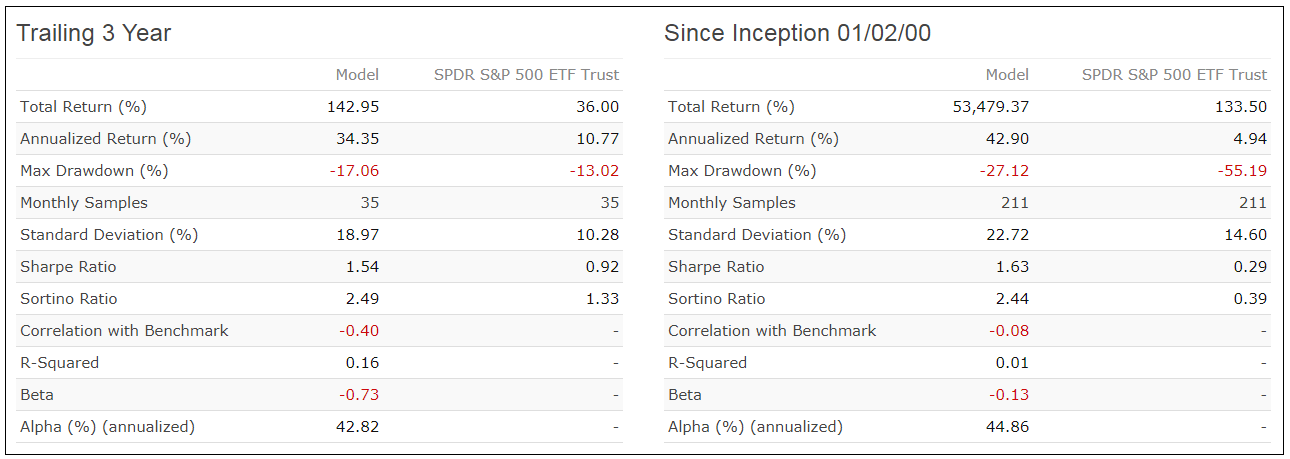
Following the model
This model can be subscribed to at Portfolio123, and could be of interest to investors willing to accept a fair amount of trading activity. See also “Best Practices” for ETF Trading.
Note, that this is a trading model with 76% of all trades having a holding period of three weeks or less. There were 36 trades per year on average, and the maximum was 64 trades in 2000.
|
Holding period |
Pct. of all trades |
Number of trades 2000-2017 |
|
13-21 days |
76.0% |
463 |
|
22-42 days |
11.3% |
69 |
|
43-92 days |
6.2% |
38 |
|
93-183 days |
3.9% |
24 |
|
184-240 days |
0.5% |
3 |
|
241-365 days |
0.5% |
3 |
|
More than a year |
1.5% |
9 |
Disclaimer
Note: All performance results are hypothetical and the result of backtesting over the period 2000 to 2017. Since performance is greatly dependent on market-timing rules, the future out-of-sample performance may be significantly less if those rules are not as effective as they were during the backtest period. No claim is made about future performance.
Georg,
given the relatively high turnover, is return adversely impacted if entries are made on Tuesday or Wednesday instead of Monday?
Thanks
Tom C
This high return model needs to be traded on the first trading day of the week.
Also, can you post a list of trades for this model?
There are over 600 realized trades for this model. Too many to post here.
Just to confirm, this model either holds SPY, SSO, and UPRO OR SDS, SH, and GLD. It doesn’t choose from a basket of ETF’s – correct?
That is correct. It does not choose from a basket of ETFs.
Georg,
Will you be offering this on Gold membership here, or only Portfolio123?
Thanks
This model is at P123. You can see out of sample performance here:
https://www.portfolio123.com/app/r2g/summary?id=1487866
Interesting model. Would you get nearly same results holding SSO for positive markets and SH 66% , GLD 33% for down markets making trading easier?
Yes, performance is very similar.
Annualized return is 38% vs 42% for 3ETF-Trader plus.
Max D/D is same at -27%.