
Market Signals Summary:
The MAC-US model is invested. Also invested is the “VMNFX vs. SPY Timer”. The “3-mo Hi-Lo Index of the S&P500” generated a sell signal on 9/27/2016 . The monthly updated S&P500 Coppock indicator entered the markets in May. The MAC-AU is also invested. The recession indicators COMP and iM-BCIg do not signal a recession. The bond market model avoids high beta (long) bonds, the yield curve is steepening. The gold model is invested and the silver model exited the market on June 24.
Stock-markets:
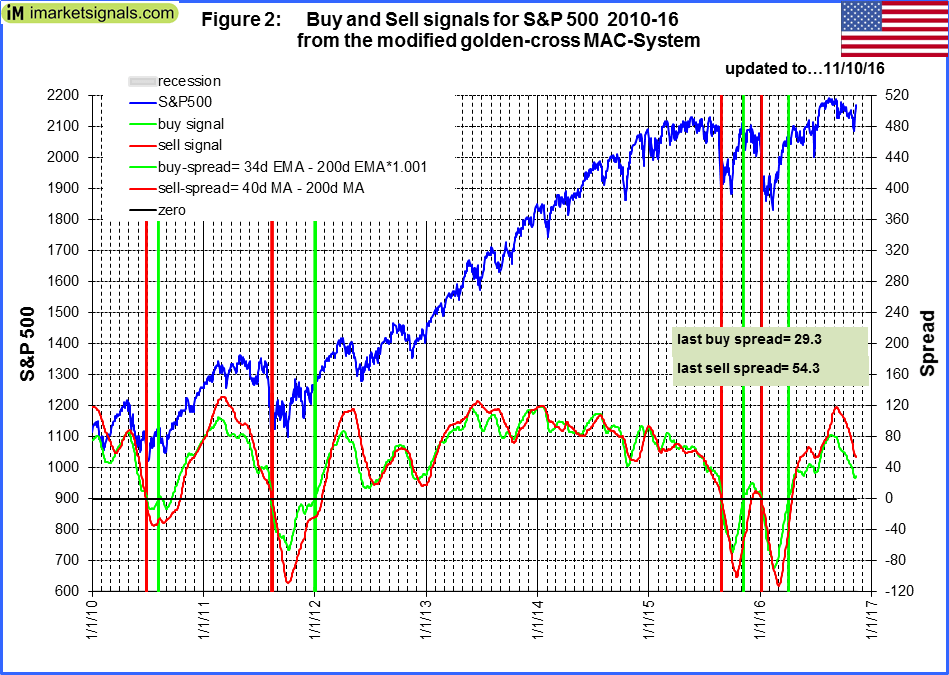 The MAC-US model generated a buy-signal 4/5/2016 and thus is invested in the stock-markets. The sell-spread (red graph) is down from last week’s level and has to fall below zero to signal a sell.
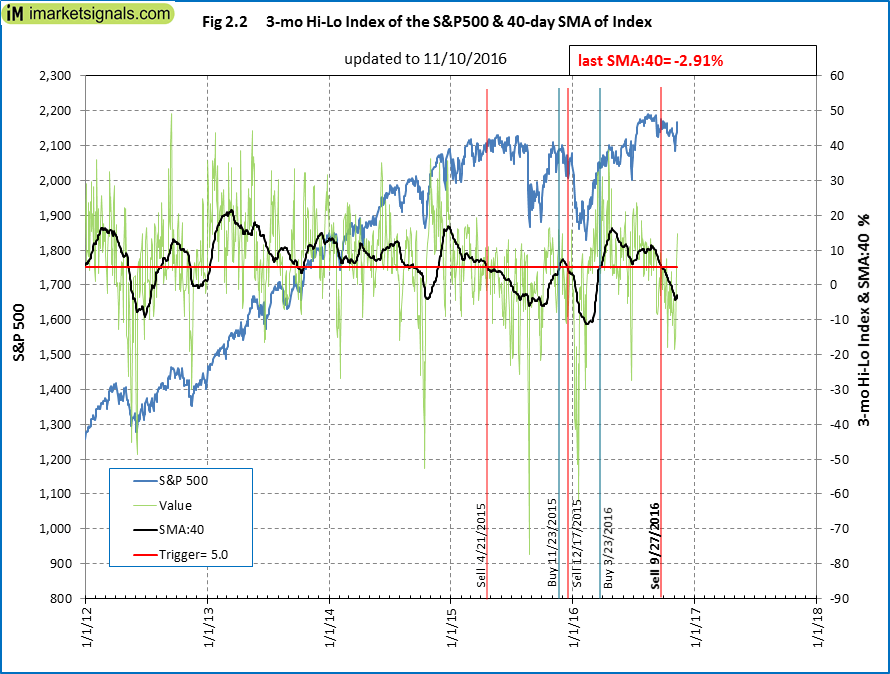 The 3-mo Hi-Lo Index of the S&P500 is above last week’s level and at -2.19% (last week -4.18%) and is not invested the stock markets since 9/27/2016. It has to rise above 5% to generate a entry signal.
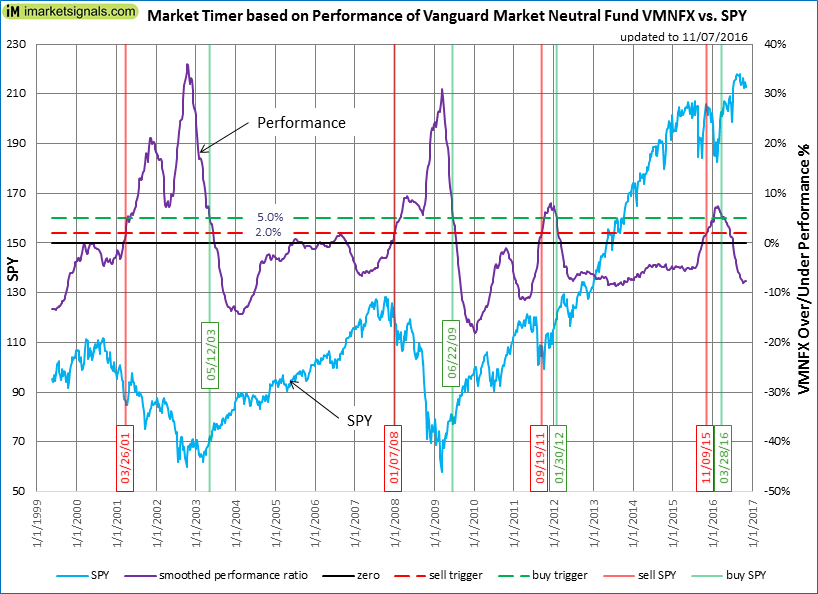 The VMNFX vs. SPY Timer signaled an entry into the stock markets on 3/28/2016. For this model to exit the markets the indicator has to rise above the 2% trigger line, the indicator is near last week’s level.
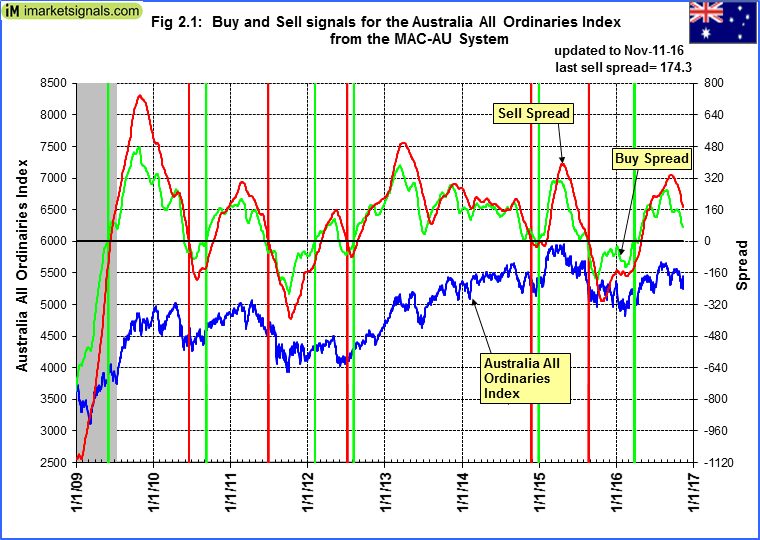 The MAC-AU model is invested in the markets after it generated a buy signal on March 21, 2016. The sell-spread is below last week’s level and has to fall below zero to signal a sell.
This model and its application is described in MAC-Australia: A Moving Average Crossover System for Superannuation Asset Allocations.
Recession:
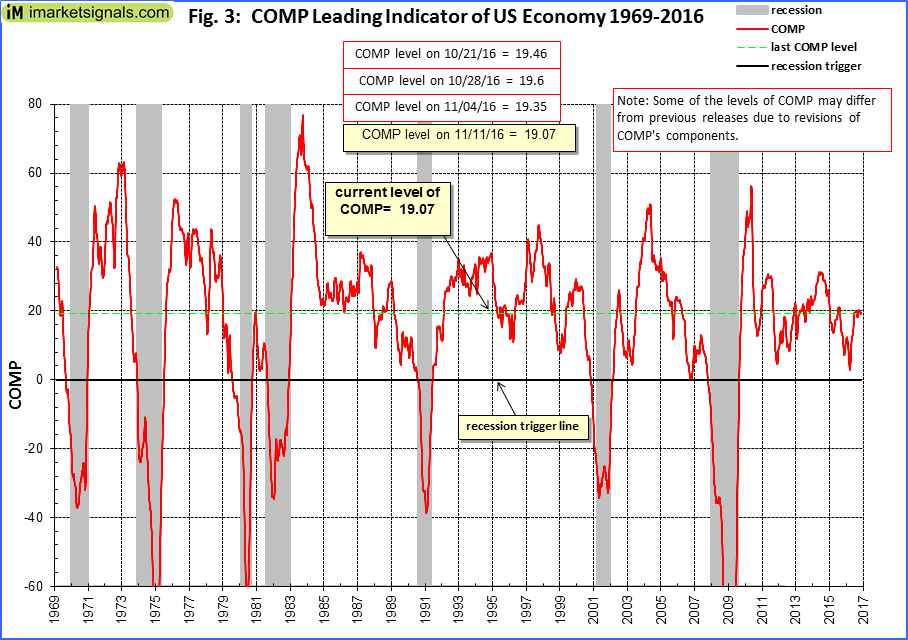 Figure 3 shows the COMP down from last week’s level. No recession is indicated. COMP can be used for stock market exit timing as discussed in this article The Use of Recession Indicators in Stock Market Timing.
 Figure 3.1 shows the recession indicator iM-BCIg also down from last week’s level. An imminent recession is not signaled .
Please also refer to the BCI page
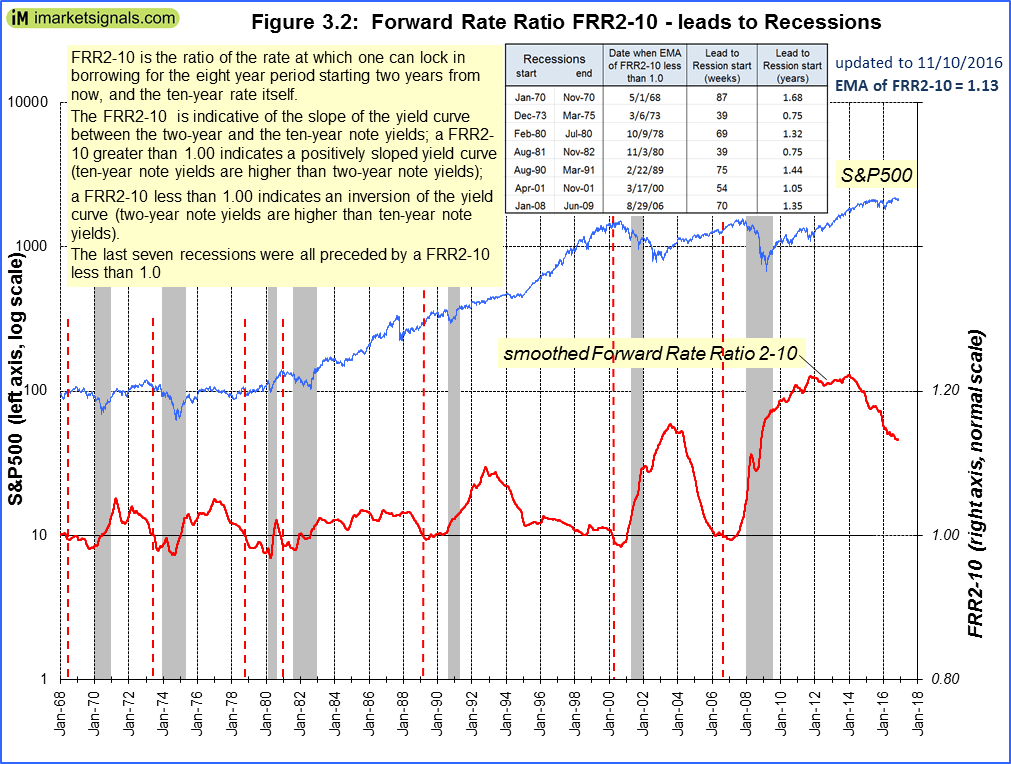 The Forward Rate Ratio between the 2-year and 10-year U.S. Treasury yields (FRR2-10) is near the previous week’s level and far away from signalling a recession.
A description of this indicator can be found here.
Leave a Reply
You must be logged in to post a comment.