
- The BestogaX universe of the Russell1000 consists of the so called “Vice” stocks (excluding Gaming stocks), plus the stocks from the GICS-sub-industries: Restaurants, Soft Drinks, and Internet Retail.
- A capitalization weighted index of this universe outperformed SPY by about 4.5 times from Jan-2000 to Mar-2016.
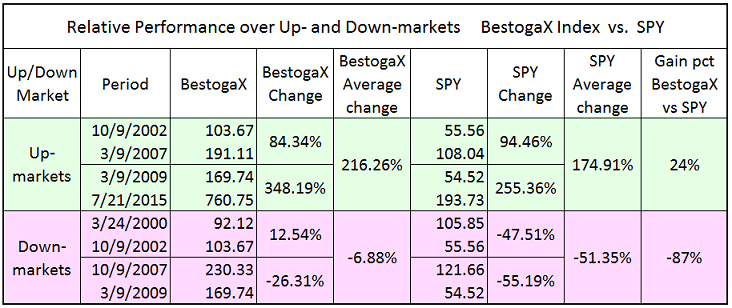
- Over down-market periods the iM-BestogaX Index lost on average 87% less than SPY, and over up-market periods gained on average 24% more than SPY.
- Many of the BestogaX companies have affordable products, familiar name brands, and worldwide distribution networks, providing them with reliable revenue growth also during adverse economic climates.
- Investors holding continuously all the BestogaX stocks, and rebalancing to equal weight every four weeks, would have had an annualized return of over 17% from January 2000 to March 2016.
Current composition of the Russell1000 BestogaX universe
Over the backtest period, Jan-2000 to Mar-2016, the number of stocks in this universe varied from a minimum of 23 to a maximum of 32. Stocks currently in the BestogaX universe are listed in the table below, with market capitalization shown in $-millions. There are 25 large-cap companies with a market-cap greater than $5-Billion.
| No. | Ticker | Name | Mkt. Cap | Sector Code | Ind. Code |
| 1 | AMZN | Amazon.com Inc | 273,118.78 | Discretionary | Retailmail |
| 2 | KO | Coca-Cola Co (The) | 198,039.20 | Staple | Beverage |
| 3 | PM | Philip Morris International Inc | 151,618.80 | Staple | Tobacco |
| 4 | PEP | PepsiCo Inc | 146,219.05 | Staple | Beverage |
| 5 | MO | Altria Group Inc | 120,798.44 | Staple | Tobacco |
| 6 | MCD | McDonald’s Corp | 111,690.55 | Discretionary | Hospitality |
| 7 | SBUX | Starbucks Corp | 87,590.98 | Discretionary | Hospitality |
| 8 | RAI | Reynolds American Inc | 72,023.63 | Staple | Tobacco |
| 9 | PCLN | Priceline Group Inc (The) | 63,852.13 | Discretionary | Retailmail |
| 10 | NFLX | Netflix Inc | 43,311.81 | Discretionary | Retailmail |
| 11 | YUM | YUM! Brands Inc. | 33,516.00 | Discretionary | Hospitality |
| 12 | STZ | Constellation Brands Inc | 29,766.21 | Staple | Beverage |
| 13 | MNST | Monster Beverage Corp | 27,034.40 | Staple | Beverage |
| 14 | BF.B | Brown-Forman Corp | 19,419.31 | Staple | Beverage |
| 15 | TAP | Molson Coors Brewing Co | 17,601.30 | Staple | Beverage |
| 16 | DPS | Dr Pepper Snapple Group Inc | 16,800.59 | Staple | Beverage |
| 17 | EXPE | Expedia Inc | 16,017.61 | Discretionary | Retailmail |
| 18 | CMG | Chipotle Mexican Grill Inc | 14,536.88 | Discretionary | Hospitality |
| 19 | CCE | Coca-Cola Enterprises Inc | 11,378.17 | Staple | Beverage |
| 20 | TRIP | TripAdvisor Inc | 9,079.14 | Discretionary | Retailmail |
| 21 | DRI | Darden Restaurants Inc. | 8,523.85 | Discretionary | Hospitality |
| 22 | ARMK | Aramark | 7,882.35 | Discretionary | Hospitality |
| 23 | DPZ | Domino’s Pizza Inc | 6,436.58 | Discretionary | Hospitality |
| 24 | LVNTA | Liberty Ventures | 5,433.57 | Discretionary | Retailmail |
| 25 | PNRA | Panera Bread Co | 5,088.77 | Discretionary | Hospitality |
| 26 | DNKN | Dunkin’ Brands Group Inc | 4,291.13 | Discretionary | Hospitality |
| 27 | CBRL | Cracker Barrel Old Country Store Inc | 3,595.88 | Discretionary | Hospitality |
| 28 | WEN | Wendy’s Co | 2,889.26 | Discretionary | Hospitality |
| 29 | EAT | Brinker International Inc. | 2,672.79 | Discretionary | Hospitality |
| 30 | SAM | Boston Beer Co Inc. (The) | 2,415.99 | Staple | Beverage |
| 31 | GRPN | Groupon Inc | 2,306.14 | Discretionary | Retailmail |
| 32 | JACK | Jack in the Box Inc. | 2,164.16 | Discretionary | Hospitality |
The iM-BestogaX Index of the Russell1000
This capitalization weighted index, with dividends included, is shown in the chart below from Jan-2000 to Mar-2016. It is compared to SPY with dividends re-invested, both series normalized to 100 at the beginning.
The green graph is the performance ratio of the iM-BestogaX Index to SPY. A rising slope of this graph indicates when it outperformed SPY; it produced about 4.5 times the value to March 2016 which one would have had from a buy-and-hold investment in SPY over the same period. Also, the maximum drawdown for the iM-BestogaX Index was only 31.9% versus 55.2% for SPY.
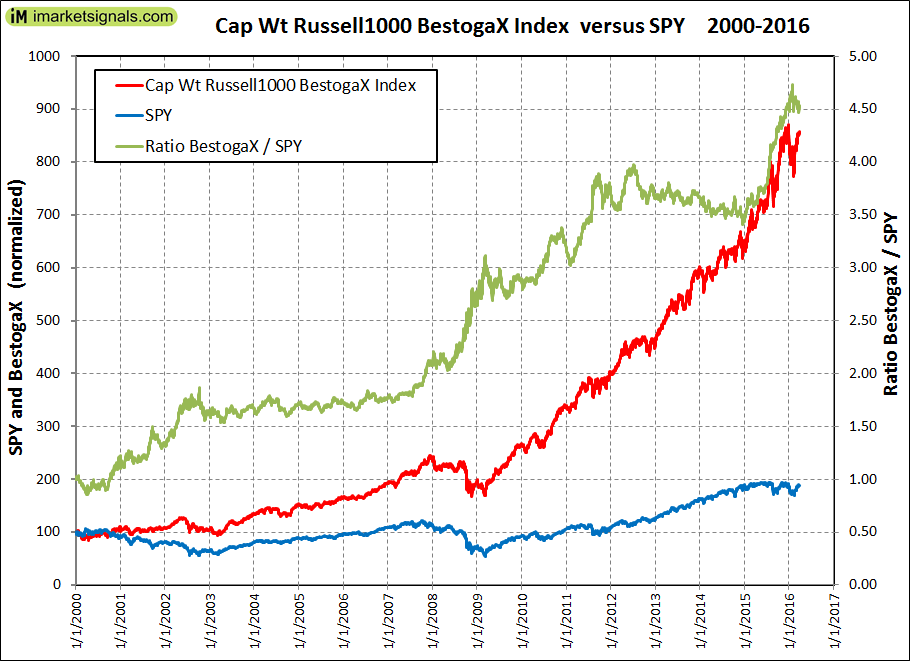
It is apparent from the ratio graph that the index strongly outperforms SPY during down-market periods. Over down-market periods the iM-BestogaX Index lost on average 87% less than SPY, and over up-market periods gained on average 24% more than SPY, as shown in the table below.
The performance of the iM-BestogaX Index high-lights the advantage of investing in the BestogaX stocks.
Historic performance of the BestogaX universe
Figure 1 shows the performance of an equal weighted investment in all available BestogaX stocks of the Russell1000 from the beginning of January 2000 to the middle March 2016, when rebalanced to equal weight every four weeks. The backtest was done on the web-based trading simulation platform Portfolio 123.
The annualized return would have been 17.2% with a maximum drawdown of -47.7%. Over the same period, SPY (the ETF tracking the S&P500) produced an annualized return of only 4.0% with a maximum drawdown of -55.2%.
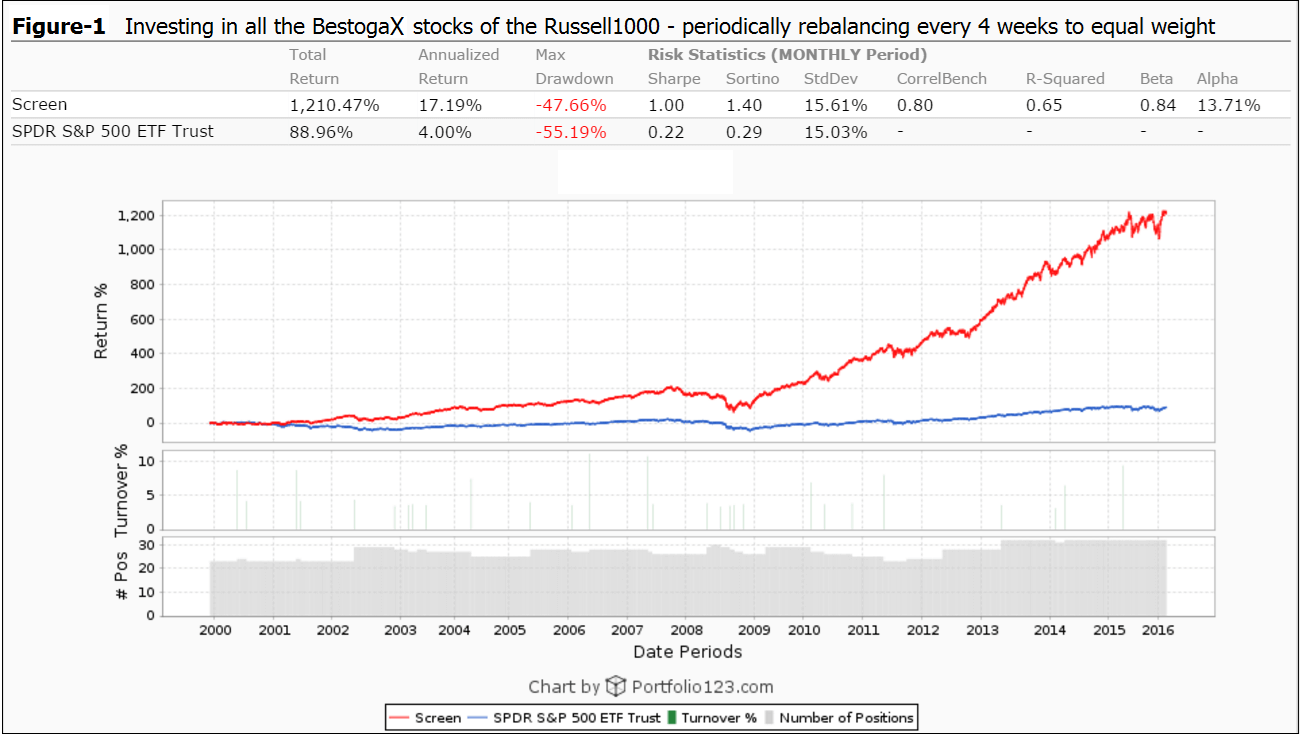
Continuously holding the BestogaX group of the Russell1000 would have been a good investment, but the maximum drawdown of -48% over the period October 2007 to March 2009 would have been distressing. Thus, this portfolio should have been hedged to avoid such drawdowns.
Hedging the BestogaX universe
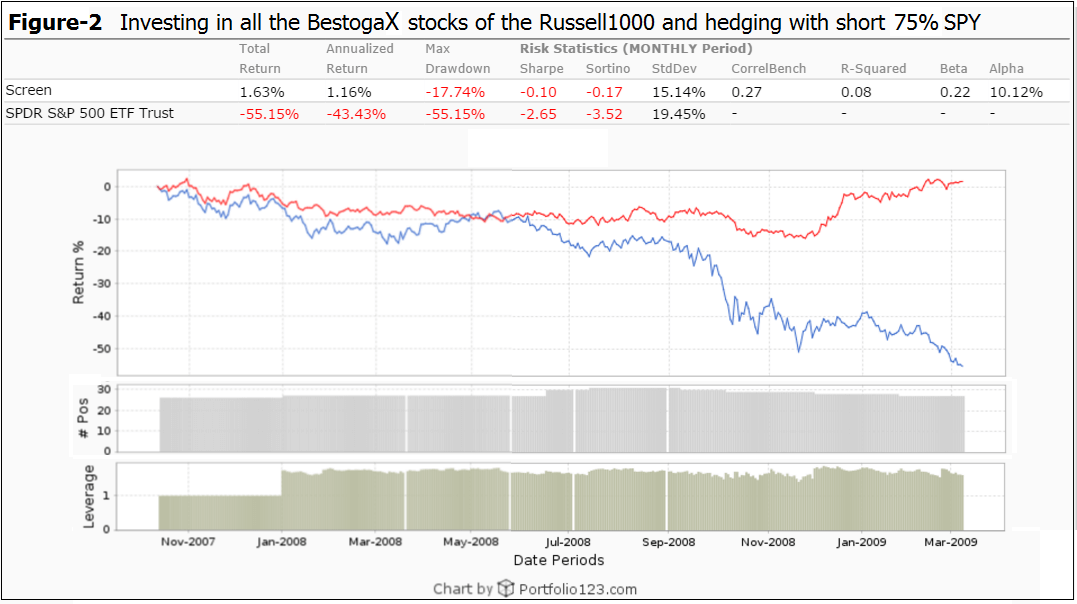
The worst decline occurred over the period from 10/27/2007 to the 3/9/2009 when SPY lost 55%. Ideally a hedge should have been in place for this entire period, but lacking perfect foresight, a simple moving average crossover system of the S&P500 was used to identify down-market periods. The portfolio was hedged when the 50-day moving average of the S&P500 was less than the 200-day moving average, a well-known indicator of market weakness.
The hedge assumed was to short SPY with a hedge percentage of 75% of the long portfolio value to achieve a market neutral situation over this period. This can be seen in Figure-2, with the Leverage bar-graph greater than 1.0 indicating the period when the portfolio was hedged.
Historic performance of the hedged BestogaX universe
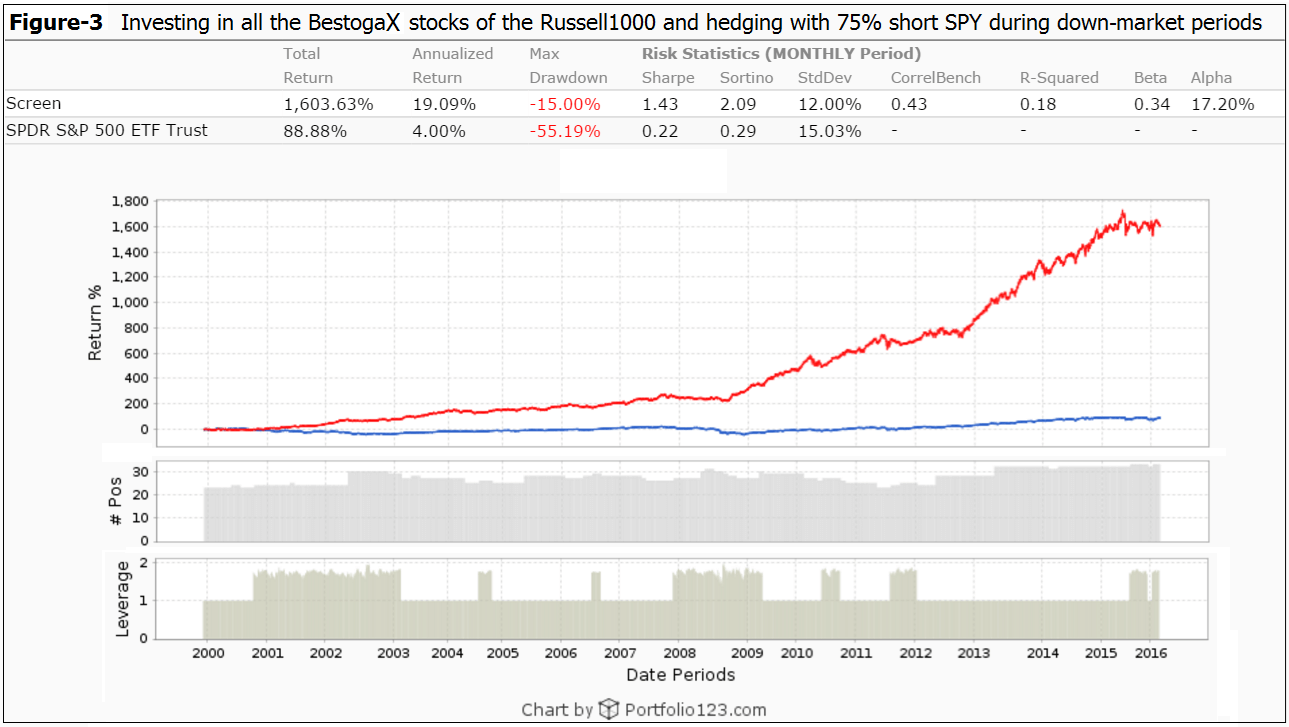
Figure 3 shows the performance of the BestogaX universe when hedged with 75% short SPY during periods when the 50-day moving average of the S&P500 was less than the 200-day moving average. The annualized return would have been 19.1% and the maximum drawdown only -15.0%.
Historic performance of the 10 highest ranked BestogaX stocks
Higher returns can be achieved by using a ranking system to periodically select only a few of the highest ranked stocks. Figure 4 shows the performance of the 10 highest ranked BestogaX stocks from January 2000 to March 2016, when rebalanced to equal weight every four weeks, and hedged with 75% short SPY. The annualized return would have been 29.1%, and the maximum drawdown -20.9%.
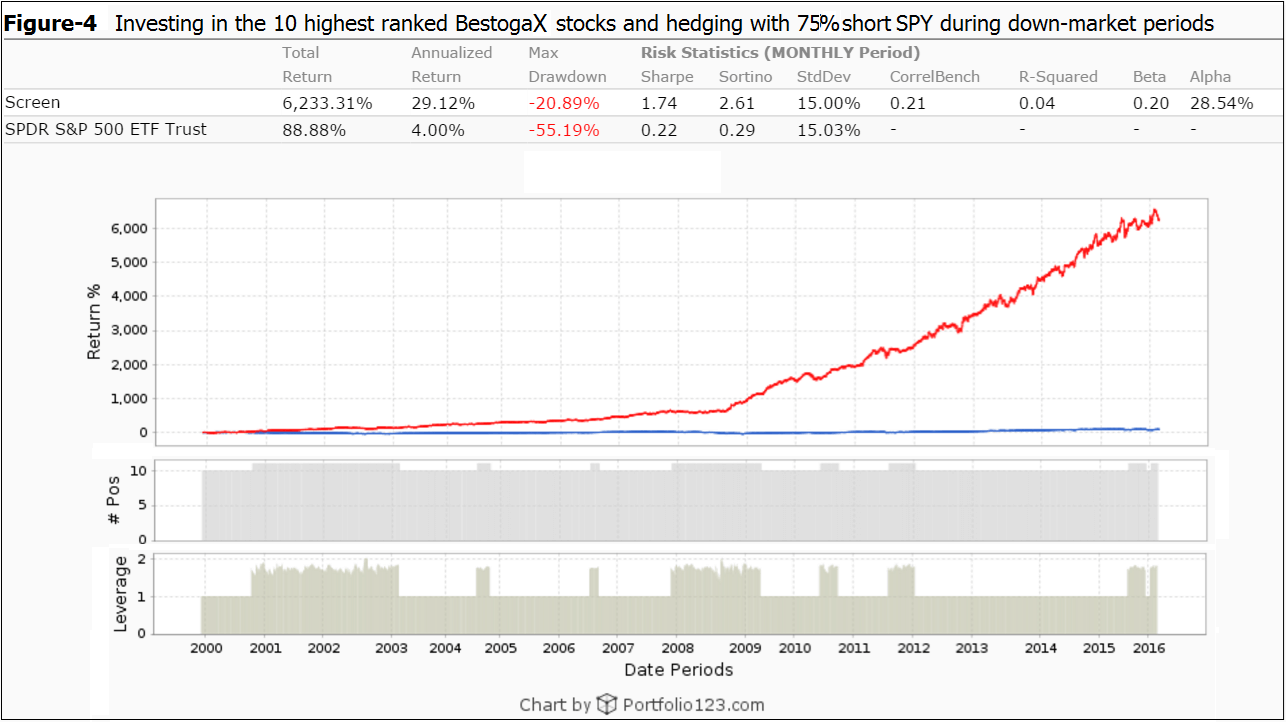
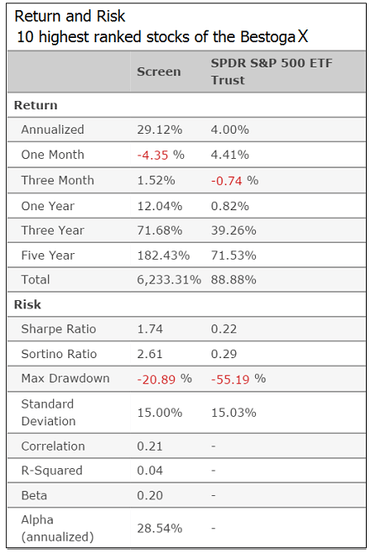
It would appear that annualized return of about 30% is achievable, with hedging and trading costs taken into account. Return and risk figures for this model are shown in the table below.
Investing in the BestogaX stocks
Since there are currently only 32 highly liquid stocks in the BestogaX universe of the Russell1000, it would not be too difficult for an individual investor to buy all the stocks in the group, and rebalance them to equal weight every four weeks. Based on past performance, one should easily be able to out-perform an S&P500 index fund, something which most actively managed mutual funds are unable to do.
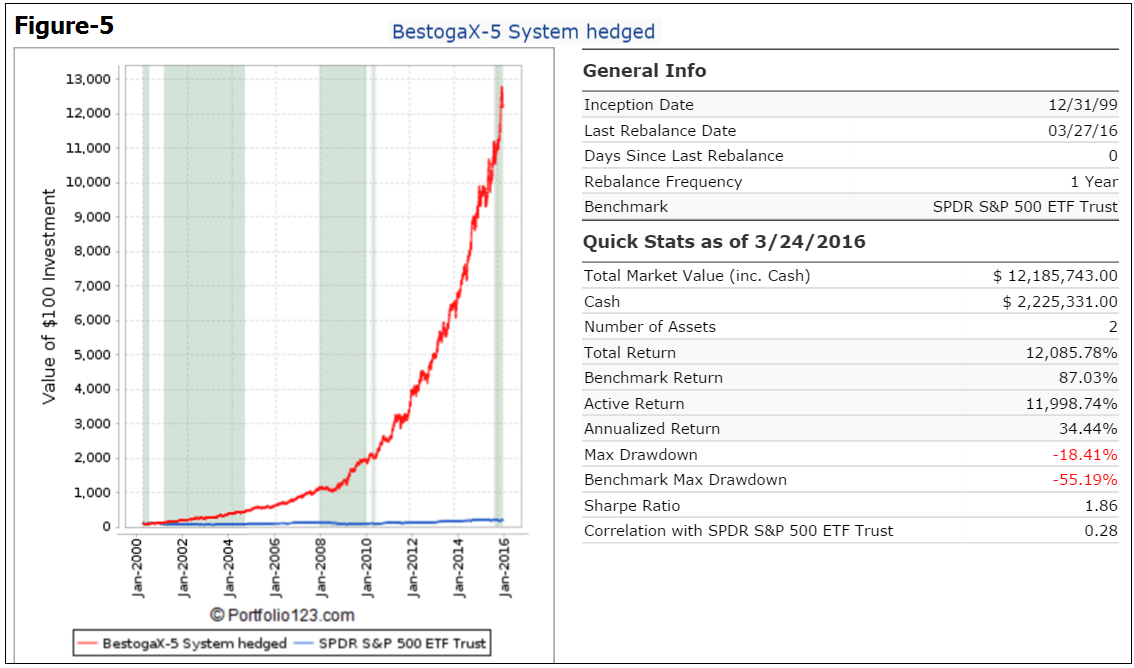
Alternatively, for possibly higher returns, investors can observe our iM-BestogaX5 System. This is a combination of two BestogaX models (Trader and Investor), each of which periodically selects only five of the highest ranked stocks from the Russell1000 BestogaX universe. This system has a low turnover, because the specified minimum holding periods are three months, and one year for the two component models, respectively. Also, there is no market timing in the stock buy- and sell rules. During adverse market conditions the system is hedged short SSO, with hedge ratios varying from 20% to 50% of current long holdings.
In the Figure-5 below, the red graph represents the performance of the combination model and the blue graph shows the performance of the benchmark SPY. The shaded portions represent periods when the model is hedged to varying percentages.
From Jan-2000 to Mar-2016 the simulation shows an annualized return of 34.4% with a maximum drawdown of -18.4%. Whether such a high return is also achievable out-of-sample remains to be seen.
Disclaimer
All results are presented for informational and educational purposes only and shall not be construed as advice to invest in any assets. Backtesting results should be interpreted in light of differences between simulated performance and actual trading, and an understanding that past performance is no guarantee of future results. All investors should make investment choices based upon their own analysis of the asset, its expected returns and risks, or consult a financial adviser. The designer of this model is not a registered investment adviser.
Leave a Reply
You must be logged in to post a comment.