- This model invests periodically in eight highly liquid large-cap stocks selected from those considered to be minimum volatility stocks of S&P 500 Index.
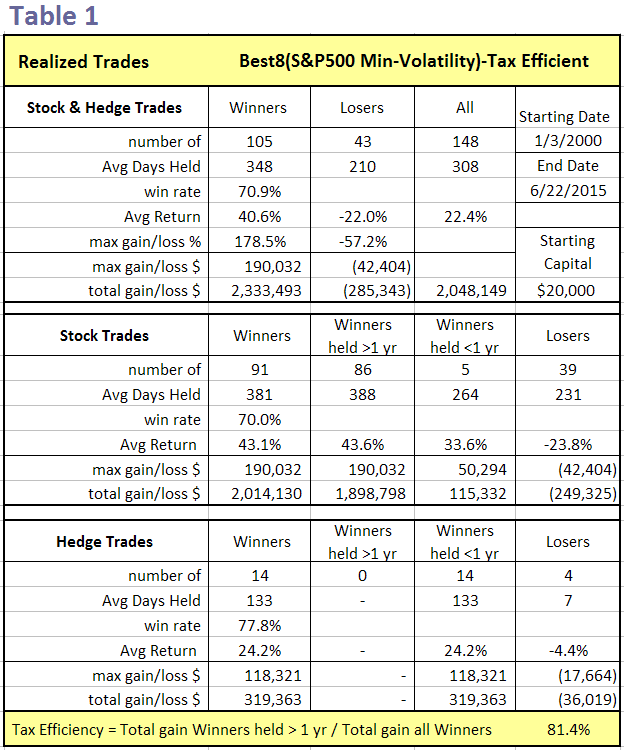
- Most stock positions are held for longer than one year, resulting in a Tax Efficiency ratio of 81.4%.
- When adverse stock market conditions exist the model shorts the 3x leveraged Ultrapro S&P500 ETF (UPRO) – hedge/current holding ratio= 45%.
- The model produced a simulated average annual return of about 36% from Jan-2000 to end of June-2015.
The Minimum Volatility Stock Universe of the S&P 500
Minimum volatility stocks should exhibit lower drawdowns than the broader market and show reasonable returns over an extended period of time. It was found that a universe of stocks mainly from the Health Care, Consumer Staples and Utilities sectors satisfied those conditions.
This minimum volatility universe of the S&P 500 currently holds 117 large-cap stocks (market cap ranging from $4- to $277-billion), and there were 111 stocks in the universe at the inception of the model, on Jan-2-2000.
The Best8(S&P500 Min-Volatility)-US Tax Efficient
This model differs from our Best8(S&P500 Min-Volatility) system with regard to the hedge used and additional sell rules to make holding periods mostly longer than one year so that long term capital gain tax rates would apply. Also a position showing a loss greater than 25% may be sold earlier. All other parameters and ranking system are the same.
Under some conditions, such as mergers, a stock will be sold and replaced. This may invoking a short term gain for tax purposes if the holding period was less than one year.
The model assumes that stocks are bought and sold at the next day’s average of the Low and High price after a signal is generated. Variable slippage accounting for brokerage fees and transaction slippage was taken into account.
Tax Efficiency of the Best8(S&P500 Min-Volatility)-US Tax Efficient
An analysis of all the realized trades is shown in Table 1. There were 91 winning stock trades of which 86 had holding periods longer than 1 year. All winning hedge trades had holding periods less than 1 year.
The Tax Efficiency was defined as the ratio of total $ gains of winners held longer than 1 year to total $ gains of all winners: 81.4% for this model.
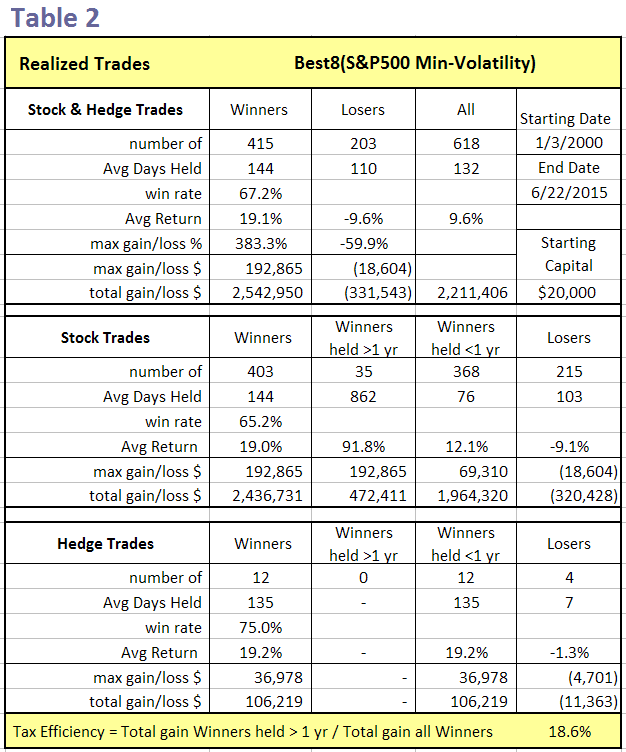
By comparison, the Tax Efficiency of the Best8(S&P500 Min-Volatility) system which trades frequently was only 18.6% as shown in Table 2. Since both models show the same annualized return of about 36% it would be more advantageous to follow the Tax Efficient system when trading outside a tax-sheltered account.
Performance
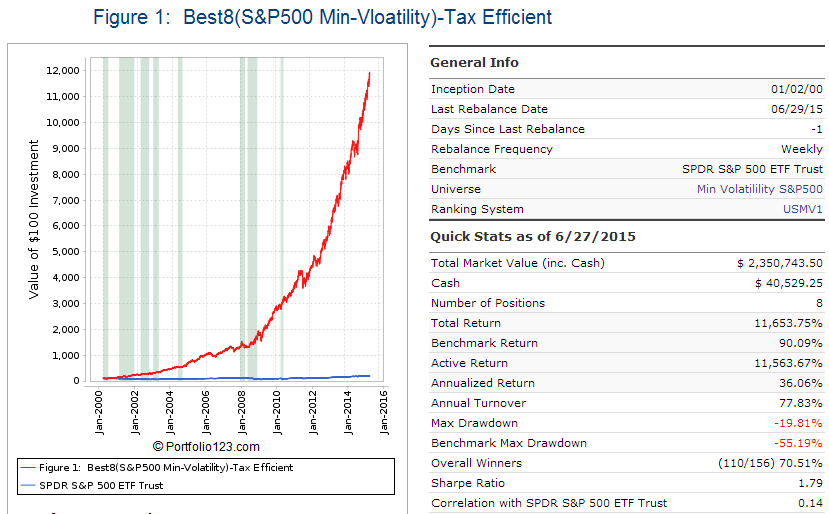
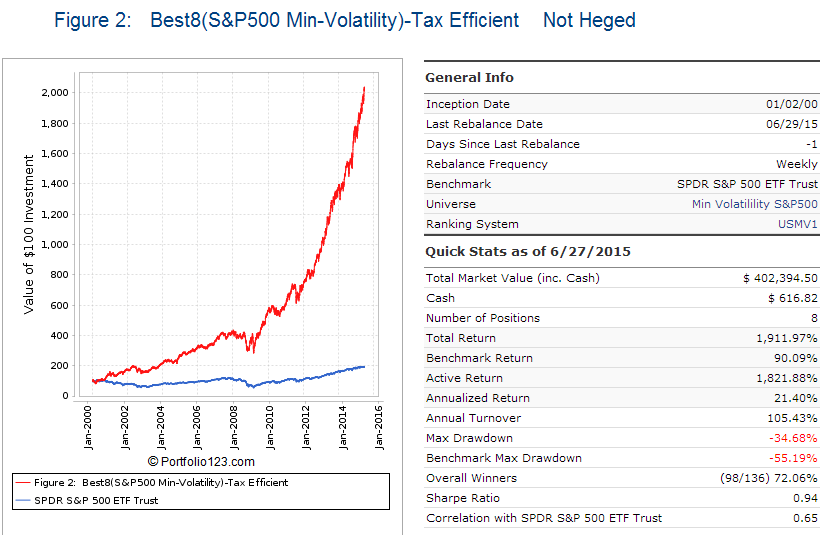
In the figures below the red graph represents the model and the blue graph shows the performance of benchmark SPY.
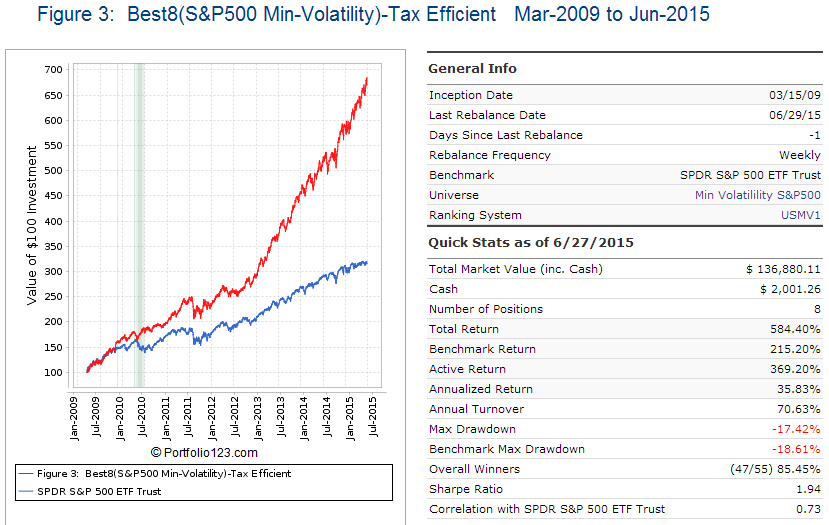
Figures 1, 2 and 3 show performance comparisons:
- Figure 1: Performance 2000-2015 and hedging with short UPRO.
Annualized Return= 36.1%, Max Drawdown= -19.8%.
The model uses a hedge ratio of 45% of current holdings during down-market conditions.
(Note: The inception date of UPRO was June 23, 2009. Prior to this date values are “synthetic”, derived from the S&P 500.) - Figure 2: Performance 2000-2015 without hedging.
Annualized Return= 21.4%, Max Drawdown= -34.7%.
The drawdown figure confirms that minimum volatility stocks perform better than the broader market which had a -55% max drawdown. - Figure 3: Performance 2009-2015 with hedging.
Annualized Return= 35.8%, Max Drawdown= -17.4%.
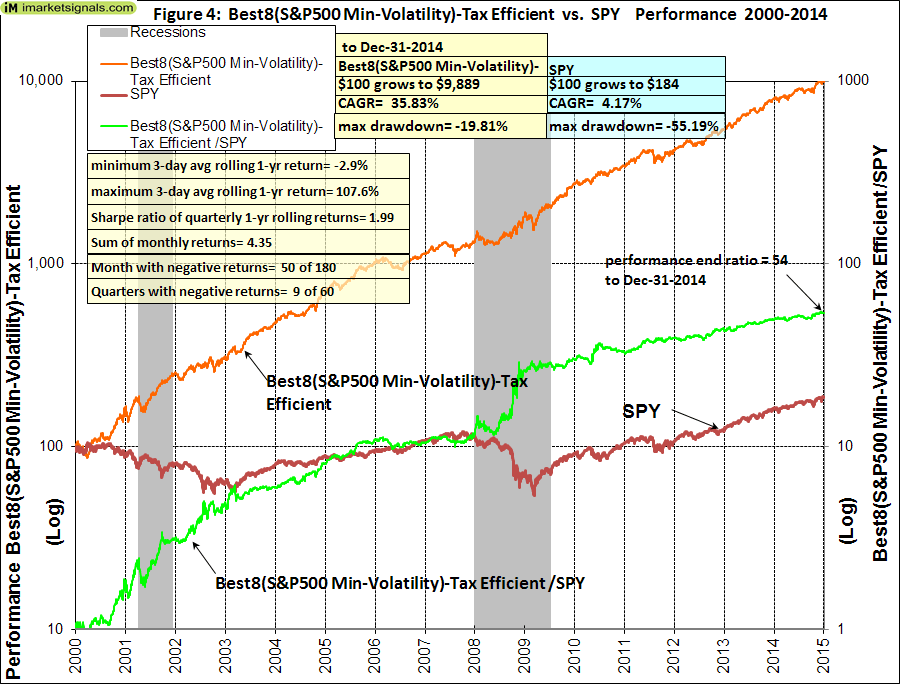
Figures 4 to 8 show performance details:
- Figure 4: Performance 2000-2014 versus SPY. Over the 15-year period $100 invested at inception would have grown to $9,889, which is 54-times what the same investment in SPY would have produced.
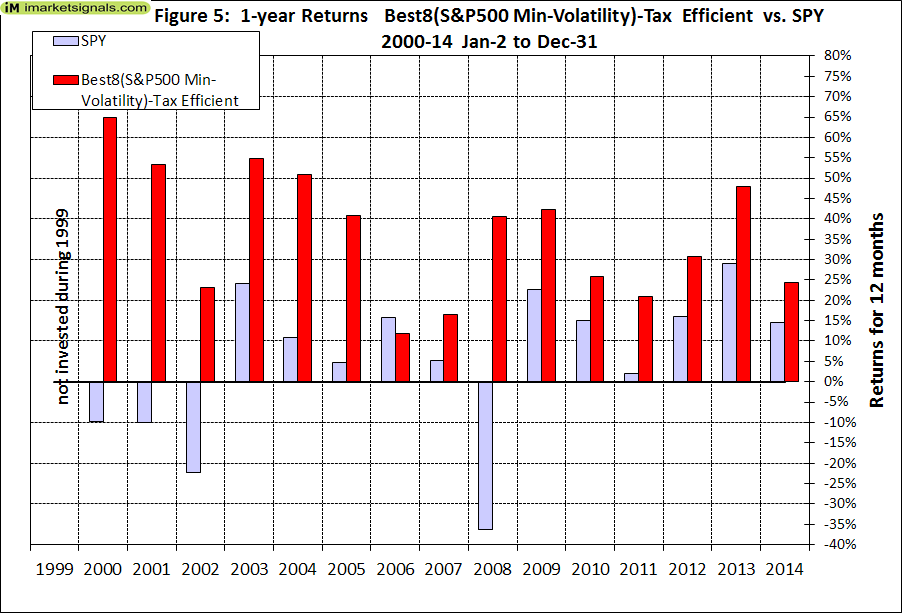
- Figure 5: 1-year returns. Except for 2006 the 1-year returns were always higher than for SPY. There was never a negative return in one calendar year.
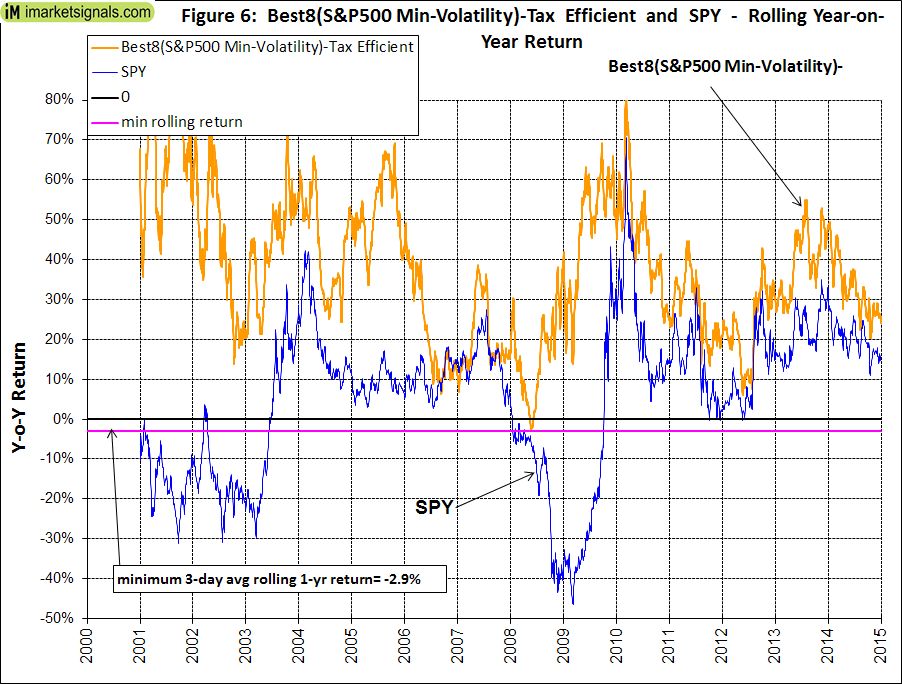
- Figure 6: 1-year rolling returns. The minimum 1-year rolling return of the 3-day moving average was -2.9% early in 2008.
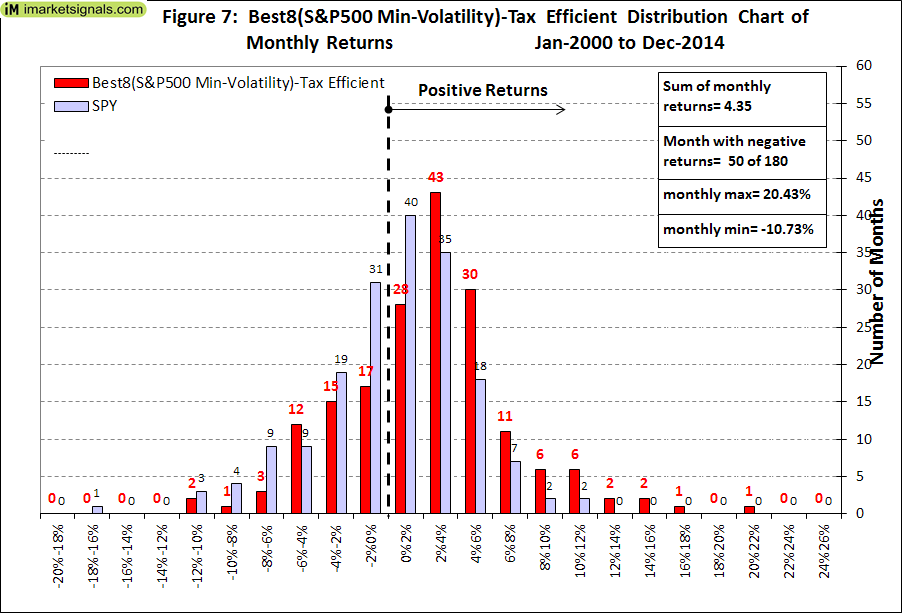
- Figure 7: Distribution of monthly returns. One can see that the monthly returns follow a normal distribution, displaced to the right relative to the returns of SPY.
- Figure 8: Risk measurements for 15-year and trailing 3-year periods.
Disclaimer
One should be aware that all results shown are from a simulation and not from actual trading. They are presented for informational and educational purposes only and shall not be construed as advice to invest in any assets. Out-of-sample performance may be much different. Backtesting results should be interpreted in light of differences between simulated performance and actual trading, and an understanding that past performance is no guarantee of future results. All investors should make investment choices based upon their own analysis of the asset, its expected returns and risks, or consult a financial adviser. The designer of this model is not a registered investment adviser.

Will this system be part of the Gold membership?
We are currently gauging interest in this model and have not made a decision whether to feature it at iM.
I’m interested. Thanks.
I am interested in this model and would like to see if offered under one of the memberships.
I’m also interested in subscribing to this model; please let me know if it becomes available.
Thanks!
I am also interested in this portfolio. Please let me know if it becomes available.
Thank you.
I am interested in this model also.
I was wondering, your other models hedge using the inverse etf’s either SH or SDS when called for. Why does this model short UPRO instead of using the inverse etf SPXU?
Can I still get the same results using SPXU?
Thank you
It hedges by shortening UPRO which does not require stocks to be sold, but a margin account is needed. One can get similar returns reducing stock holdings by 60% and investing the proceeds in SDS (long hedge). However, the tax efficiency becomes 68%, a lot less than 81.4% when hedging with short UPRO.
Georg,
What is the re-balance schedule? Yearly?
Jon
Model is rebalanced weekly.
Doesn’t a weekly rebalance negate some of the tax efficiency? Or is this negligible?
Weekly rebalance accounts for dividends received, hedging, stocks that are no longer listed, and only initiates a sell if a stock loses more than 25% from its purchase price.
After 1-year weekly rebalancing replaces stocks which have fallen in rank.
Am I correct that during “adverse” market conditions, if you had 100k current holdings you would buy 45k of UPRO?
When adverse stock market conditions exist the model shorts the 3x leveraged Ultrapro S&P500 ETF (UPRO) – hedge/current holding ratio= 45%.
No stocks are sold.
One would need a margin account to short UPRO.
I’m left a bit confused by the changes to what is in Gold and Silver levels. Best-12-Q3-Investor has been moved out of silver to gold. I’m assuming Best-8-Min-Vol is the equivalent replacement in silver (yes?).
With the Best-12-Q3-Investor, changes were made on a specific date in July, and then held for a year. Since Best-8 also has an annual holding period – is it going to have a similar date for making my annual changes?
If not, should I just buy what’s on the list in July? What about all the buy/sell listed to Best-8 over the past few months – are those trades I should or should not be doing (after I move from Best12 to Best8)? Or were those stop-loss trades that fit into the annual hold process?
I’m extremely confused as to what I should do. I’m also seeing unusual tickers in the Best-8 history (like LO^15 and CFN^15). What the heck are those?
Could you please explain how silver subscribers who were following Best-12-Q3 should proceed?
In an effort to add more value for silver members we moved Combo3 and added the Best8(S&P500 Min-Volatility)-Tax Efficient as replacement for Best12(USMV)Q3-Investor to the silver section.
The Best12(USMV)Q3-Investor model was removed from silver as it is not a stand-alone model, but is a sister model of the group Q1+Q2+Q3+Q4. On Jul-6 this model replaced 7 of its 12 stocks which was still communicated to silver members. On Jul-20 it sold a further 2 stocks: CAH and ROST and bought: ANTM and DTV. So far it has replaced 9 of its 12 holdings. On Aug-3 it may trade again. If so, we will report this also here in the comment section. From then on silver members who wish to follow this model should upgrade to gold.
Best8(S&P500 Min-Volatility)-Tax Efficient has a different trading pattern than Best12(USMV)Q3-Investor. When buying all the current holdings of Best8 one would have to accept that some of those may be sold earlier than one year from now. What is right for your situation may be very different from others, so you may want to ask your adviser as to what to do
I do appreciate that Best8 is included in the Silver pkg. The more I read about it – the more I like it, especially hedging through margin – which means the stocks are not sold.
Plus, for me, the fewer stocks held (8 vs 12) the better.
By popular request we reversed our earlier decision that Best12(USMV)Q3-Investor requires Gold membership. This particular model can now again be followed with a Silver membership.
AGN.2^15 is an even better example of the tickers listed. What is AGN.2^15? Google shows that as being a “Spatially Resolved Molecular Inflow” – not a ticker tsymbol.
^15 indicates that the stock stopped trading in 2015. Possibly due to merger or the company going private going private.
What would AGN.2 be? I see that Allergan is breaking up into two businesses. Could the .2 have something to do with that? You can’t find AGN.2 by using ticker search on Yahoo Finance.
These particular symbols of inactive stocks come directly from P123 and one would not find them at Yahoo.
I’m beginning to realize that Best-8 differs from Best-12 in that there’s no hard buy/sell dates (july for Best12=Q3) – but I guess the idea is to keep stocks for a year or more (or there would not be tax efficiency). But it begs the question – is there a minimum holding period for Best8? When does the holding period begin and end? How does it work in Best8?
For the sake of discussion – If I switched to Best8 now – would I be jumping in mid-stream? Would the sell period come, say, 6 months from now and I’d be paying short term taxes on any gains?
How does Best8 work?
The start date of the simulation for Best8 is 1/2/2009. The minimum holding period is 1 year unless the price of a stock loses more than 25% from its buy price. Currently the longest holding period is for CAH, which has been held for 459 days. The shortest holds are for CI and PEG, 53 and 60 days, respectively.
If you jumped in to Best8 now and bought all the stocks, then it is possible that some of the stocks may be sold earlier than 1 year from now.
Georg,
Can you elaborate on the criteria this model uses to determine “adverse market conditions”? I’m trying to get a feel for how much correlation exists between this model and some of the others you offer such as Combo3 or the Vang models using the MAC-US Moving Average ratios.
Thanks,
Jon
This model uses, in addition to other criteria, a moving average cross over system of the benchmark to determine when to buy and sell stocks. The system is more refined than that of the MAC-US.
Because Best8 focuses on the Healthcare, Consumer, and Utilities sectors – and those have been 3 of the best performing sectors over the last 10 years – wouldn’t it stand to reason that back-testing a portfolio with those names would have superior results?
Healthcare has been the #1 sector of the past 10 years. Consumer #2 and Utilities #4.
Stated above, Best8’s formula is to rely on “a universe of stocks mainly from the Health Care, Consumer Staples and Utilities sectors.” Right now those 3 sectors dominate the portfolio: Healthcare (CAH, CI, HCA, UHS), Consumer (ADM, CCE, TSN) and Utilities (PEG).
Utilities – usually a pretty dull sector powered strictly by dividends – have benefited from lower and lower interest rates over the past decade – but that could change dramatically in the future.
Is it reasonable to assume that results going forward will be as robust as the past 10 or 15 years?
What I’m really getting at is the word “mainly.” Could Best8 change it’s focus from “mainly” Healthcare, Consumer, and Utilities if those sectors begin to greatly lag – and change to other sectors in the Minimum Volatility Universe?
How restricted is the Best8 formula to those three sectors?
And please, don’t take the above post as a criticism. I love the basic structure of Best8. I appreciate that – unlike the Best12 Q3 Investor – you’re not turning over the entire portfolio (or most of it) every calendar year. Best 8 is more gradual.
I am interested in investing in Best8 instead of Best12, but I’m wondering if a broader sector focus might be a better idea in the long term.
As far as I can tell Best12 has no sector restrictions.
I just want to know what I’m getting into – because I’d like to stick with the investment plan for 20 or 30 years, if you guys are still offering it.
I’m also wondering if Best8 will stay in the Silver category from now on. Or could it possibly be switch to Gold sometime in the future.
What is in Silver will stay in Silver.
Best12(USMV)Q3 is a component model of Q1+Q2+Q3+Q4 and not a stand-alone model and has a specified Sector Weight < 30%. Best8(S&P500 Min Volatility)-Tax efficient focuses on the Healthcare, Consumer, and Utilities sectors only. All your comments are valid, utilities may not be a good bet in the future, but the ranking system should recognize this. This model will not rotate into different sectors if the current ones' should become less attractive.
Thanks for your quick reply. I appreciate the work you’re doing.
Yes, I would like to know this as well. It seems the Best 12 would be more robust going forward as sectors go in and out of favor, providing of course that all back test data for Best8 was actually only derived from Healthcare, Consumer, and Utilities. Georg, please clarify this.
Thnx,
Never mind:).
The current table shows 8 stocks invested on the main page. How are “adverse stock market conditions” signaled in this table? Is it simply a comment saying “hedge now” or something to that effect? And then another comment indicating the reverse when market conditions turn favorable? In the non-hedged case, is the general rule to reduce all current 8 holdings by 60% and apply that amount to SDS during these conditions?
When adverse stock market conditions exist the model shorts the 3x leveraged Ultrapro S&P500 ETF (UPRO) – hedge/current holding ratio= 45%.
When this hedge is initiated the table will indicate this. Holdings are not reduced. When the short position is covered this will also be communicated.
I’m confused about how you communicate when the hedge is on or off for Best 8 Min-Vol. Right now on the main page it says the 45% short UPRO is currently “on.” But the most recent signal that’s noted in the scroll-down was hedge “off” on 12/28/15. Which is it?
The model entered the hedge on 5/9/2016 see https://imarketsignals.com/wp-content/uploads/2016/05/Fig-14.Best8TaxEff-5-10-2016.png.
The table on the site will be corrected. Thank you for raising this discrepancy.