
Using 3 large-cap models from the web-based trading simulation platform in combination with Best(SPY-SH) and Best1(Sector SPDR), we demonstrate that the combination would have produced very high positive rolling returns and also high annualized returns with low drawdowns and low volatility. Additionally this combination model, due to the very high liquidity of its large-cap stocks, could easily support a total portfolio size of about $100-million.
Combo Mode Performance
The component models and their percentage weights in the combination are listed below:
- 20% Best(SPY-SH): Switches between SPY and SH.
- 10% Best1(Sector SPDR): Switches between Select Sector SPDR and SH.
- 40% Model A: Holds stocks from the S&P 500.
- 10% Model B: Holds large/med-cap stocks from the S&P 1500.
- 20% Model C: Holds DJIA stocks.
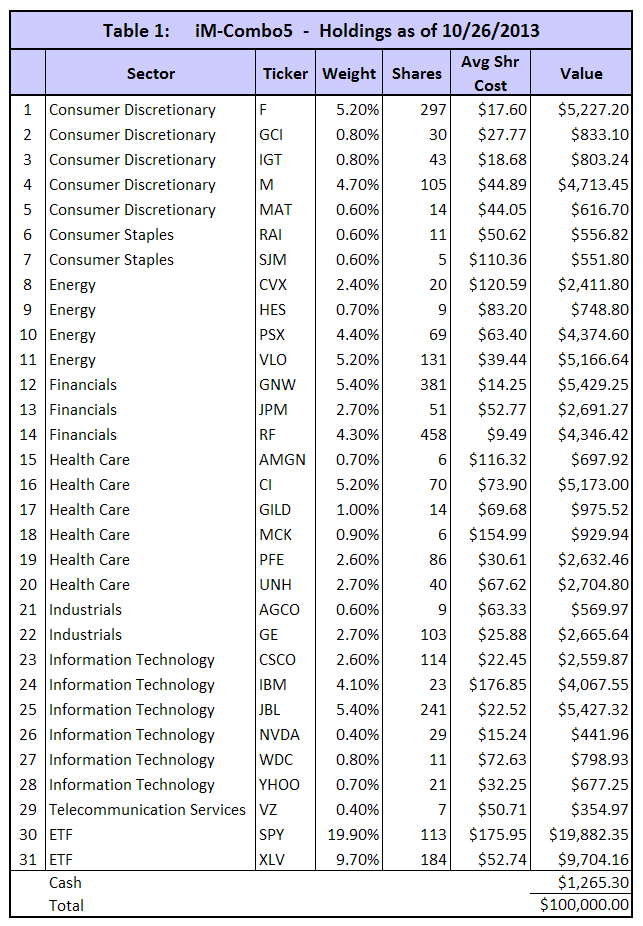
The current holdings for a portfolio value of $100,000 are listed in the Appendix.
None of the above models sell short or use margin. This combination model is therefore always trading long, and has an average annual turnover of about 500%.
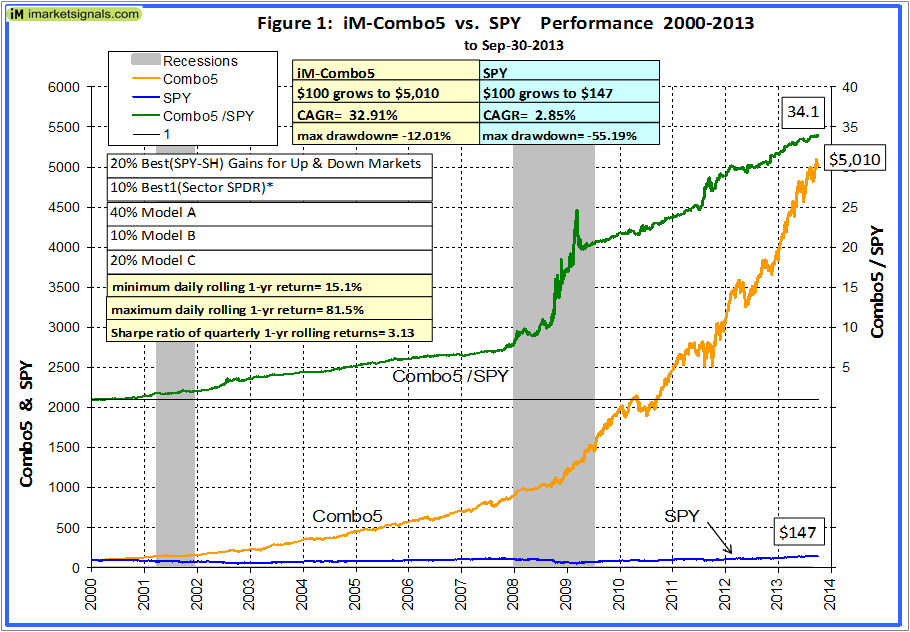
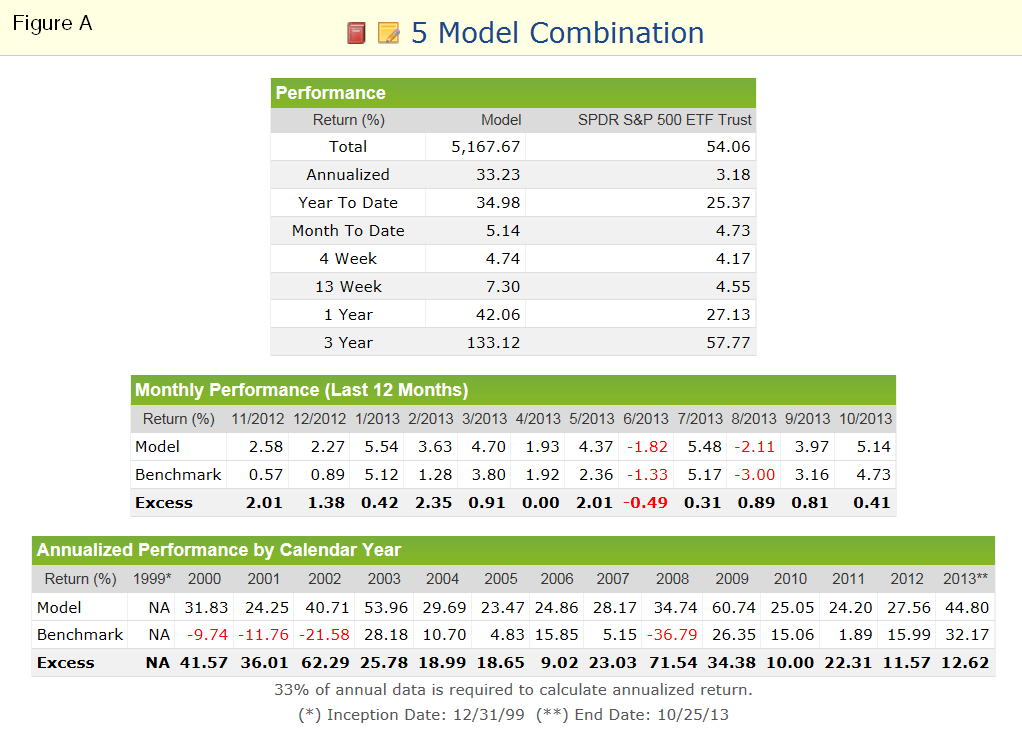
The combination, Combo5, would have produced, an annualized return of 33% with a maximum drawdown of only -12% as shown in Figure 1. The in-between-recession segments of the ratio graph Combo5 to SPY are almost straight lines with a constant upward slope, indicating that Combo5 consistently out-performed SPY.
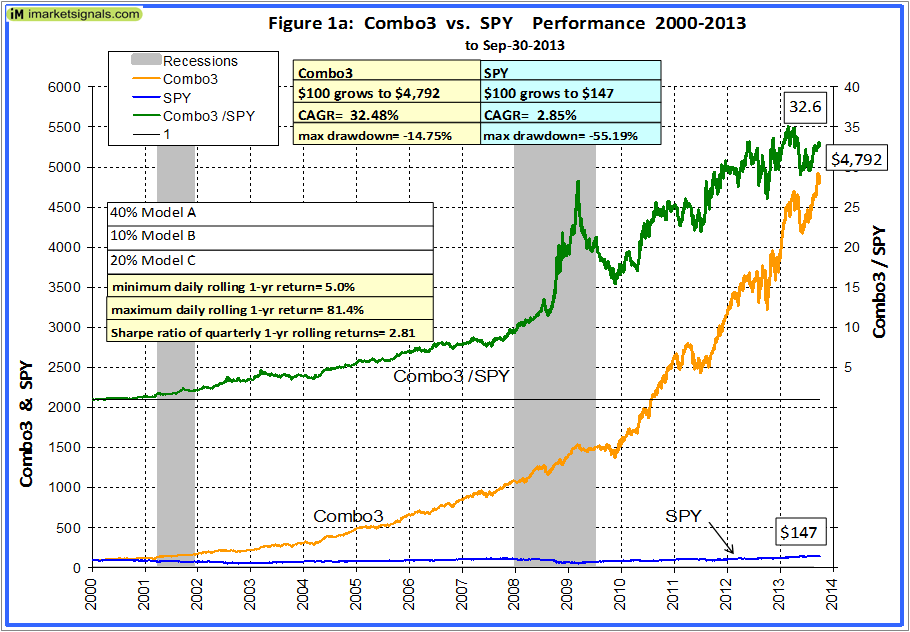
Had one left out the ETF models Best(SPY-SH) and Best1(Sector SPDR), then the annualized return for the resulting 3 model combination, Combo3, would have been 32.5% with a maximum drawdown of -14.8%, as shown in Figure 1a. This is almost the same as Combo5’s return, but with a somewhat worse drawdown. However, the ratio graph Combo3 to SPY shows the undesirable erratic performance of Combo3 without the stabilizing effect of the ETF models.
 (click to enlarge)
 (click to enlarge)
Annual Returns
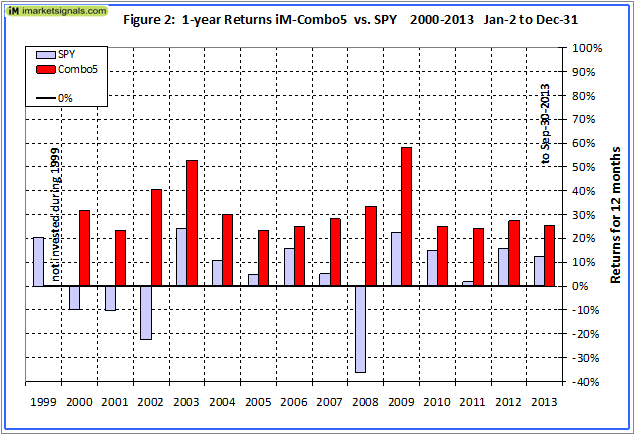
Figure 2 shows the annual returns for Combo5. Note that the variation between returns is relatively low. The average annual return was 32.1%, the lowest was 23.5% and the highest 58.1%, resulting in a high Sharpe ratio of 3.0.
Combo Mode Rolling Returns
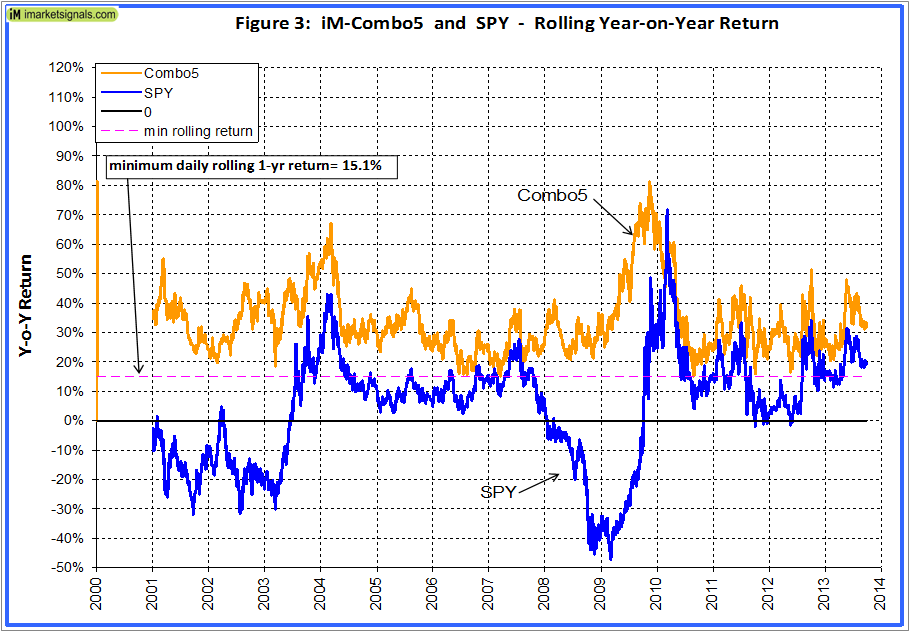
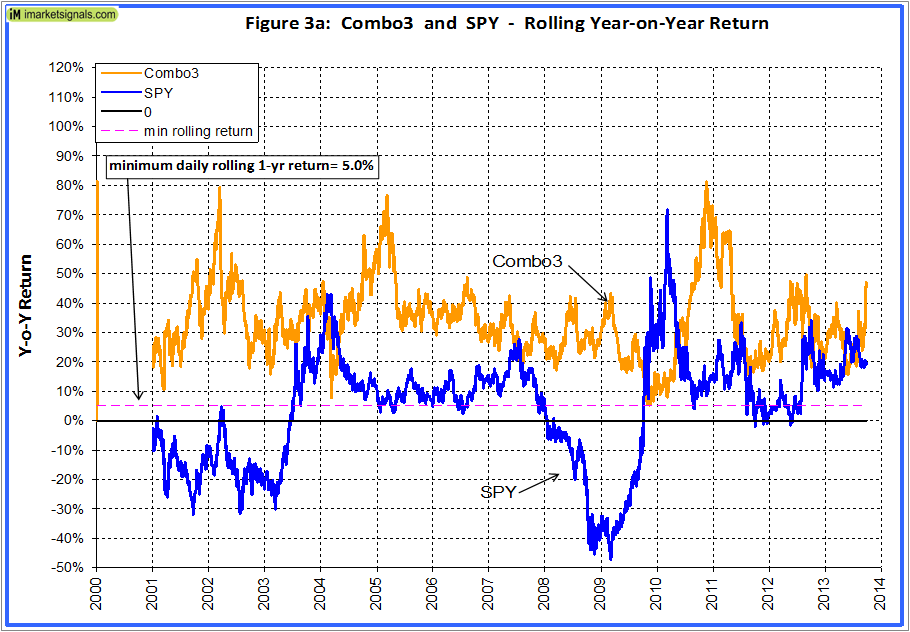
Figure 3 shows the rolling 1-year returns starting each trading day from 2000 to 2012. For Combo5 the lowest return was +15.1%. The rolling returns were always greater than for SPY, except for 2 weeks in March 2010. For rolling 1-year returns starting every 3 months the Sharpe ratio was a high 3.13, indicating that the returns were consistently of similar magnitude.
Without Best(SPY-SH) and Best1(Sector SPDR) in the combination, then as shown in Figure 3a, the lowest rolling return for the resulting Combo3 would have still been a positive 5.0%, but the rolling returns in 2004 and 2009-10 would have been considerably lower than the ones for SPY.
 (click to enlarge)
 (click to enlarge)
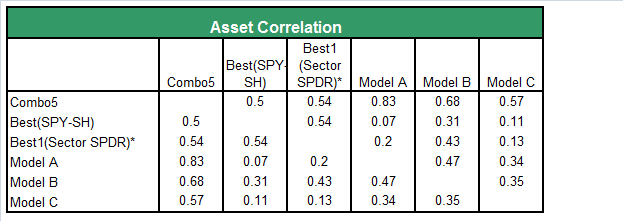
Correlation
From the table below it is evident that the 5 assets in the combination have a low correlation to each other. From a portfolio construction standpoint, the combination should be more robust than any single system on its own.
Risk Analysis
Note that the risk measurements for the combination are better than for any of the individual models, indicating that the combination should be more robust than any single system on its own. Particularly the low drawdown and high Sharpe- and Sortino Ratios for the combination are noteworthy.
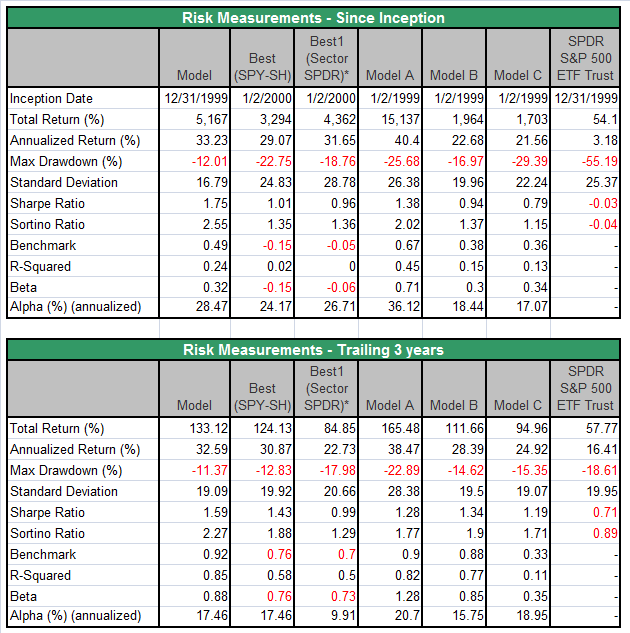
Performance Statistics from 1/2/2000 to 10/25/2013
 (click to enlarge)
Distribution of Monthly Returns from 1/2/2000 to 10/25/2013
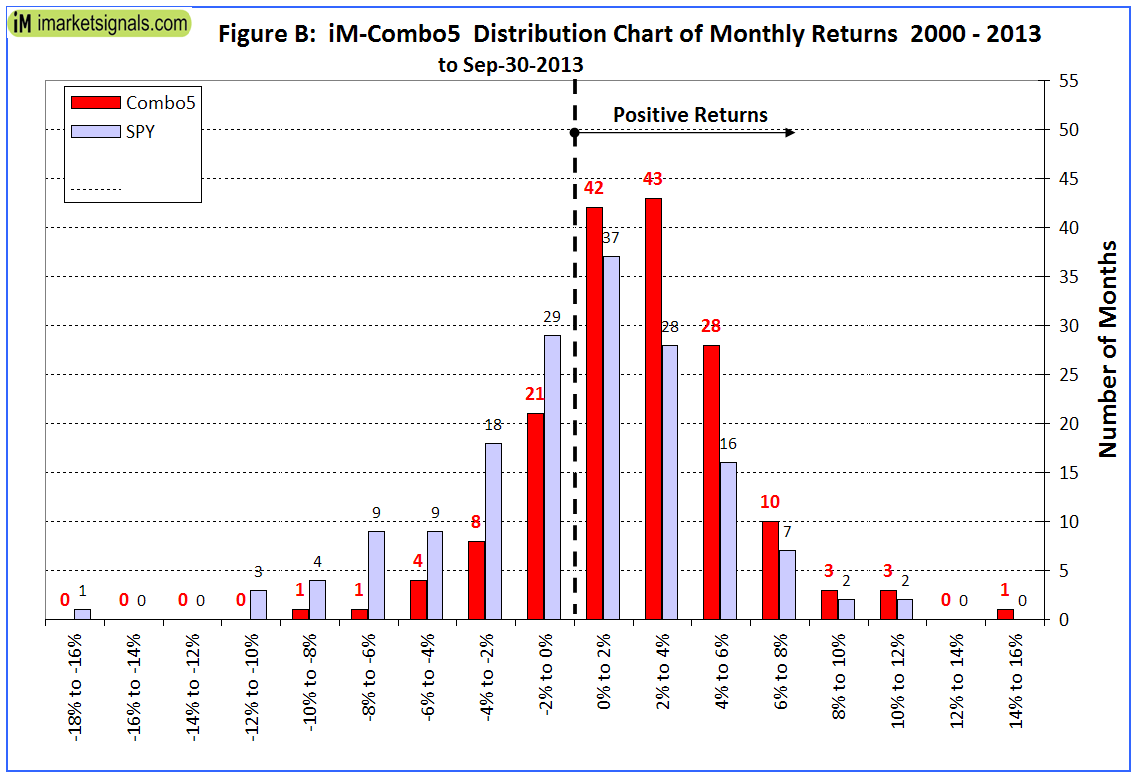
There were a total of 165 months in the period under consideration. Combo 5 produced positive returns during approximately 130 months with only about 35 months of negative returns, as is evident from the chart above.
Portfolio Size
The maximum portfolio size is dependent on the liquidity of the stocks and ETFs in the model. The ETFs have huge liquidity and will not place a constraint on portfolio size. To calculate the maximum size a portfolio can handle without incurring too much slippage the following formula is recommended:
($LiquidityBottom20Pct * #Position * 5%) / WeeklyTurnover%
where 5% is the maximum amount traded without affecting the stock price.
Model A has the lowest liquidity of the bottom 20 Pct, and is thus the critical model in the combination. Model A represents 40% of the total portfolio.
$LiquidityBottom20Pct = $16MM
#Positions = 8
Annual Turnover% = 880%
WeeklyTurnover% = 16.9%
Max Port Size for Model A= ($16MM * 8 * 5%) / 16.9% = $37.8MM
Maximum Portfolio Size Combo5= $37.8MM / 0.4= $94.5MM, say $100MM.
Thus, this combination model could easily accommodate 100 investors with a $1,000,000 portfolio each, or 1,000 investors with a $100,000 portfolio each.
Appendix: Holdings for a portfolio size of $100,000.
Are you gonna reveal models A,B and C?
Vitaliy
We have to discuss this with the authors of the other models first before we can make a decision on this.
Thanks for the excellent work. Will you be publishing the portfolio so we can follow it easily?
We have not decided this. We will have to talk to the authors first.
Also we have taken the third party models in good faith and the article is written how our two models can be combined with other trading strategies. However, as we do not know, nor understand, the algorithms that these models have adopted we are hesitant to reveal the models as this may be interpreted as an endorsement which we cannot give under this lack of knowledge.
I´m interested in this combo…………..if you admit suscribers count me on!
Unfortunately you cannot directly subscribe to Combo5. We will also not publish the signals since the majority of them come from third party models and we have no authority to re-publish them.
In order to trade this model you have to subscribe to all 5 component models. If you want to have the signals combined according to their weight in Combo5, and transmitted to you by automated email, then you need to have a professional membership at P123 which allows 5 component models (assets) in a book (combo).
But it is easy enough to do the calculation yourself as to how many stocks to trade by applying the respective percentage weights to the signals for each individual model.
In reply to the above comments, and the many requests received by email, we have published the iM-Combo5 components here.