
A previous study found that a dynamic asset allocation strategy with Vanguard index funds produced better returns than models with static asset allocations. Changing asset allocation according to stock-market climate produced much higher returns with less risk. TIAA-CREF’s variable annuity accounts can similarly be used to improve returns for participants. Results for three models with dynamic asset allocation are provided whose performance and risk measurements are all better than those of the variable annuity accounts alone, or static combinations of those accounts.
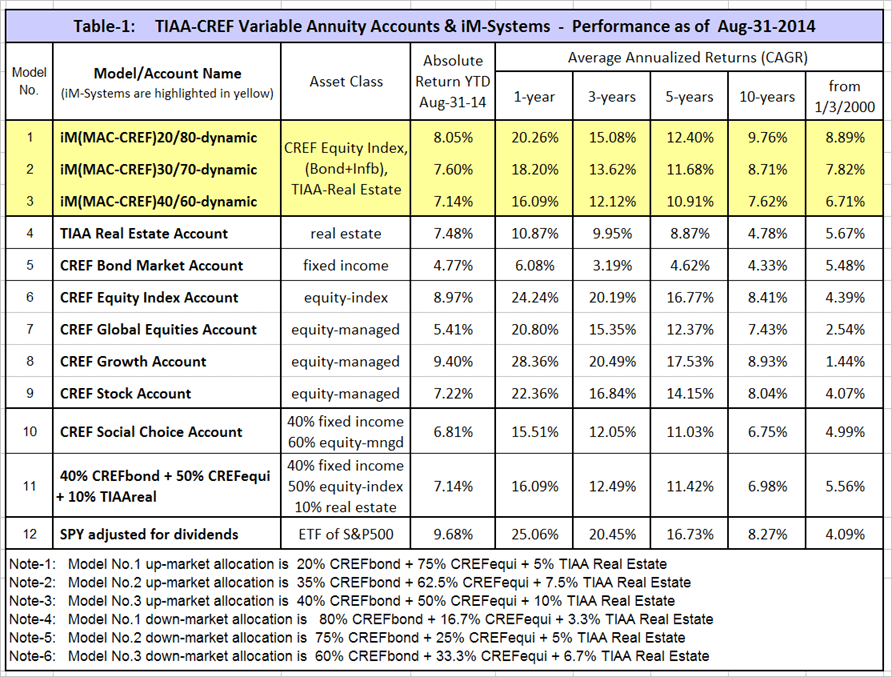
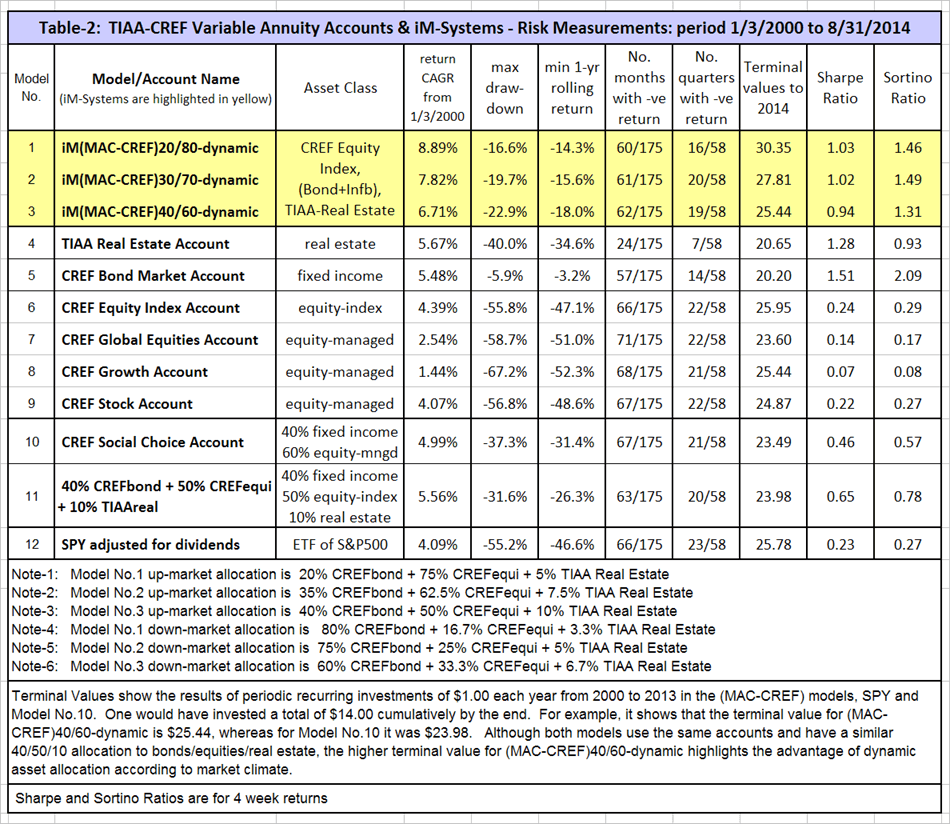
In the Appendix, Table-1 lists 15-year performance comparisons, and Table-2 provides risk measurements for the various accounts and models. The reader may find Table-2 of particular interest as risk measurements are not provided by TIAA-CREF for any of their annuity accounts or funds.
Variable Annuity Accounts used
It is evident that the CREF Equity Index Account (CREFequi) shows the highest performance and best risk measurements of all the CREF equity accounts (models No.6 to No.9), and was therefore selected as the equity component for the dynamic asset allocation models, together with the CREF Bond Market Account (CREFbond) and TIAA Real Estate Account (TIAAreal).
A better investment strategy: iM(MAC-CREF)20/80-dynamic
This model (No.1) shows the highest performance with least risk. However, some stock-market timing is required. Nominal asset allocation is:
- Allocation during up-market periods: 80% stocks and 20% bonds. (75%CREFequi, 5%TIAAreal, 20%CREFbond)
- Allocation during down-market periods: 20% stocks and 80% bonds. (16.7%CREFequi, 3.3%TIAAreal, 80%CREFbond)
Note: The exact composition for the three models during up- and down-market periods is given in the Notes at the bottom of Table-1 and Table-2.
Figure-1 charts the performance for the (MAC-CREF)20/80-dynamicmodel and SPY over almost 15 years. An initial investment of $100 in the dynamic model would at the end have grown to $340, twice as much as same investment made in SPY.
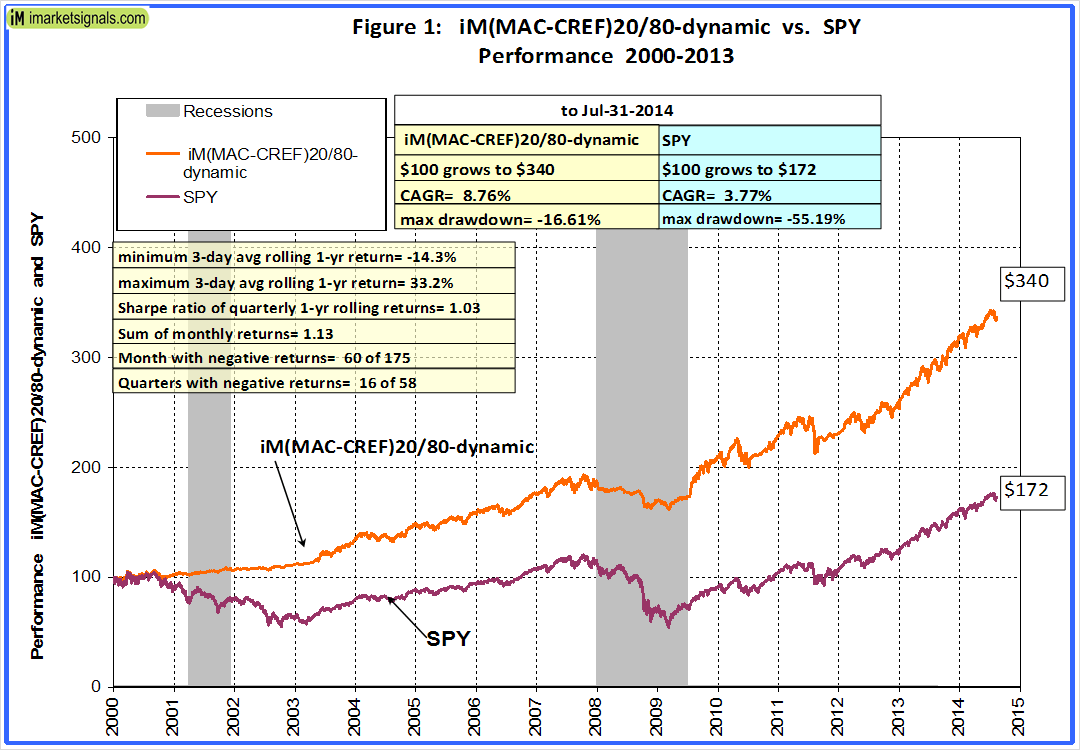
From 1/3/2000 to 8/31/2014 this model’s average annual return would have been 8.89% with a Sharpe Ratio of 1.03, whereas the managed $129-Billion CREF Stock Account’s average annual return was only 4.07% with a much lower Sharpe Ratio of 0.22, indicating that the lower performance was also associated with more risk. In contrast, the lower performance of the CREF Bond Market Account was achieved with less risk, as indicated by the higher Sharpe Ratio of 1.15.
Model No.11 provides results for the usual recommended static asset allocation of 40%/50%/10% bonds/stocks/real-estate. Returns and risk measurements indicate this to be a better investment strategy than equities or bonds alone, but the three dynamic asset allocation models (No.1 to No.3) all show better performance with less risk.
To simulate savings over time, terminal values to May-31-2014 of recurring annual $1.00 investments made on Jun-1 from 2000 to 2013 are provided in Table-2. One would have invested a total of $14.00 cumulatively by the end. It shows that for the dynamic (MAC-CREF)20/80 model the terminal value of these recurring investments would have been $30.35. The highest terminal value obtainable from any of the variable annuity accounts, or any combination of them, was $25.95 for the CREF Equity Index Account.
Rebalancing
The nominal asset allocation is maintained by rebalancing every 12 months, at the end of December. The last rebalance occurred on Dec-31-2013, and the asset allocation for (MAC-CREF)20/80-dynamic as of Aug-29-2014 is:
- 19.4% CREF Bond Market Account
- 75.6% CREF Equity Index Account
- 5.0% TIAA Real Estate Account
Market Timing
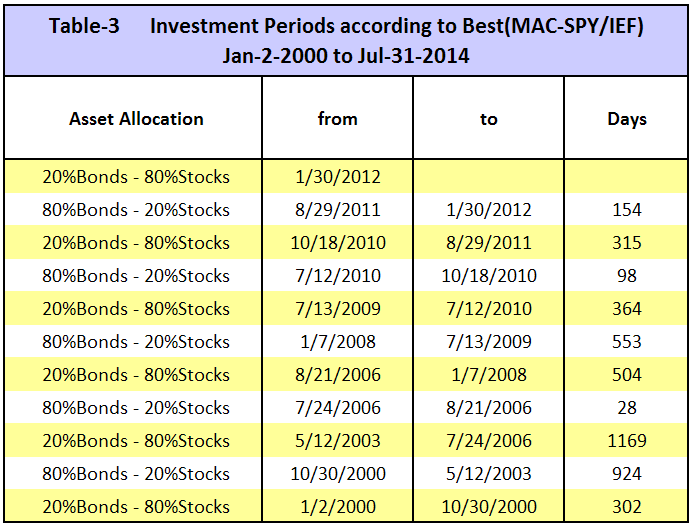
The up- and down-market periods come from the MAC-System (backtested over 65 years), also modeled as Best(MAC-SPY/IEF) on the web-based simulation platform P123 from 2000 onward. Transaction dates are not exactly the same as those for the MAC-System, because P123 trade dates are determined with end of the week prices, and transactions only occur on the first trading day of the week. From 2000 to 2014 the model signaled only 5 down-market periods and 6 up-market periods, including the current up-market period; they are listed in Table-3 in the Appendix.
TIAA-CREF discourages market timing for the variable annuity accounts: “…if, within a 60-calendar day period, a participant redeems or exchanges any money out of an account, subsequently purchases or exchanges any money back into that same account and then redeems or exchanges any money out of that same account, the participant will not be permitted to make electronic transfers (i.e., transfers over the Internet, by telephone or by fax) back into that same account through a purchase or exchange for 90 calendar days.”
Shifting investments on the MAC signal dates listed in Table-3 would not have been considered market timing by TIAA-CREF according to the above rule, which requires two consecutive investment periods to be 60 days or less for it to become into effect.
Conclusion
Whether saving for retirement, or receiving income from a variable annuity, participants can move their investments among the variable annuity accounts to maximize their return. The historic performance and risk measurements listed in Table-1 and Table-2 clearly indicate that all managed equity accounts should be avoided as they have all under-performed the equity index account over the last 15 years. It is unlikely that their managers will produce better returns in the future.
Investors in TIAA-CREF variable annuity accounts can achieve good returns with less risk by following a simple market timing strategy to decide on the asset allocation for their investment. A dynamic asset allocation strategy dependent on stock-market climate is the key to better returns. There is no need to invest in many accounts, only the CREF Equity Index Account, CREF Bond Market Account, and TIAA Real Estate Account are required.
Signals for up- and down-markets are from the MAC-US model which can be found at iMarketSignals.com where it is updated every Friday, and can be viewed at no cost from the following Monday evening onwards.
Georg –
I like this series (Vanguard & TIAA-CREF), But I was trying to figure out why the more conservative allocations had lower returns and larger drawdowns – doesn’t seem to make much sense for more conservative allocations. Then I realized the down market allocation is just the inverse, which gives the more conservative up market portfolio a bigger down market equity allocation.
I like the 80/20 and it’s inverse, but I might suggest trying the 70/30 up market allocation with 10/90 down market allocation and a 60/40 up market allocation with 0/100 down market allocation. This should match up the risk profiles a bit better.
Another option would be to pair the each various up market allocations (60/40,70/30,80/20,90/10,100/0) with the same 0% (or maybe 10%) equity allocation during down markets. This would also work nicely with the Vanguard portfolios, too.
Just my 2 cents. Thanks!
– Joel
Joel,
Thank you for your suggestions to improve returns. Obviously, if one assumes that MAC will always correctly indicate up- and down-market periods then the best allocation model would be 100/0. However, if MAC signals wrongly then a 60/40 model would be better.
So it depends on an investor’s risk tolerance which asset allocation to follow. I chose the 60/40, 70/30 and 80/20 allocations to match the allocations of the 6 Vanguard LifeStrategy funds. Investors can simply switch between those funds according to the MAC model’s signals and need not bother to invest in the individual index funds I used to demonstrate the positive effect of dynamic asset allocation. Using LifeStrategy funds would have provided somewhat lower returns probably because they include international funds as well.
Hello Georg,
I am new to your site and I like your TIAA-CREF signals very much. The MAC signals seem very effective. They are simple enough, but not simpler – as goes a famous quote.
-Tom
Tom, glad you like the site. If you have an account at TIAA-CREF you may also be interested in the TIAA Real Estate Account. We update the performance every month, which currently is over 11% yoy.
Hi there. My wife and I have sizeable positions in TIAA-CREF. We’re probably about 30% to 50% in TC Real Estate. We’re in our mid to late fifties. After 2009, we prefer a bit of caution, although we dollar cost averaged throughout the 09 Recession. Is the allocation in TC real estate too heavy in your opinion?
We are not Financial Advisers and can’t give an opinion regarding your personal situation. Currently the TIAA Real Estate Account is returning about 6% yoy with very little volatility.