
Weekly Updates
April 3, 2026
Bond-market:
To view this premium content requires membership category: Bronze or higher. However, it can be freely viewed after 05-01-2026 16:00 (New York), or please login or register
The Yield Curve:
To view this premium content requires membership category: Bronze or higher. However, it can be freely viewed after 05-01-2026 16:00 (New York), or please login or register
Silver:
April 3, 2026
Stock-markets:
To view this premium content requires membership category: Bronze or higher. However, it can be freely viewed after 04-06-2026 16:00 (New York), or please login or register
To view this premium content requires membership category: Bronze or higher. However, it can be freely viewed after 05-01-2026 16:00 (New York), or please login or register
To view this premium content requires membership category: Bronze or higher. However, it can be freely viewed after 05-01-2026 16:00 (New York), or please login or register
To view this premium content requires membership category: Bronze or higher. However, it can be freely viewed after 04-06-2026 16:00 (New York), or please login or register
Recession:
April 2, 2026
iM-Business Cycle Index
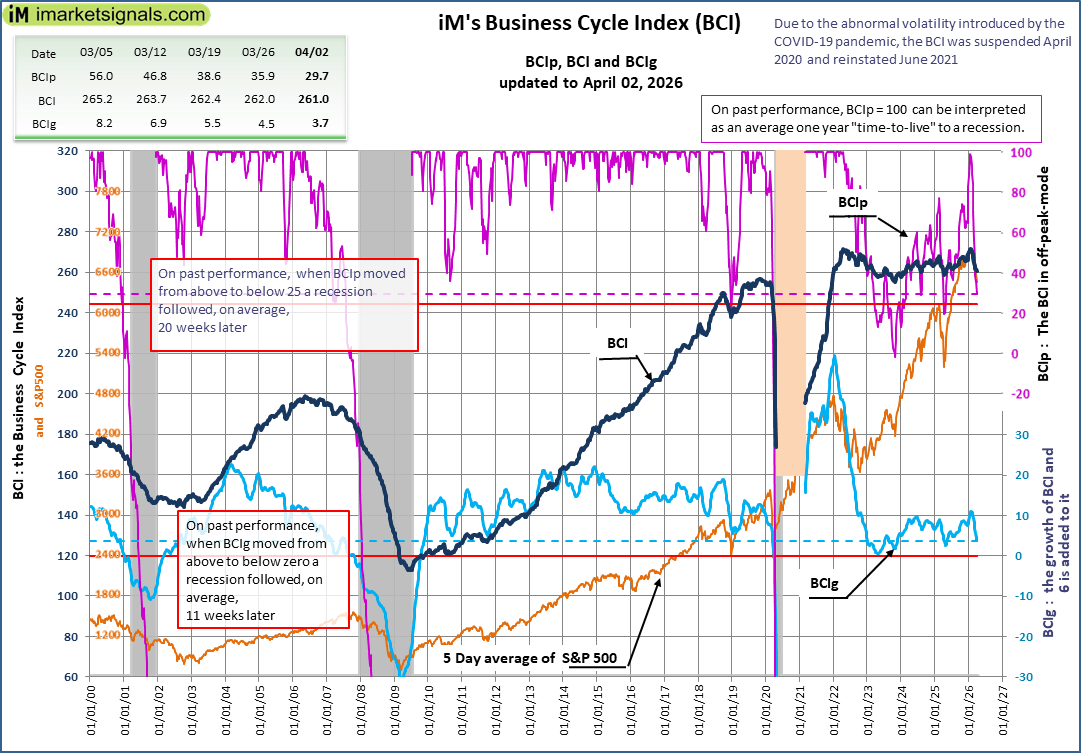
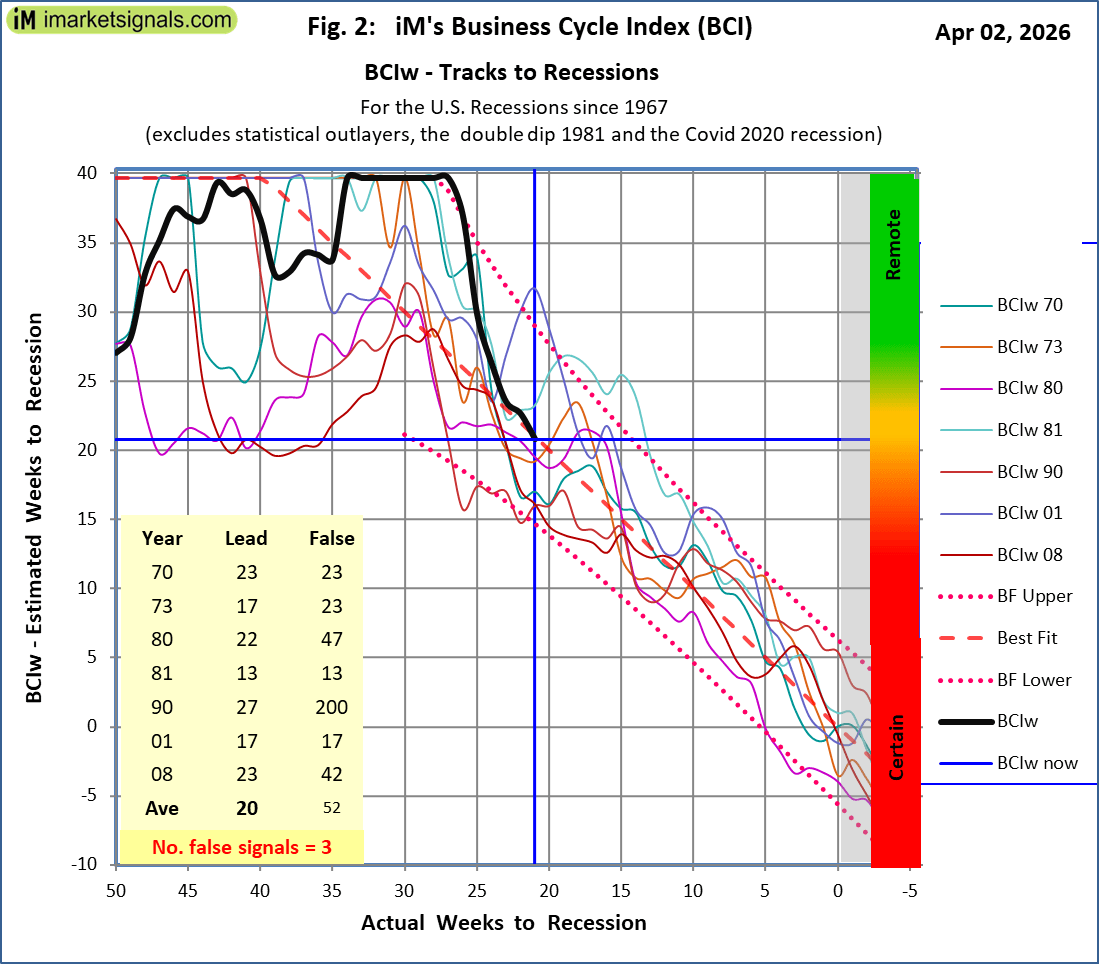 The BCI is not signalling a recession
March 17, 2026
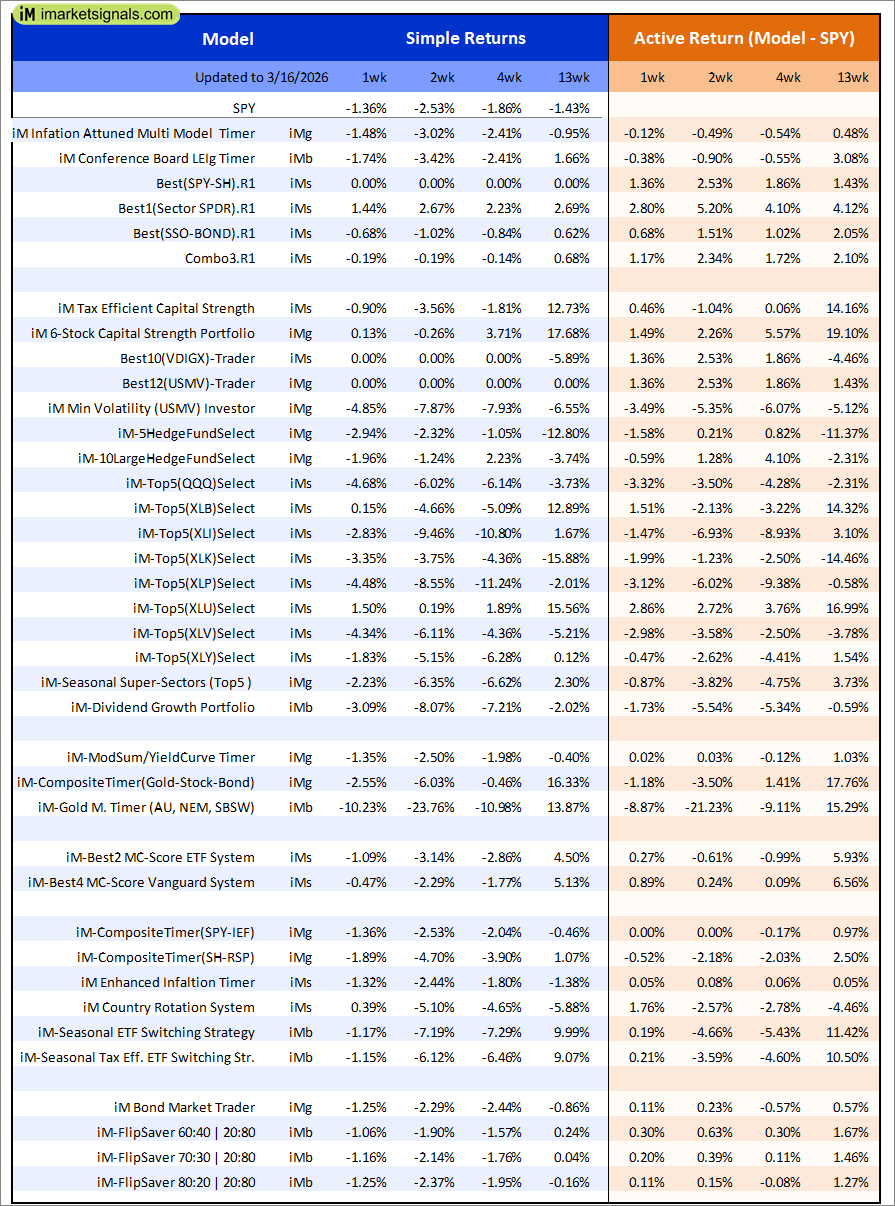 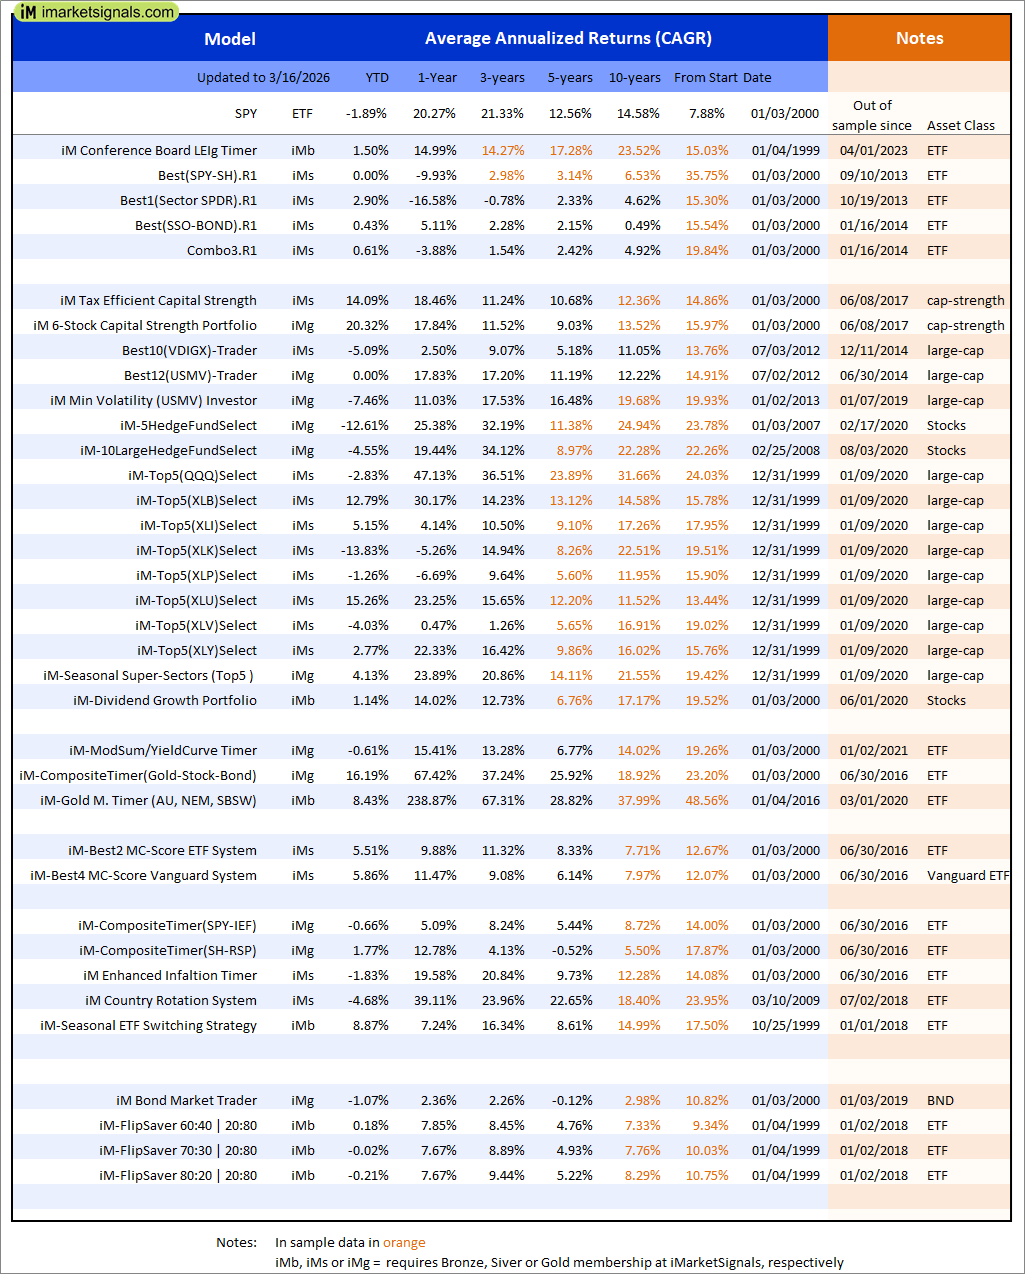 |
Out of sample performance summary of our models for the past 1, 2, 4 and 13 week periods. The active active return indicates how the models over- or underperformed the benchmark ETF SPY. Also the YTD, and the 1-, 3-, 5- and 10-year annualized returns are shown in the second table |
 |
iM-Inflation Attuned Multi-Model Market Timer: The model’s out of sample performance YTD is -1.2%, and for the last 12 months is 14.5%. Over the same period the benchmark SPY performance was -1.9% and 20.3% respectively. Over the previous week the market value of the iM-Inflation Attuned Multi-Model Market Timer gained -1.48% at a time when SPY gained -1.36%. A starting capital of $100,000 at inception on 3/24/2017 would have grown to $151,219,555 which includes $1,073,065 cash and excludes $4,103,439 spent on fees and slippage. |
|
|
iM-Conference Board LEIg Timer: The model’s performance YTD is 14.3%, and for the last 12 months is 7.3%. Over the same period the benchmark SPY performance was 20.1% and 9.4% respectively. Over the previous week the market value of the iM-Conference Board LEIg Timer gained -1.19% at a time when SPY gained -1.36%. A starting capital of $100,000 at inception on 4/5/2017 would have grown to $680,635 which includes $32 cash and excludes $769 spent on fees and slippage. |
| iM-FlipSaver 60:40 | 20:80 – 2017: The model’s out of sample performance YTD is 0.2%, and for the last 12 months is 7.7%. Over the same period the benchmark E60B40 performance was -1.0% and 14.5% respectively. Over the previous week the market value of iM-FlipSaver 80:20 | 20:80 gained -1.06% at a time when SPY gained -1.15%. A starting capital of $100,000 at inception on 7/16/2015 would have grown to $179,697 which includes -$11 cash and excludes $5,611 spent on fees and slippage. | |
| iM-FlipSaver 70:30 | 20:80 – 2017: The model’s out of sample performance YTD is 0.0%, and for the last 12 months is 7.7%. Over the same period the benchmark E60B40 performance was -1.0% and 14.5% respectively. Over the previous week the market value of iM-FlipSaver 70:30 | 20:80 gained -1.16% at a time when SPY gained -1.15%. A starting capital of $100,000 at inception on 7/15/2015 would have grown to $186,799 which includes -$90 cash and excludes $5,884 spent on fees and slippage. | |
| iM-FlipSaver 80:20 | 20:80 – 2017: The model’s out of sample performance YTD is -0.2%, and for the last 12 months is 7.7%. Over the same period the benchmark E60B40 performance was -1.0% and 14.5% respectively. Over the previous week the market value of iM-FlipSaver 80:20 | 20:80 gained -1.25% at a time when SPY gained -1.15%. A starting capital of $100,000 at inception on 1/2/2017 would have grown to $193,788 which includes -$155 cash and excludes $6,148 spent on fees and slippage. | |
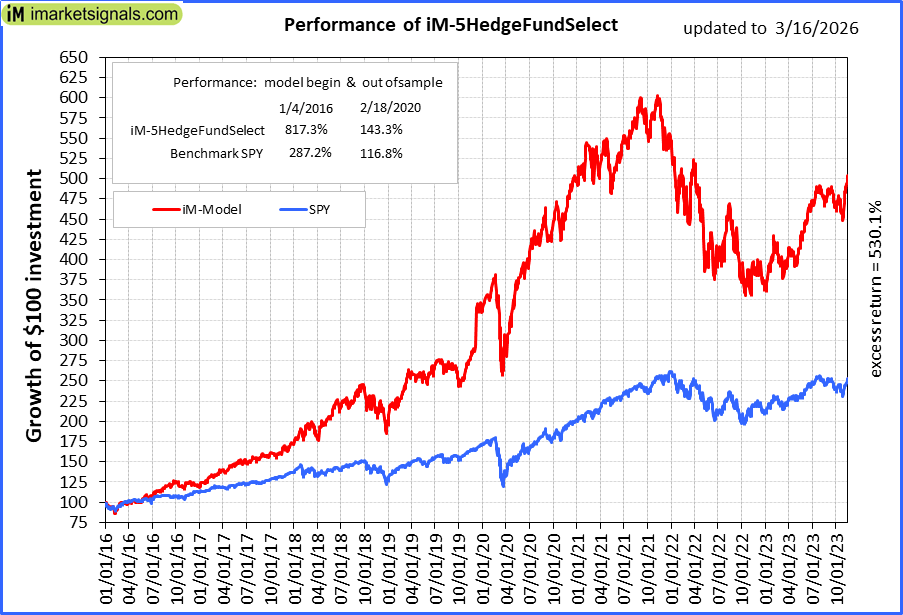 |
iM-5HedgeFundSelect: Since inception, on 1/5/2016, the model gained 817.34% while the benchmark SPY gained 287.20% over the same period. Over the previous week the market value of iM-5HedgeFundSelect gained -2.94% at a time when SPY gained -1.36%. A starting capital of $25,000 at inception on 1/5/2016 would have grown to $229,336 which includes $15,215 cash and excludes $3,216 spent on fees and slippage. |
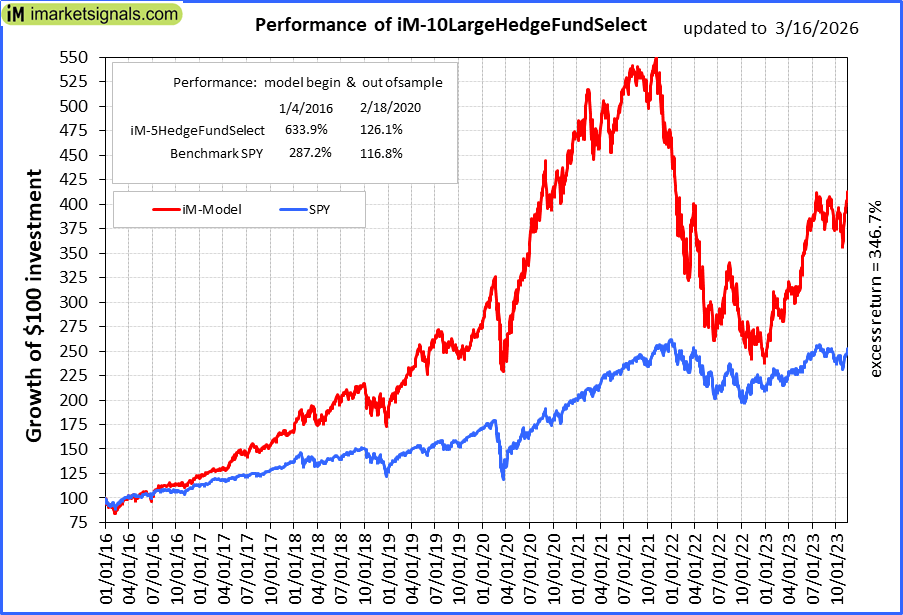 |
iM-10LargeHedgeFundSelect: Since inception, on 1/5/2016, the model gained 633.93% while the benchmark SPY gained 287.20% over the same period. Over the previous week the market value of iM-10LargeHedgeFundSelect gained -1.96% at a time when SPY gained -1.36%. A starting capital of $25,000 at inception on 1/5/2016 would have grown to $183,482 which includes $210 cash and excludes $1,951 spent on fees and slippage. |
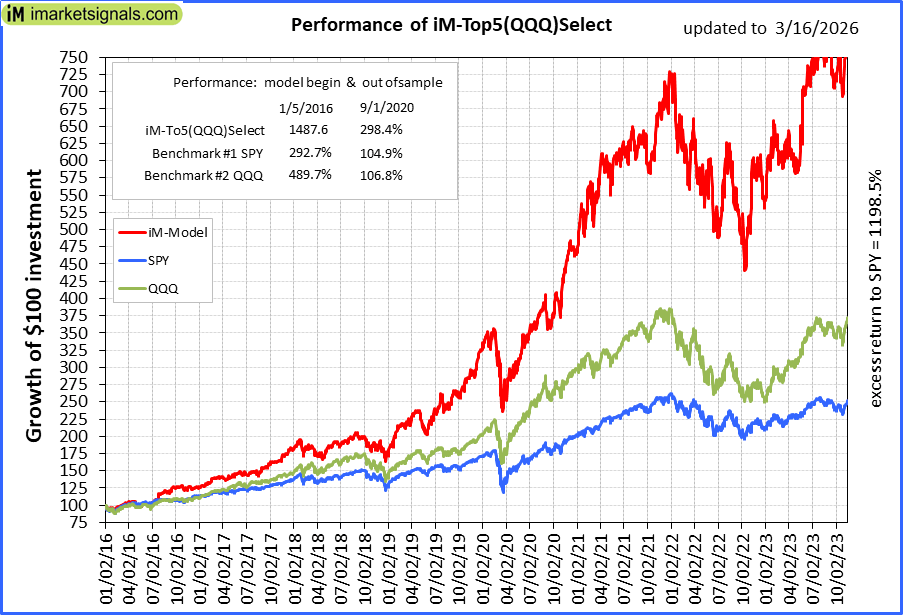 |
iM-Top5(QQQ)Select: Since inception, on 1/5/2016, the model gained 1485.73% while the benchmark SPY gained 287.20% over the same period. Over the previous week the market value of iM-Top5(QQQ)Select gained -4.68% at a time when SPY gained -1.36%. A starting capital of $100,000 at inception on 1/5/2016 would have grown to $1,585,735 which includes -$13,164 cash and excludes $27,015 spent on fees and slippage. |
 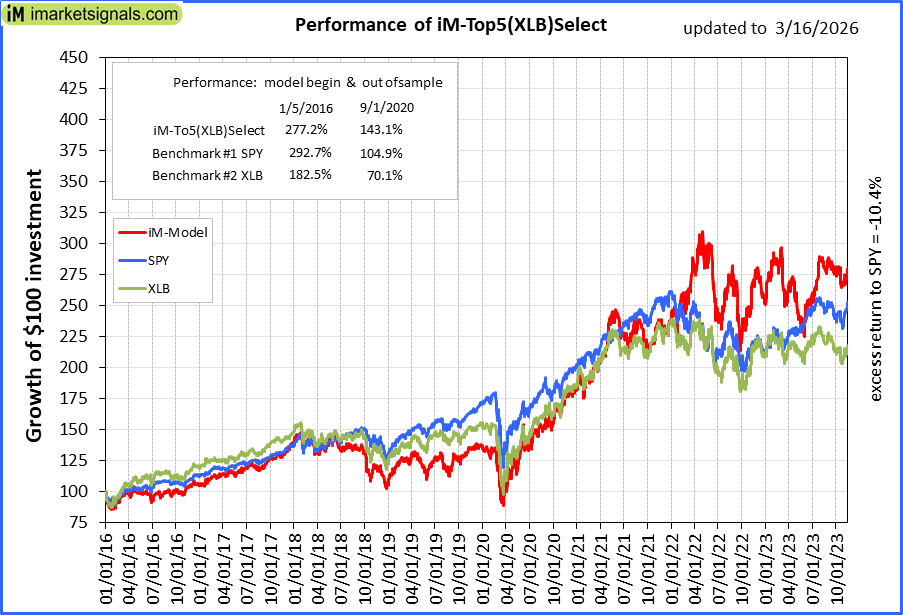 |
iM-Top5(XLB)Select: Since inception, on 1/5/2016, the model gained 276.81% while the benchmark SPY gained 287.20% over the same period. Over the previous week the market value of iM-Top5(XLB)Select gained 0.15% at a time when SPY gained -1.36%. A starting capital of $100,000 at inception on 1/5/2016 would have grown to $376,807 which includes -$3,348 cash and excludes $17,524 spent on fees and slippage. |
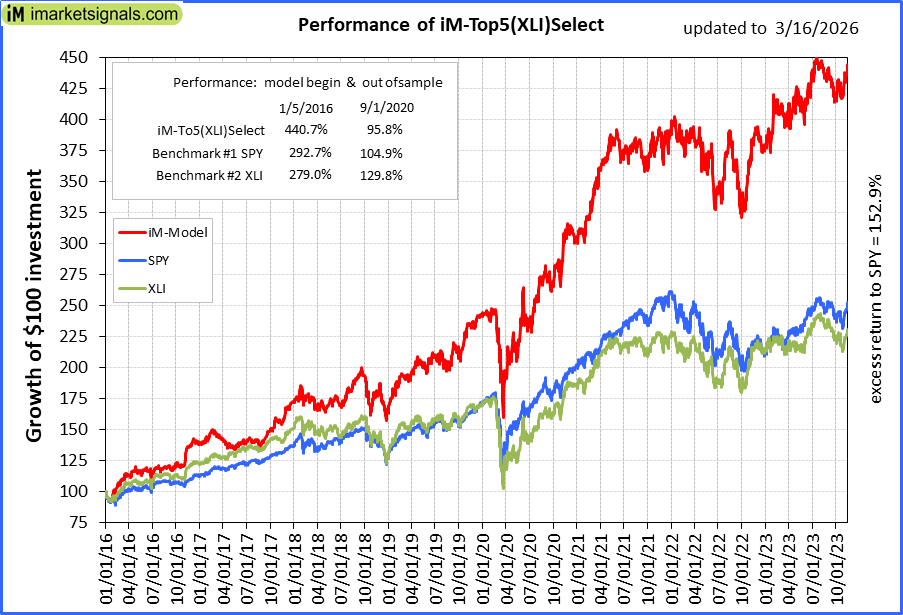 |
iM-Top5(XLI)Select: Since inception, on 1/5/2016, the model gained 440.07% while the benchmark SPY gained 287.20% over the same period. Over the previous week the market value of iM-Top5(XLI)Select gained -2.83% at a time when SPY gained -1.36%. A starting capital of $100,000 at inception on 1/5/2016 would have grown to $540,072 which includes $2,179 cash and excludes $8,921 spent on fees and slippage. |
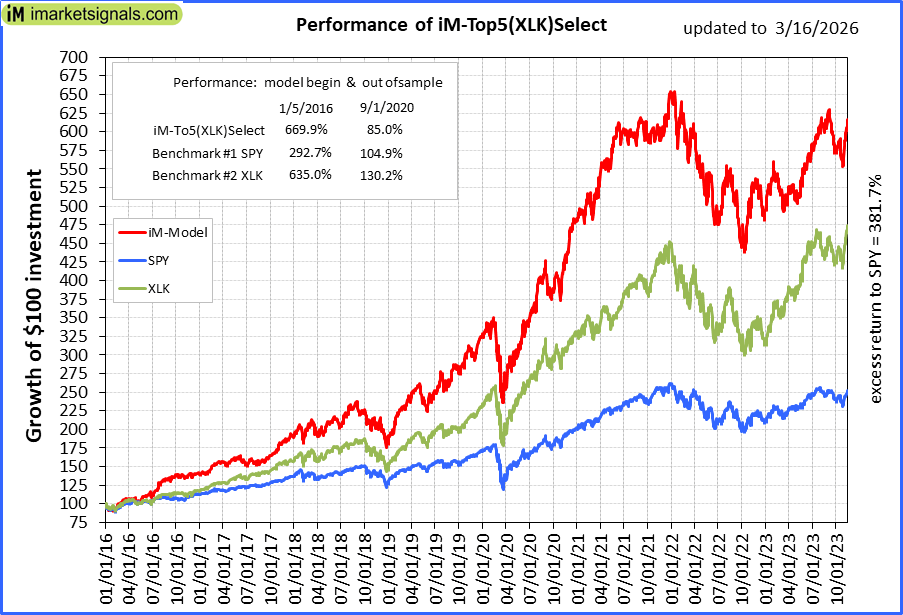 |
iM-Top5(XLK)Select: Since inception, on 1/5/2016, the model gained 668.88% while the benchmark SPY gained 287.20% over the same period. Over the previous week the market value of iM-Top5(XLK)Select gained -3.35% at a time when SPY gained -1.36%. A starting capital of $100,000 at inception on 1/5/2016 would have grown to $768,881 which includes $5,136 cash and excludes $3,071 spent on fees and slippage. |
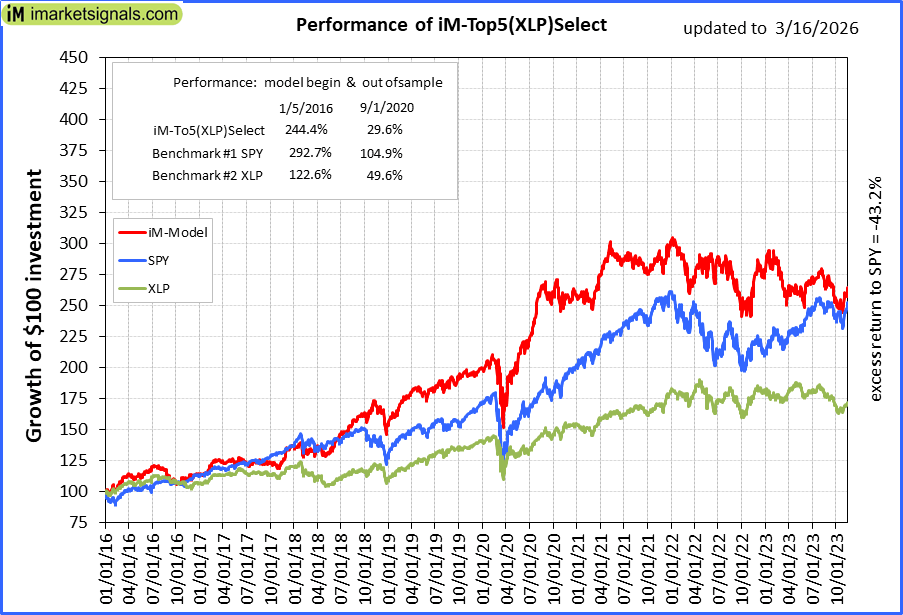 |
iM-Top5(XLP)Select: Since inception, on 1/5/2016, the model gained 243.98% while the benchmark SPY gained 287.20% over the same period. Over the previous week the market value of iM-Top5(XLP)Select gained -4.48% at a time when SPY gained -1.36%. A starting capital of $100,000 at inception on 1/5/2016 would have grown to $343,984 which includes $2,580 cash and excludes $3,099 spent on fees and slippage. |
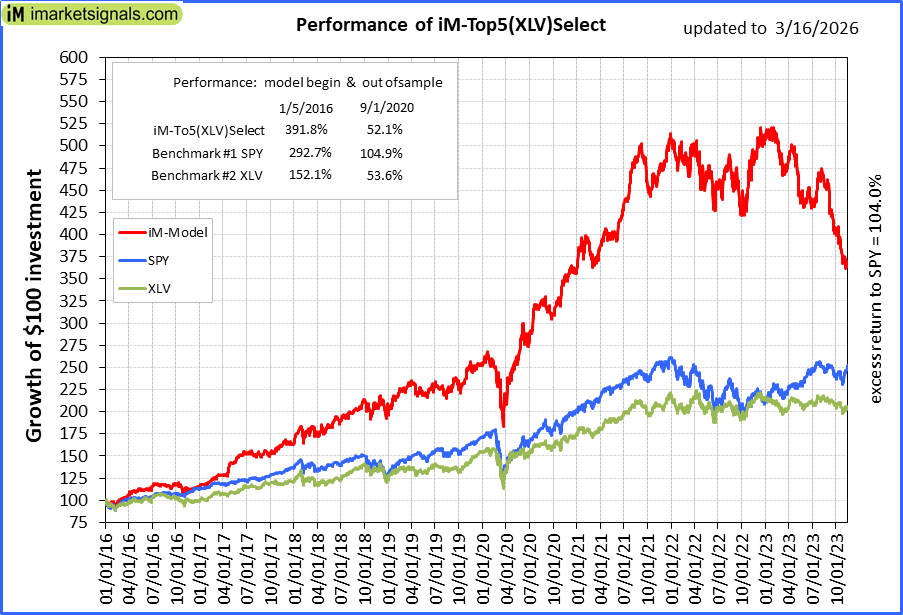 |
iM-Top5(XLV)Select: Since inception, on 1/5/2016, the model gained 391.21% while the benchmark SPY gained 287.20% over the same period. Over the previous week the market value of iM-Top5(XLV)Select gained -4.34% at a time when SPY gained -1.36%. A starting capital of $100,000 at inception on 1/5/2016 would have grown to $491,211 which includes $1,800 cash and excludes $19,968 spent on fees and slippage. |
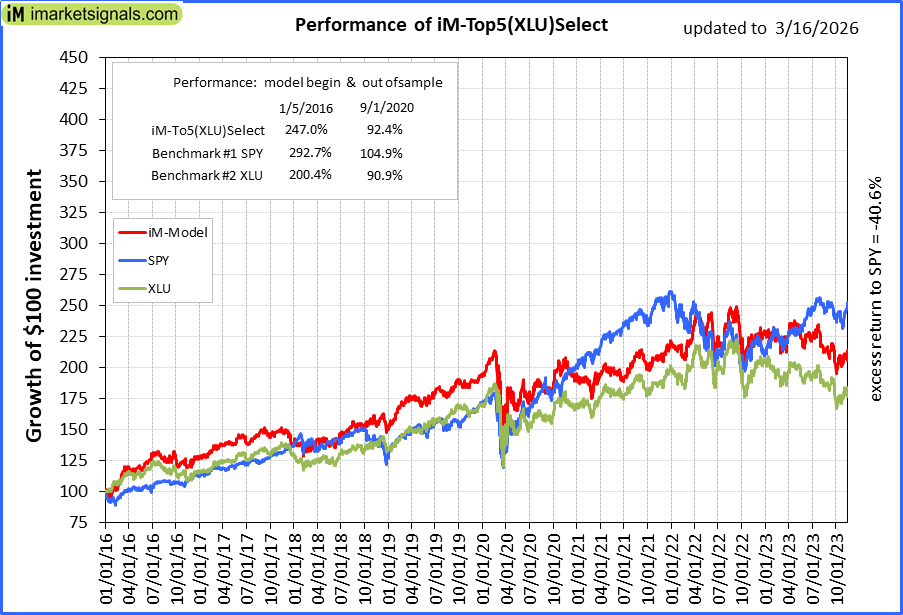 |
iM-Top5(XLU)Select: Since inception, on 1/5/2016, the model gained 246.56% while the benchmark SPY gained 287.20% over the same period. Over the previous week the market value of iM-Top5(XLU)Select gained 1.50% at a time when SPY gained -1.36%. A starting capital of $100,000 at inception on 1/5/2016 would have grown to $346,565 which includes $1,381 cash and excludes $18,540 spent on fees and slippage. |
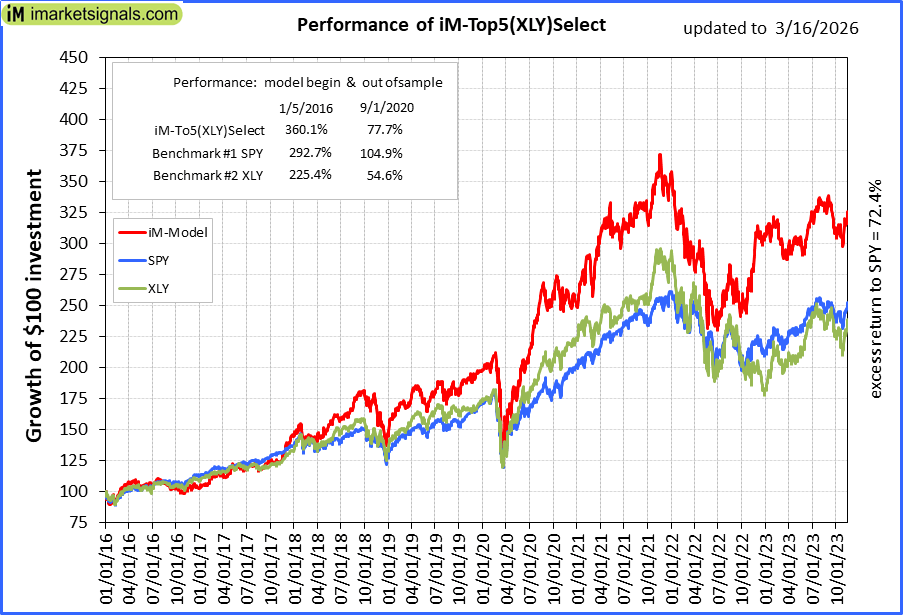 |
iM-Top5(XLY)Select: Since inception, on 1/5/2016, the model gained 359.60% while the benchmark SPY gained 287.20% over the same period. Over the previous week the market value of iM-Top5(XLY)Select gained -1.83% at a time when SPY gained -1.36%. A starting capital of $100,000 at inception on 1/5/2016 would have grown to $459,603 which includes $361 cash and excludes $7,844 spent on fees and slippage. |
|
|
iM-Seasonal Super-Sectors (Top5 combo) : Since inception, on 11/17/2020, the model gained 115.13% while the benchmark SPY gained 101.00% over the same period. Over the previous week the market value of iM-Seasonal Super-Sectors (Top5 combo) gained -2.23% at a time when SPY gained -1.36%. A starting capital of $100,000 at inception on 11/17/2020 would have grown to $215,135 which includes $1,711 cash and excludes $00 spent on fees and slippage. |
| iM-Dividend Growth Portfolio: The model’s out of sample performance YTD is 0.5%, and for the last 12 months is 13.9%. Over the same period the benchmark SPY performance was -1.9% and 20.3% respectively. Over the previous week the market value of the iM-Dividend Growth Portfolio gained -3.42% at a time when SPY gained -1.36%. A starting capital of $100,000 at inception on 6/30/2016 would have grown to $535,256 which includes $3,361 cash and excludes $14,626 spent on fees and slippage. | |
| iM-Gold Momentum Timer (AU, NEM, SBSW): The model’s out of sample performance YTD is 8.4%, and for the last 12 months is 238.9%. Over the same period the benchmark SPY performance was -1.9% and 20.3% respectively. Over the previous week the market value of iM-Gold Momentum Timer (AU, NEM, SBSW) gained -10.23% at a time when SPY gained -1.36%. A starting capital of $100,000 at inception on 6/30/2016 would have grown to $147,514 which includes $200,202 cash and excludes Gain to date spent on fees and slippage. | |
|
|
iM-ModSum/YieldCurve Timer: The model’s out of sample performance YTD is -0.6%, and for the last 12 months is 15.4%. Over the same period the benchmark SPY performance was -1.9% and 20.3% respectively. Over the previous week the market value of iM-PortSum/YieldCurve Timer gained -1.35% at a time when SPY gained -1.36%. A starting capital of $100,000 at inception on 1/1/2016 would have grown to $380,640 which includes $4,646 cash and excludes $2,335 spent on fees and slippage. |
|
|
iM-Best(SPY-SH).R1: The model’s out of sample performance YTD is -1.9%, and for the last 12 months is -2.2%. Over the same period the benchmark SPY performance was -1.9% and 20.3% respectively.. A starting capital of $100,000 at inception on 1/2/2009 would have grown to $67,664 which includes $761 cash and excludes $2,818 spent on fees and slippage. |
|
|
iM-Combo3.R1: The model’s out of sample performance YTD is 0.5%, and for the last 12 months is -3.9%. Over the same period the benchmark SPY performance was -1.9% and 20.3% respectively. Over the previous week the market value of iM-Combo3.R1 gained -0.19% at a time when SPY gained -1.36%. A starting capital of $100,000 at inception on 2/3/2014 would have grown to $196,380 which includes $10,299 cash and excludes $8,526 spent on fees and slippage. |
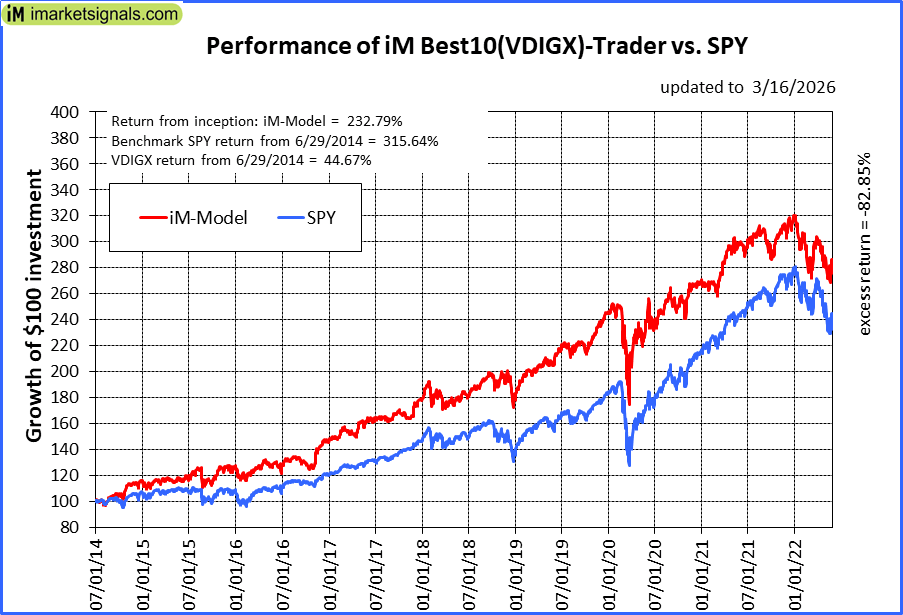 |
iM-Best10(VDIGX)-Trader: The model’s out of sample performance YTD is -10.7%, and for the last 12 months is -3.5%. Over the same period the benchmark SPY performance was -1.9% and 20.3% respectively. Since inception, on 7/1/2014, the model gained 232.79% while the benchmark SPY gained 315.64% and VDIGX gained 44.67% over the same period. Over the previous week the market value of iM-Best10(VDIGX) gained -2.72% at a time when SPY gained -1.36%. A starting capital of $100,000 at inception on 7/1/2014 would have grown to $332,786 which includes $466 cash and excludes $5,704 spent on fees and slippage. |
|
|
iM 6-Stock Capital Strength Portfolio: The model’s out of sample performance YTD is 19.7%, and for the last 12 months is 17.6%. Over the same period the benchmark SPY performance was -1.9% and 20.3% respectively. Over the previous week the market value of the iM 6-Stock Capital Strength Portfolio gained 0.13% at a time when SPY gained -1.36%. A starting capital of $100,000 at inception on 10/28/2016 would have grown to $307,508 which includes $2,008 cash and excludes $4,455 spent on fees and slippage. |
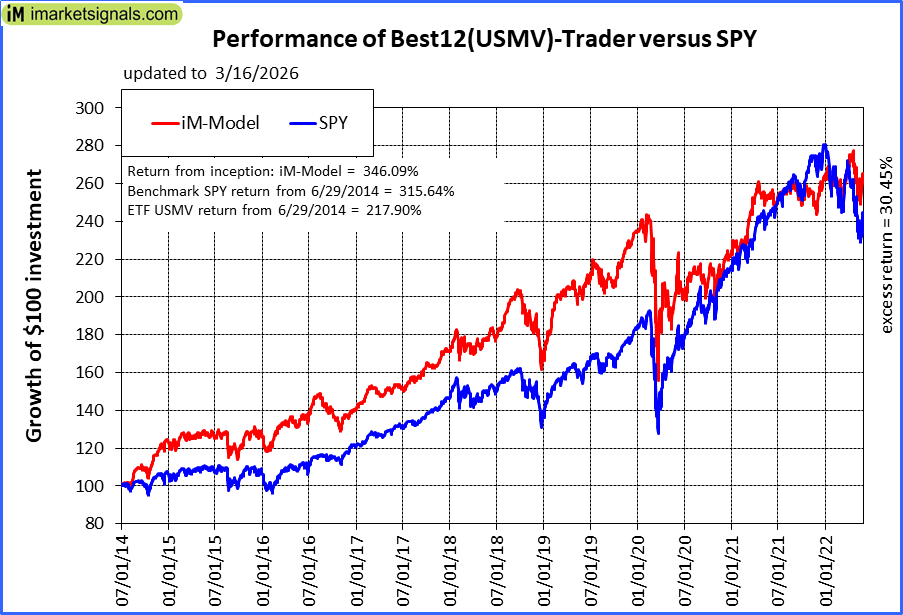 |
iM-Best12(USMV)-Trader: The model’s out of sample performance YTD is 4.4%, and for the last 12 months is 26.2%. Over the same period the benchmark SPY performance was -1.9% and 20.3% respectively. Since inception, on 6/30/2014, the model gained 346.09% while the benchmark SPY gained 315.64% and the ETF USMV gained 217.90% over the same period. Over the previous week the market value of iM-Best12(USMV)-Trader gained -0.70% at a time when SPY gained -1.36%. A starting capital of $100,000 at inception on 6/30/2014 would have grown to $446,095 which includes $1,998 cash and excludes $8,774 spent on fees and slippage. |
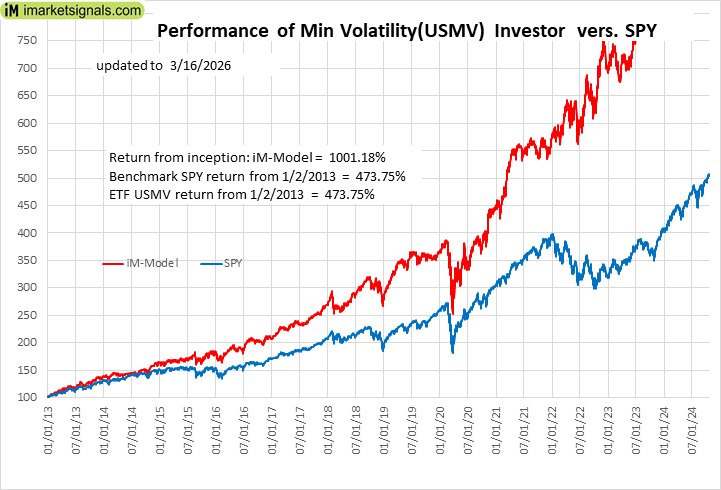 |
iM-Min Volatility(USMV) Investor (Tax Efficient): The model’s out of sample performance YTD is -7.5%, and for the last 12 months is 11.0%. Over the same period the benchmark SPY performance was -1.9% and 20.3% respectively. Since inception, on 1/3/2013, the model gained 1001.18% while the benchmark SPY gained 473.75% and the ETF USMV gained 473.75% over the same period. Over the previous week the market value of iM-Best12(USMV)Q1 gained -4.85% at a time when SPY gained -1.36%. A starting capital of $100,000 at inception on 1/3/2013 would have grown to $1,101,180 which includes $813 cash and excludes $15,356 spent on fees and slippage. |
|
|
iM-Bond Market Trader (High-Yield Bond or 10-yr Treasury Bond): The model’s out of sample performance YTD is -1.1%, and for the last 12 months is 2.4%. Over the same period the benchmark BND performance was 0.3% and 5.2% respectively. Over the previous week the market value of the iM-Bond Market Trader (High-Yield Bond or 10-yr Treasury Bond) gained -1.25% at a time when BND gained -0.83%. A starting capital of $10,000 at inception on 1/3/2000 would have grown to $147,508 which includes $1,119 cash and excludes $2,916 spent on fees and slippage. |
|
|
iM-ModSum/YieldCurve Timer: The model’s out of sample performance YTD is -0.6%, and for the last 12 months is 15.4%. Over the same period the benchmark SPY performance was -1.9% and 20.3% respectively. Over the previous week the market value of iM-PortSum/YieldCurve Timer gained -1.35% at a time when SPY gained -1.36%. A starting capital of $100,000 at inception on 1/1/2016 would have grown to $380,640 which includes $4,646 cash and excludes $2,335 spent on fees and slippage. |
|
|
iM-Best2 MC-Score ETF System: The model’s out of sample performance YTD is 5.5%, and for the last 12 months is 9.9%. Over the same period the benchmark SPY performance was -1.9% and 20.3% respectively. Over the previous week the market value of the iM-Best2 MC-Score ETF System gained -1.09% at a time when SPY gained -1.36%. A starting capital of $100,000 at inception on 6/30/2016 would have grown to $198,518 which includes $83 cash and excludes $5,779 spent on fees and slippage. |
|
|
iM-Best4 MC-Score Vanguard System: The model’s out of sample performance YTD is 5.8%, and for the last 12 months is 11.5%. Over the same period the benchmark SPY performance was -1.9% and 20.3% respectively. Over the previous week the market value of the iM-Best4 MC-Score Vanguard System gained -0.47% at a time when SPY gained -1.36%. A starting capital of $100,000 at inception on 6/30/2016 would have grown to $193,620 which includes $4,311 cash and excludes $00 spent on fees and slippage. |
|
|
iM-Composite (SPY-IEF) Timer: The model’s out of sample performance YTD is -0.7%, and for the last 12 months is 5.1%. Over the same period the benchmark SPY performance was -1.9% and 20.3% respectively. Over the previous week the market value of the iM-Composite (SPY-IEF) Timer gained -1.36% at a time when SPY gained -1.36%. A starting capital of $100,000 at inception on 6/30/2016 would have grown to $215,121 which includes $362 cash and excludes $8,651 spent on fees and slippage. |
|
|
iM-Composite(Gold-Stocks-Bond) Timer: The model’s out of sample performance YTD is 16.2%, and for the last 12 months is 67.4%. Over the same period the benchmark SPY performance was -1.9% and 20.3% respectively. Over the previous week the market value of the iM-Composite(Gold-Stocks-Bond) Timer gained -2.55% at a time when SPY gained -1.36%. A starting capital of $100,000 at inception on 6/30/2016 would have grown to $469,194 which includes $36 cash and excludes $9,190 spent on fees and slippage. |
March 5, 2026
iM-Business Cycle Index
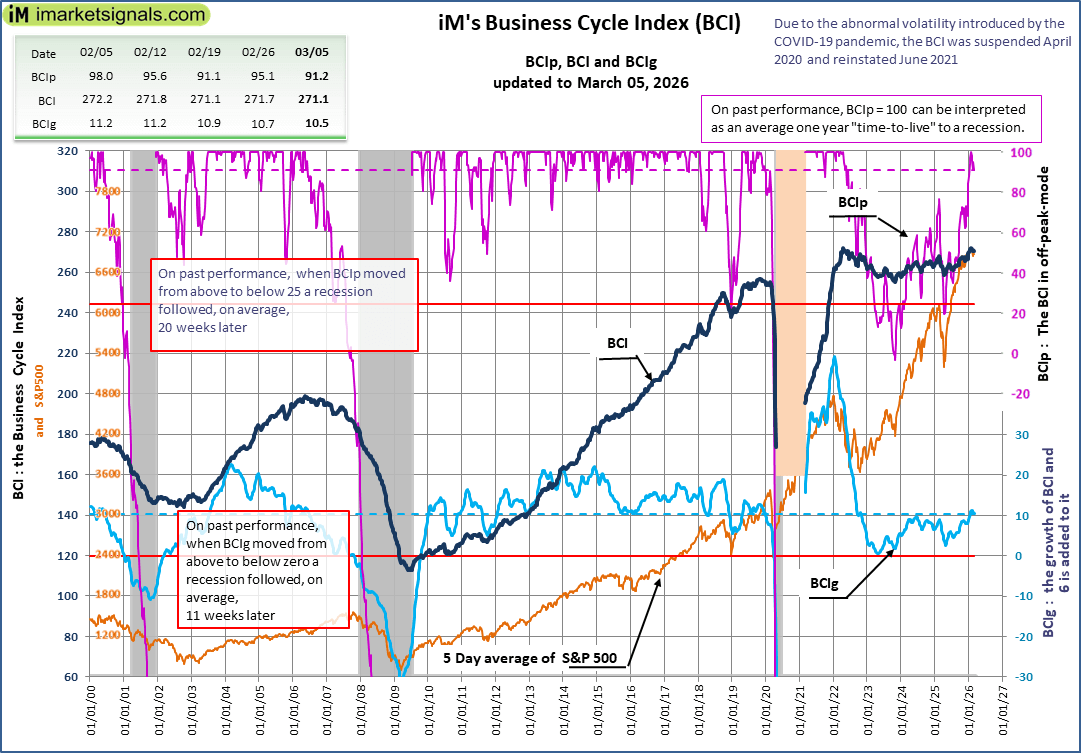
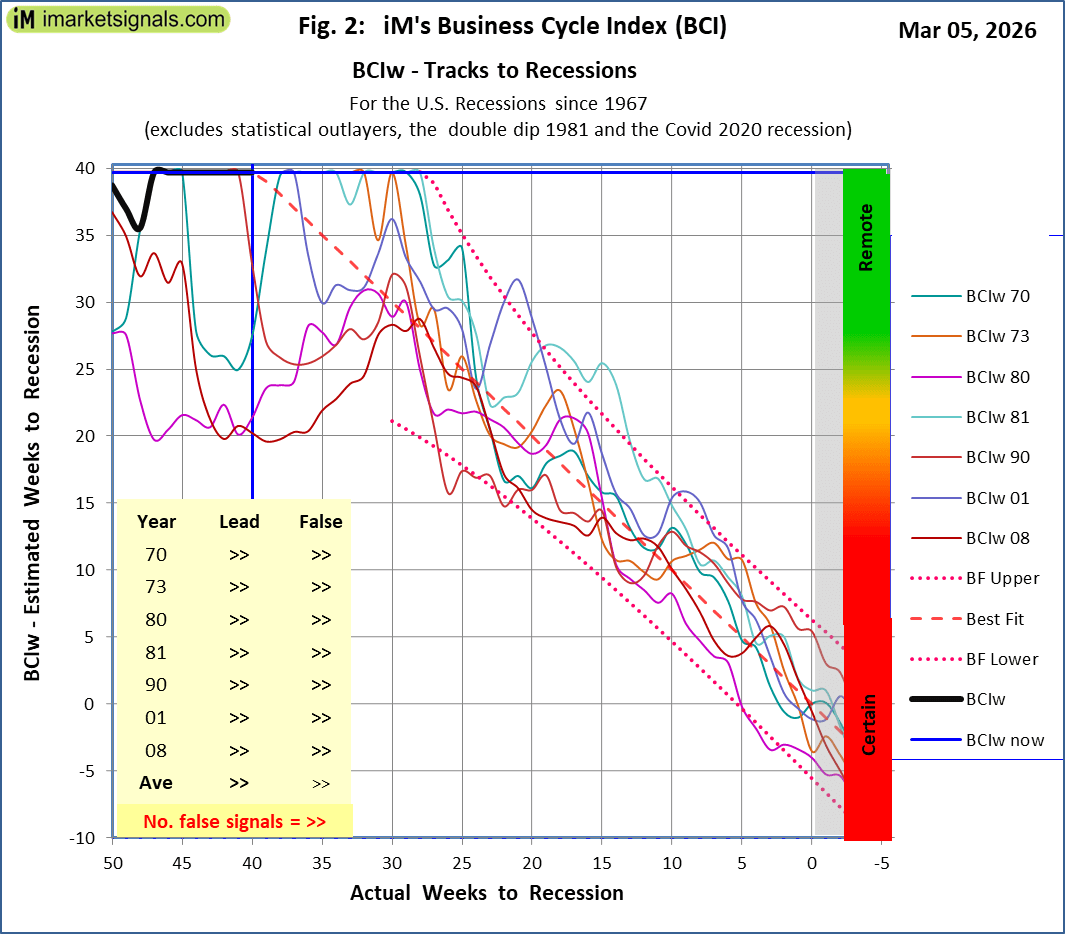 The BCI is not signalling a recession
Monthly Updates
April 3, 2026
Unemployment
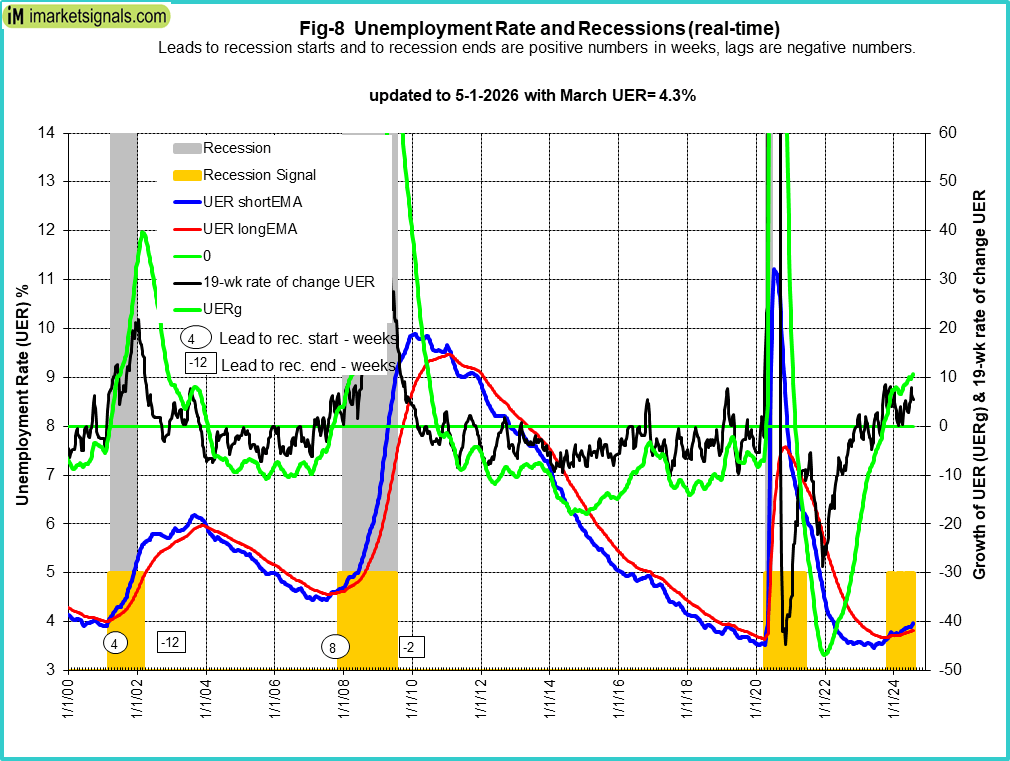
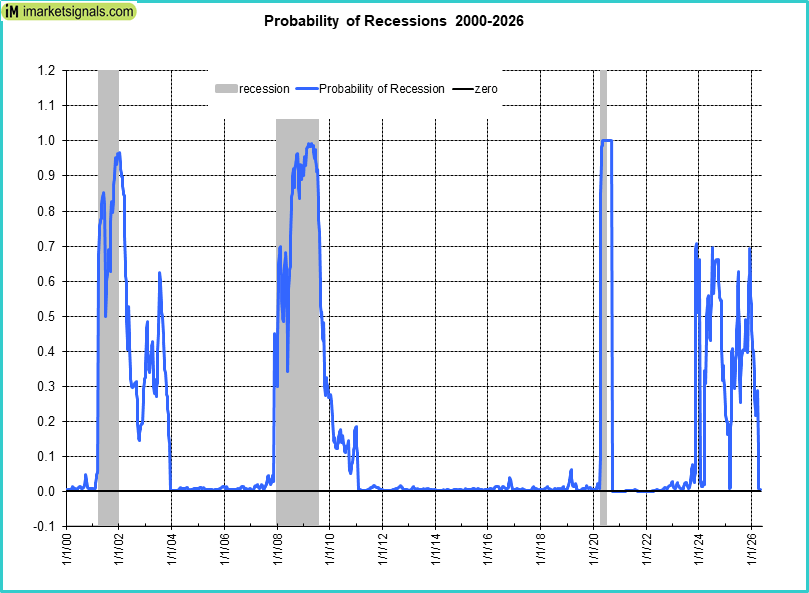
The 3/6/2025 BLS Employment Situation Report reports that the February 2026 unemployment rate decreased by 0.1% to 4.3%.
Our UER model does signal a recession with a near zero recession probability of (see graph).
CAPE-Cycle-ID
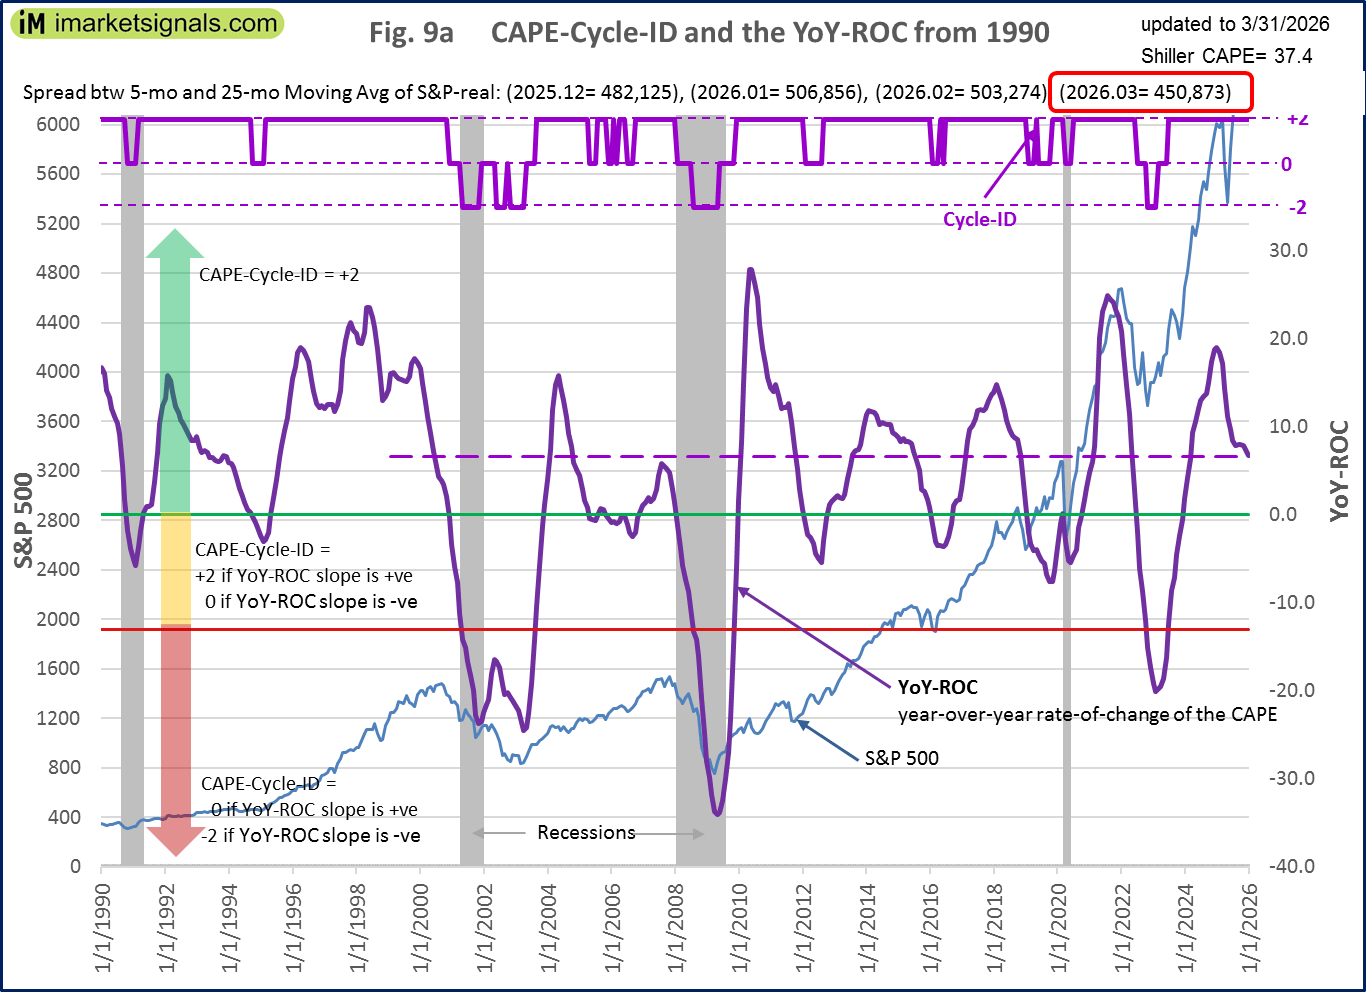 Fig 9a depicts the CAPE-Cycle-ID and the year-on-year rate-of-change of the Shiller CAPE; the level switched from -2 to 0 end of June 2023 generating a buy signal. This indicator now invested in the markets. This indicator is described here.
To avoid the bear market, exit stocks when the spread between the 5-month and 25-month moving averages of S&P-real becomes negative and simultaneously the CAPE-Cycle-ID score is 0 or -2. (read more)
Estimated Forward 10-Year Returns
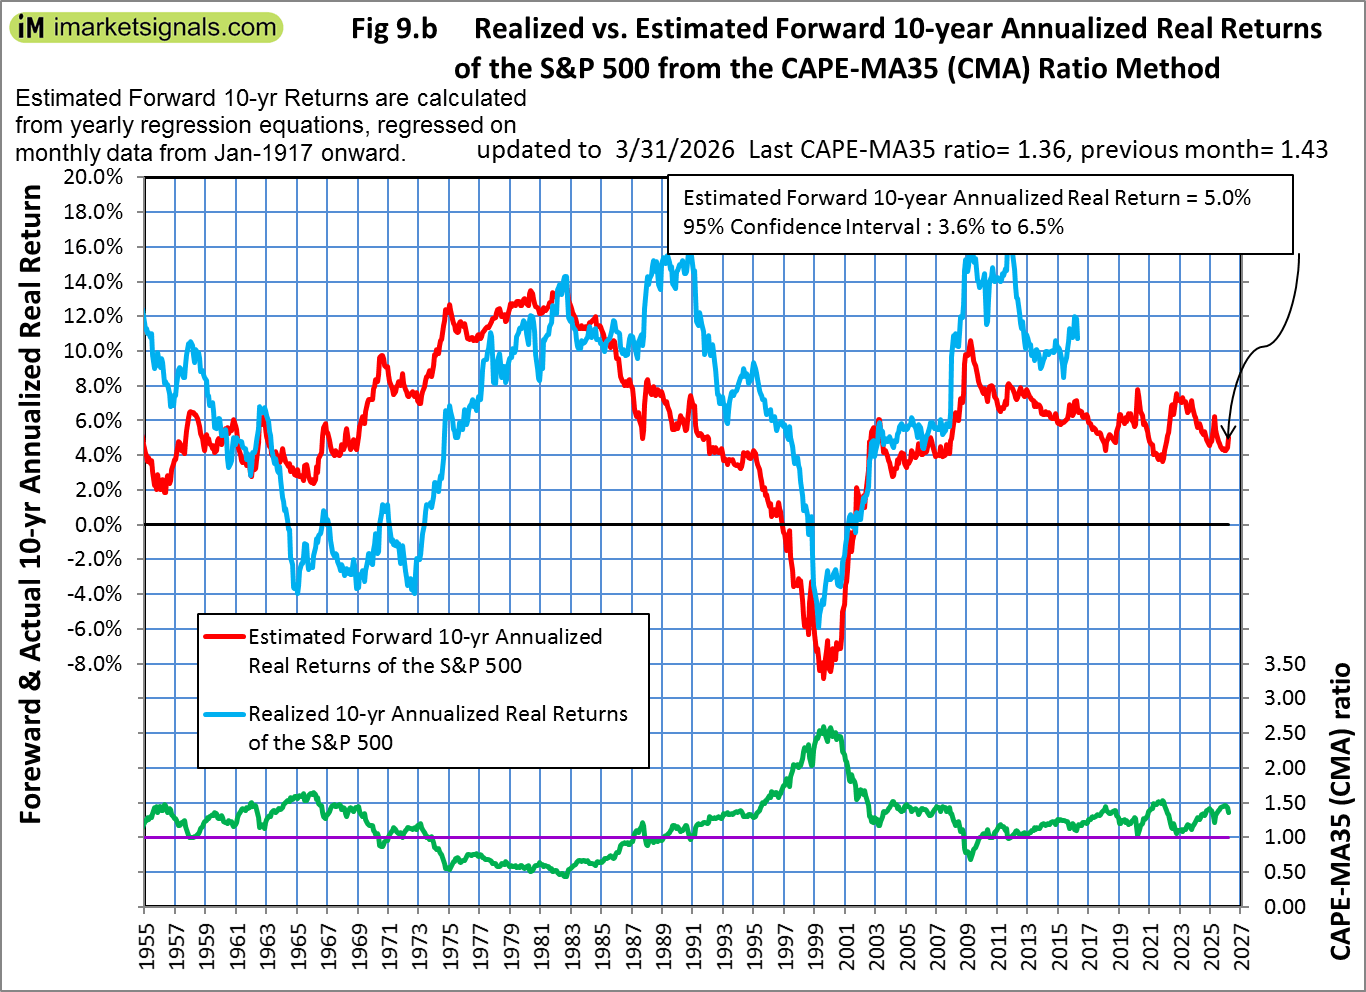 The estimated forward 10‐year annualized real return is 5.0% (previous month 4.5%) with a 95% confidence interval 3.6% to 6.5% (3.0% to 5.9%). Also refer to the Realized Forward 10-Year Returns vs. Inflation Rate
 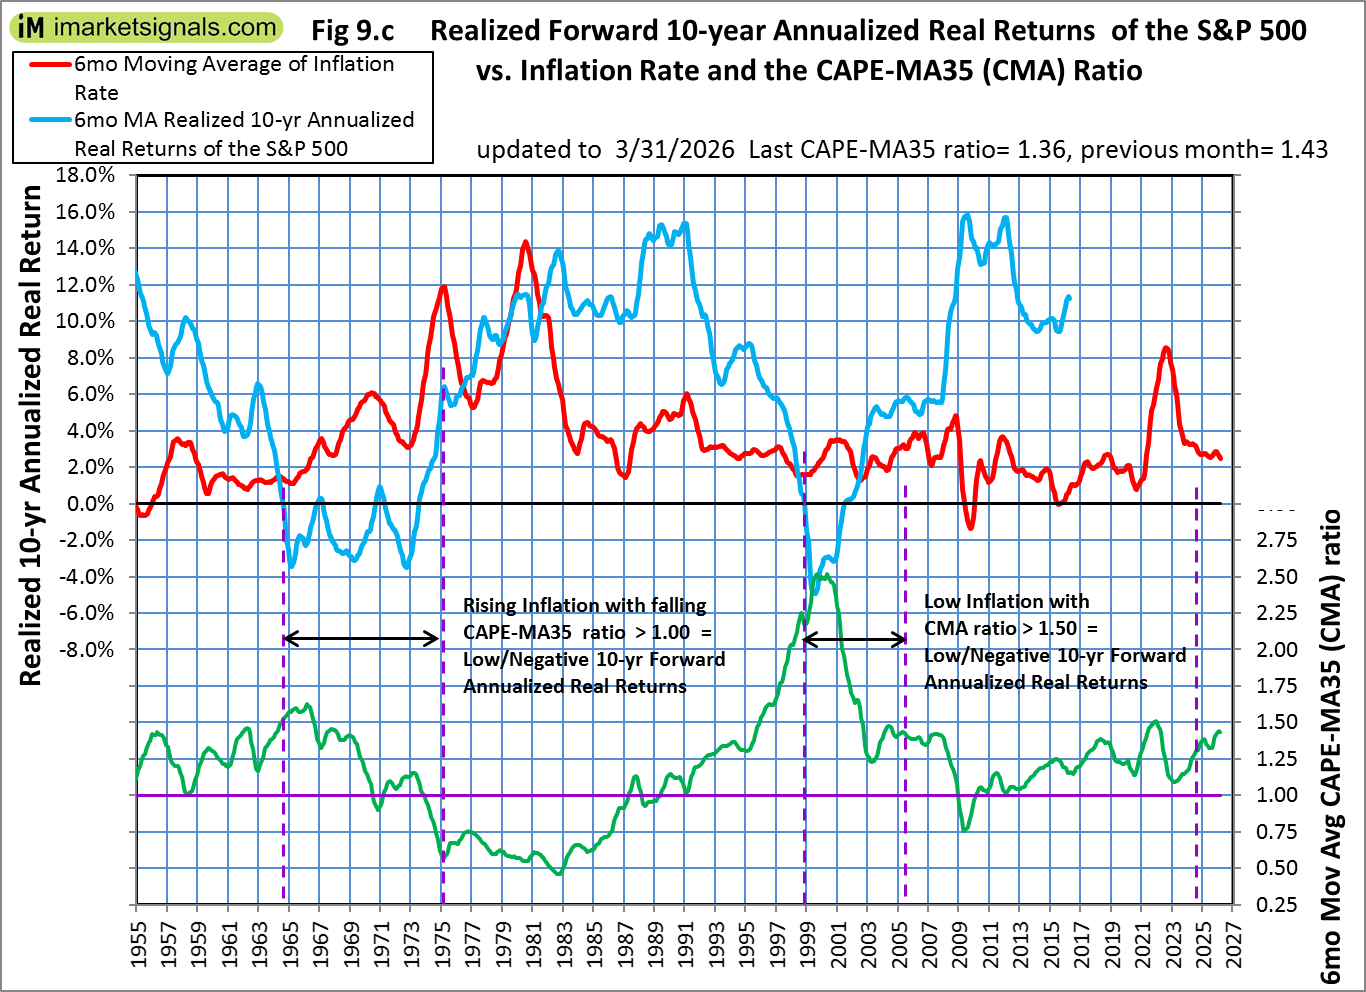 We may be in a rising inflation period with a falling CAPE-MA35 ratio similar to 1964-1973. This implies very low or negative 10 year forward annualized real returns, much lower than the returns indicated by regression analysis shown in the Estimated Forward 10-Year Returns.
.
iM-GT Timer
To view this premium content requires membership category: Bronze or higher. However, it can be freely viewed after 04-20-2026 16:00 (New York), or please login or register
Trade Weighted USD
To view this premium content requires membership category: Bronze or higher. However, it can be freely viewed after 04-20-2026 16:00 (New York), or please login or register
TIAA Real Estate Account
To view this premium content requires membership category: Bronze or higher. However, it can be freely viewed after 05-01-2026 16:00 (New York), or please login or register