  |
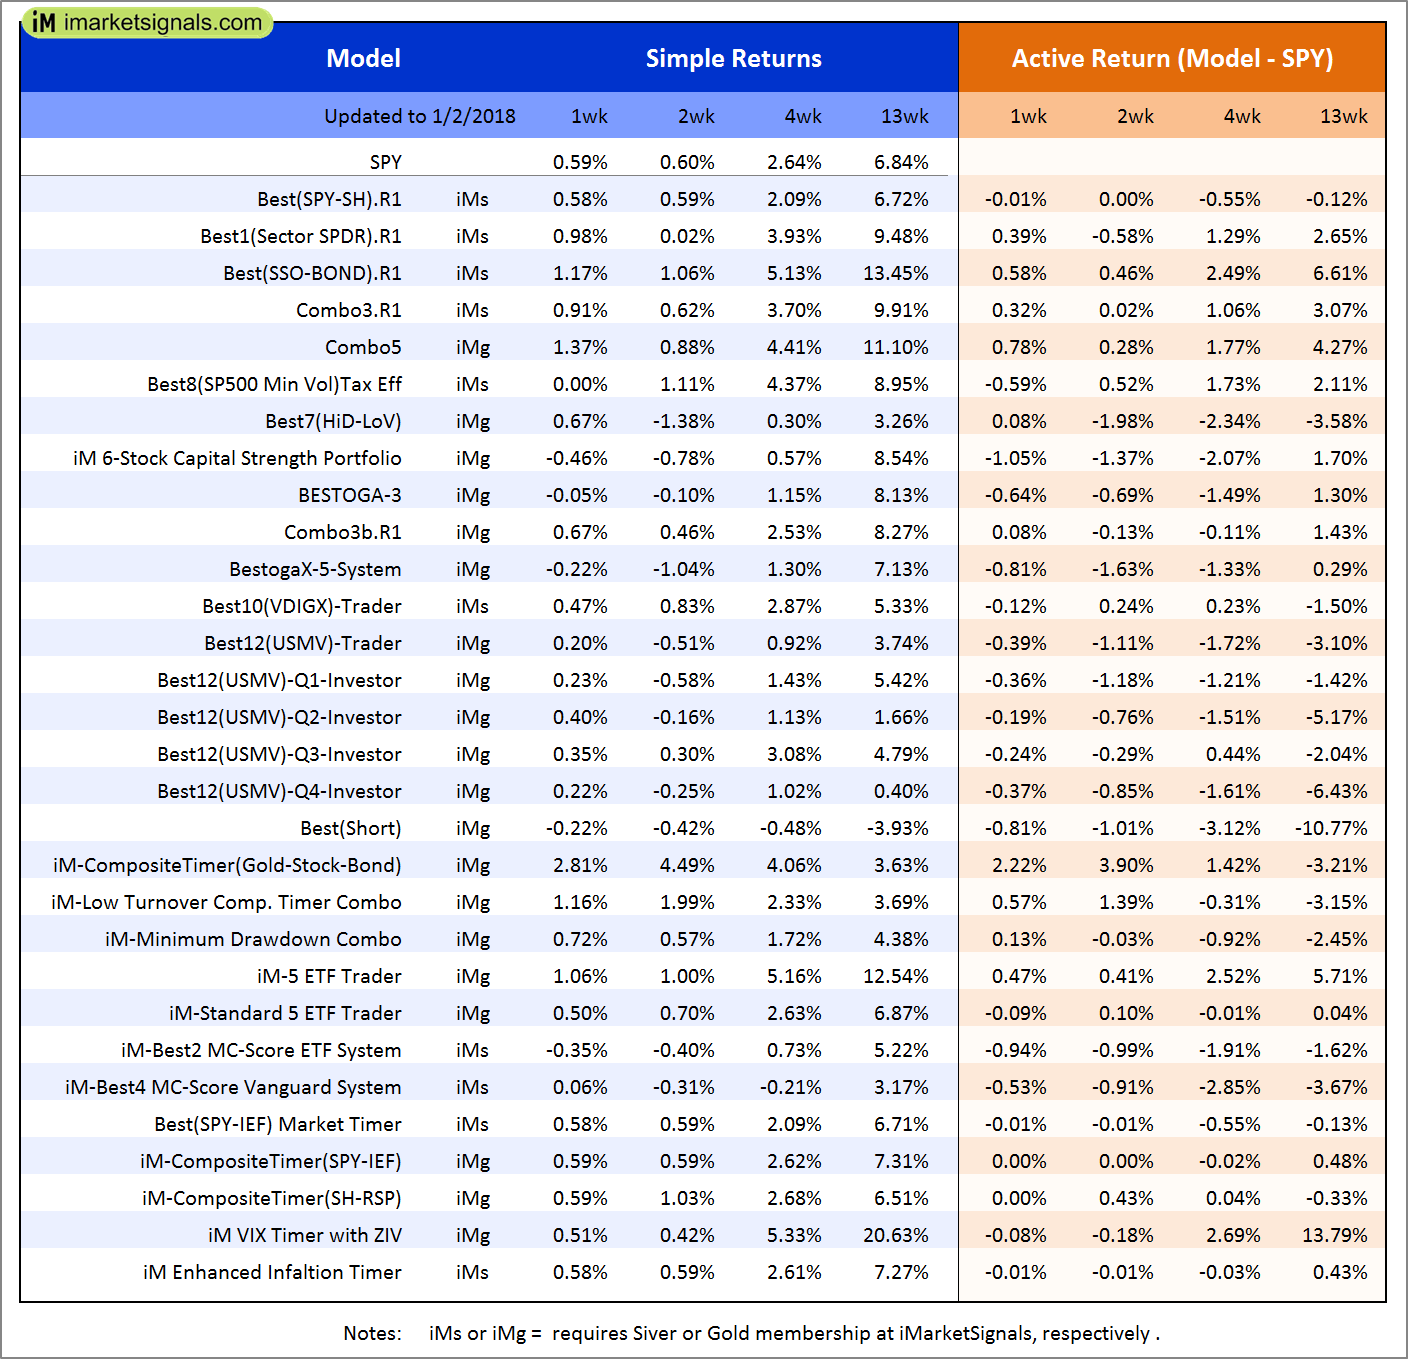
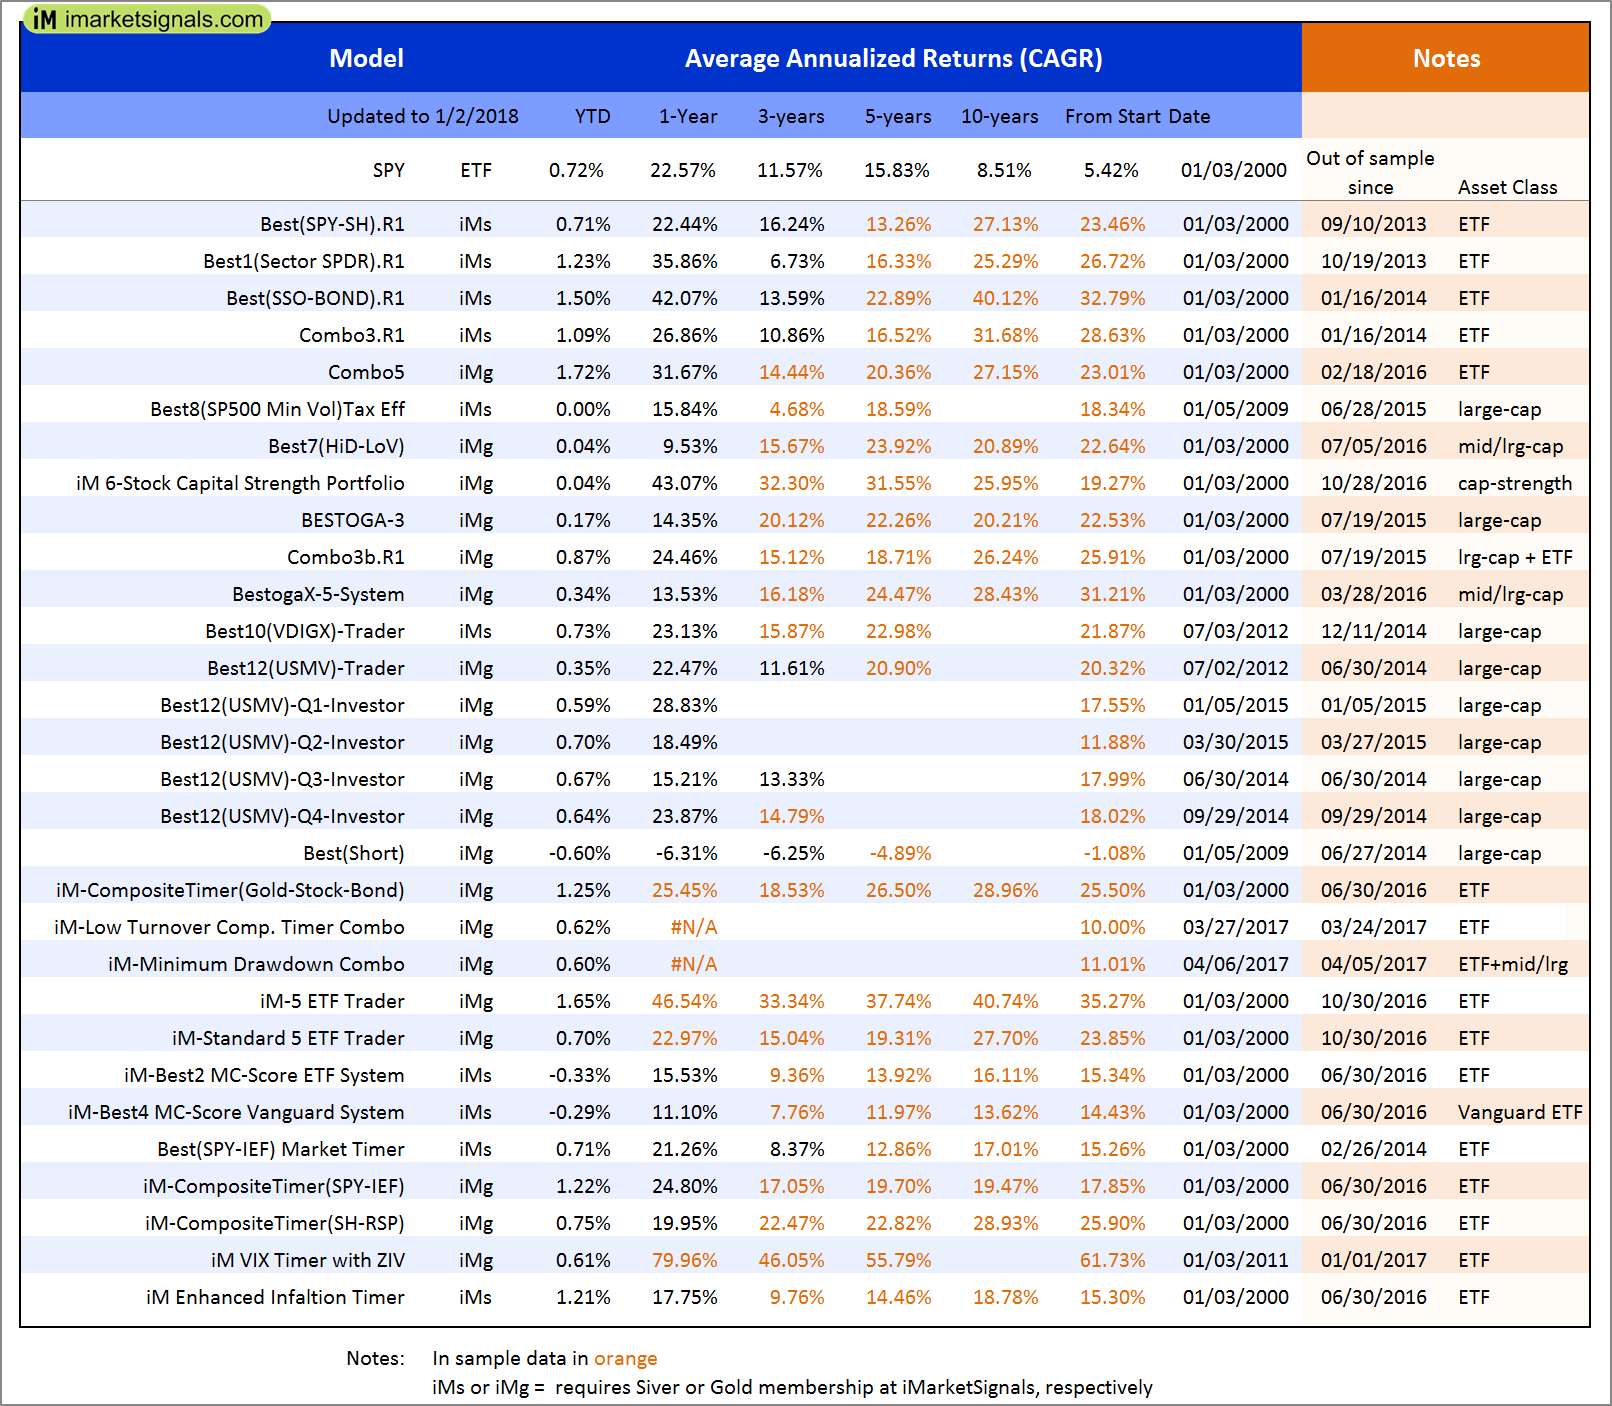
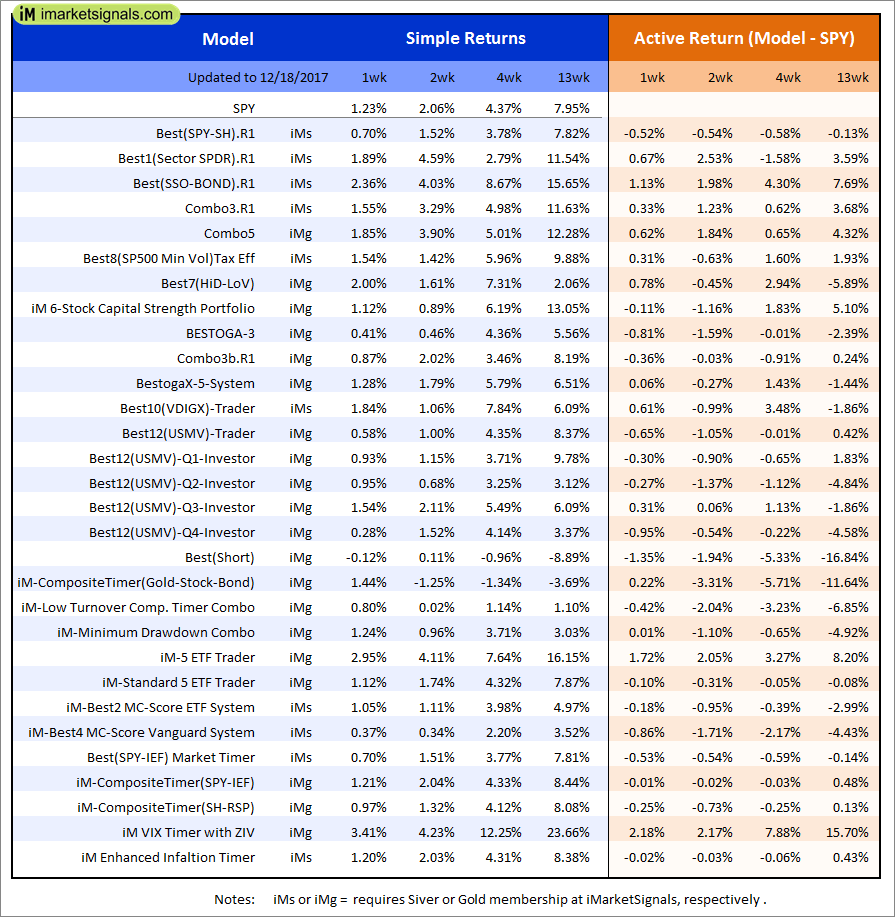
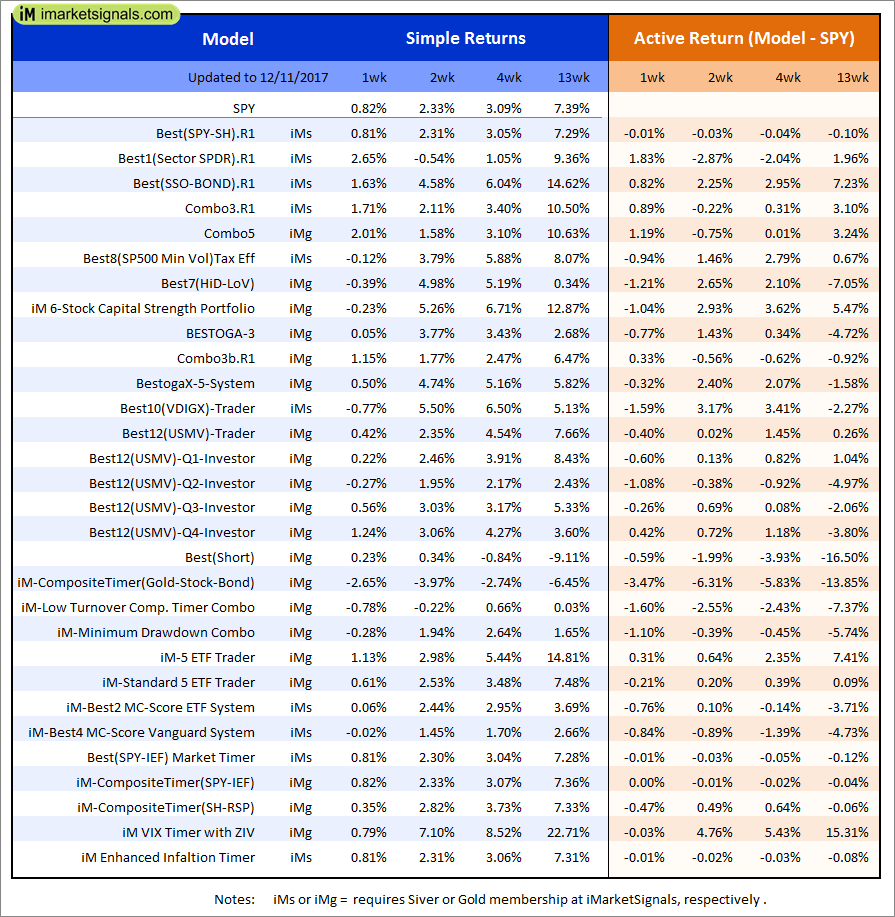
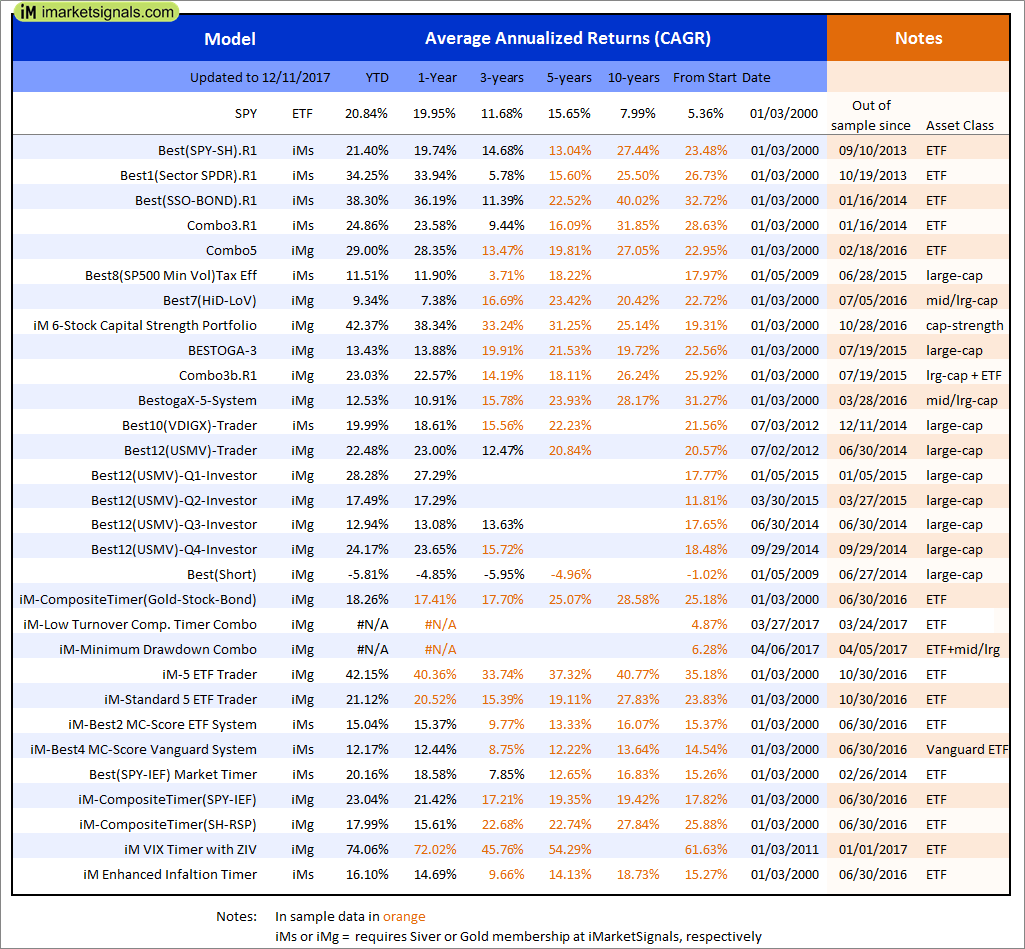
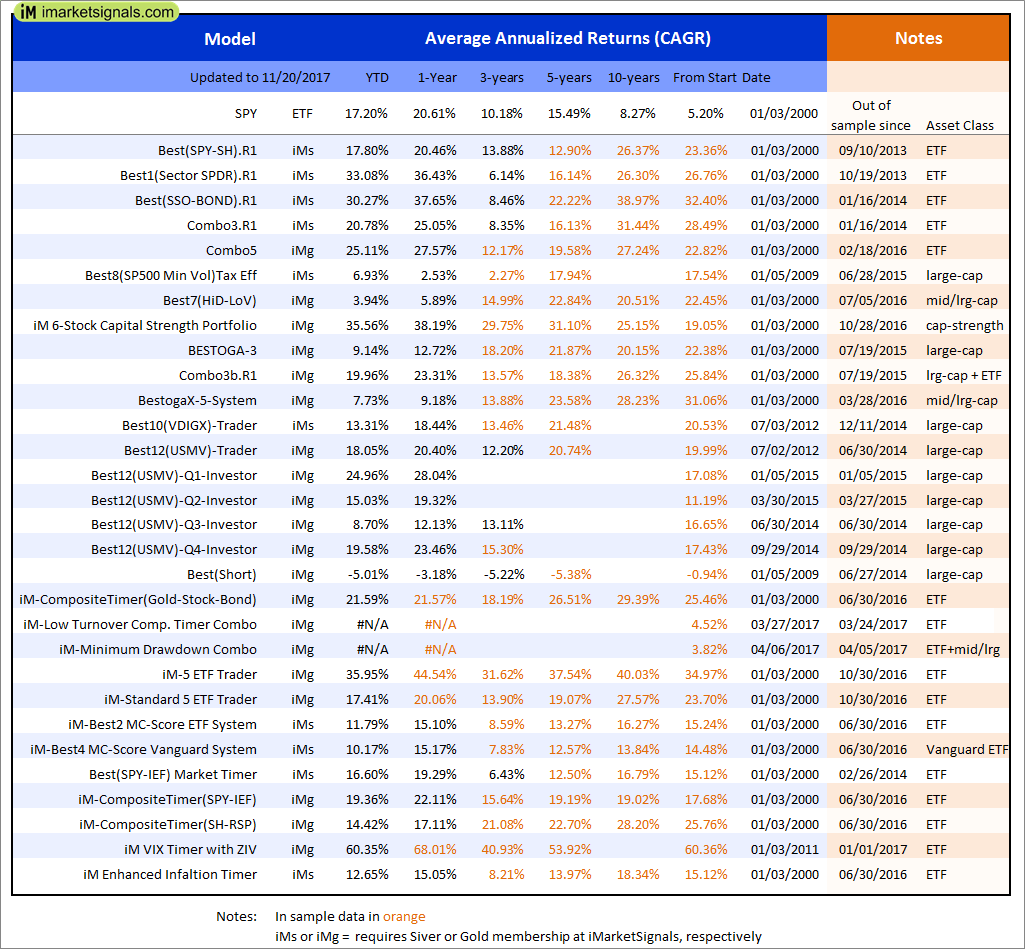
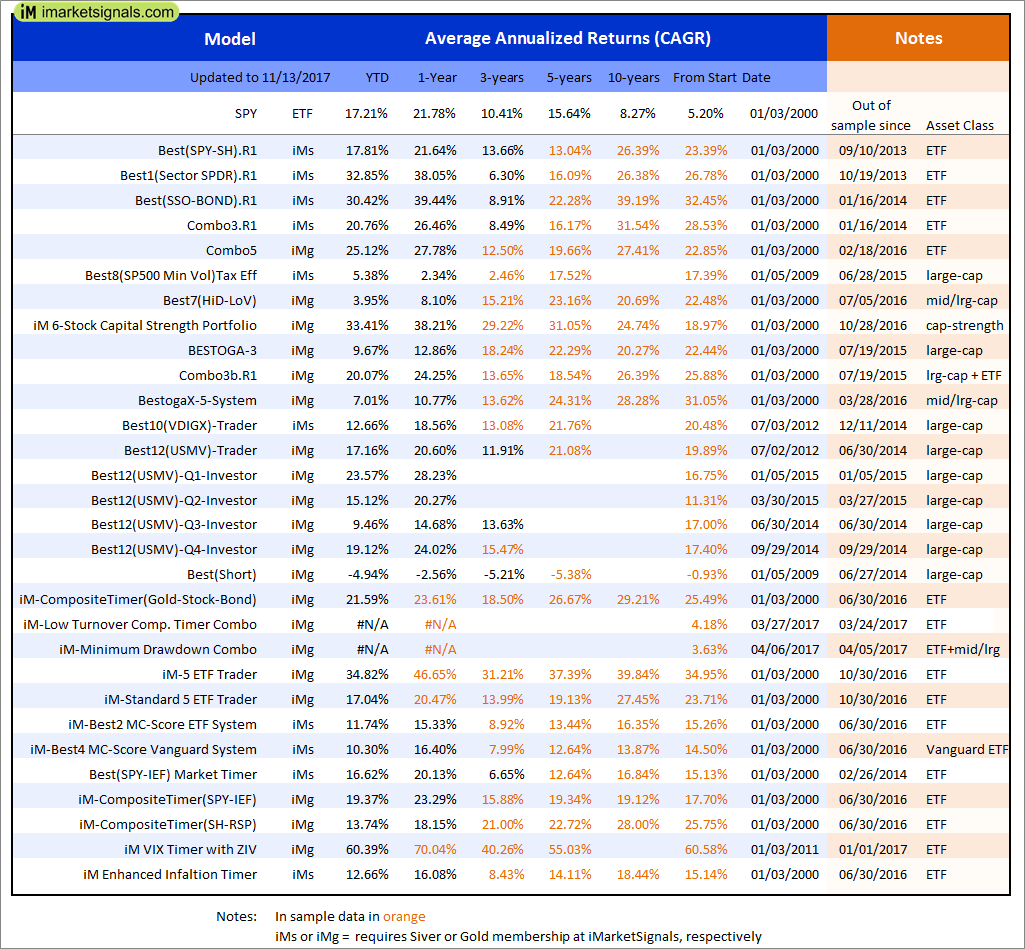
Out of sample performance summary of our models for the past 1, 2, 4 and 13 week periods. The active active return indicates how the models over- or underperformed the benchmark ETF SPY. Also the YTD, and the 1-, 3-, 5- and 10-year annualized returns are shown in the second table |
 |
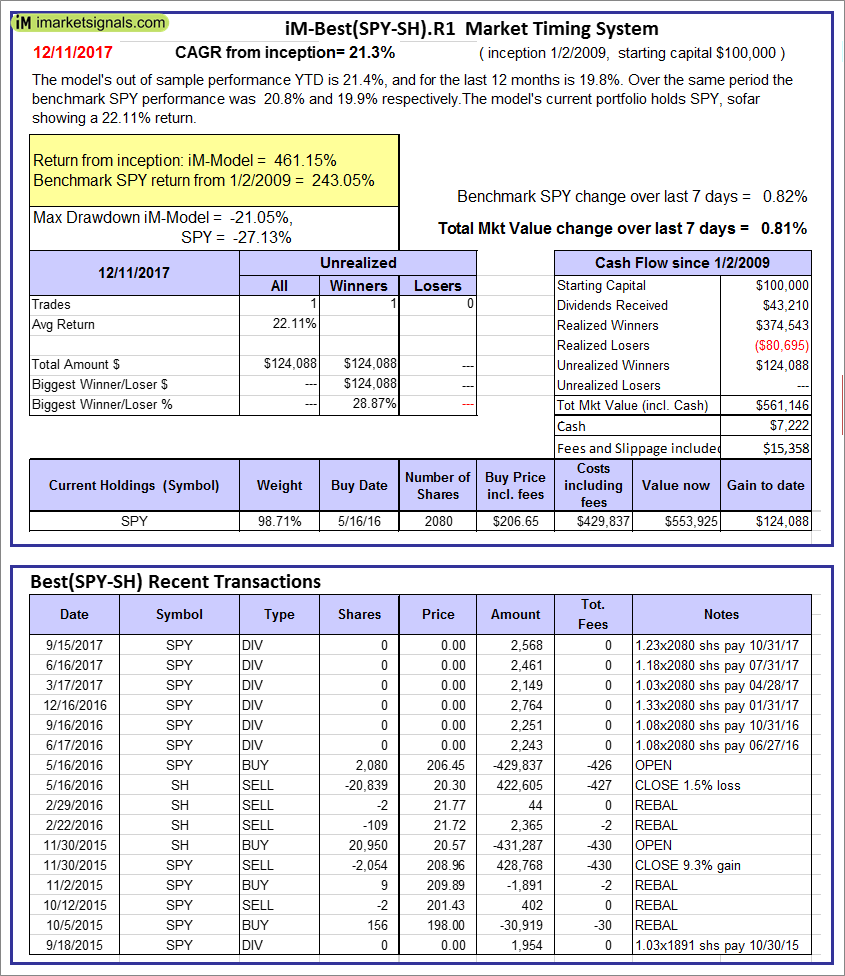
iM-Best(SPY-SH).R1: The model’s out of sample performance YTD is 0.7%, and for the last 12 months is 23.1%. Over the same period the benchmark SPY performance was 0.7% and 22.6% respectively. Over the previous week the market value of Best(SPY-SH) gained 0.58% at a time when SPY gained 0.59%. A starting capital of $100,000 at inception on 1/2/2009 would have grown to $566,263 which includes $7,222 cash and excludes $15,358 spent on fees and slippage. |
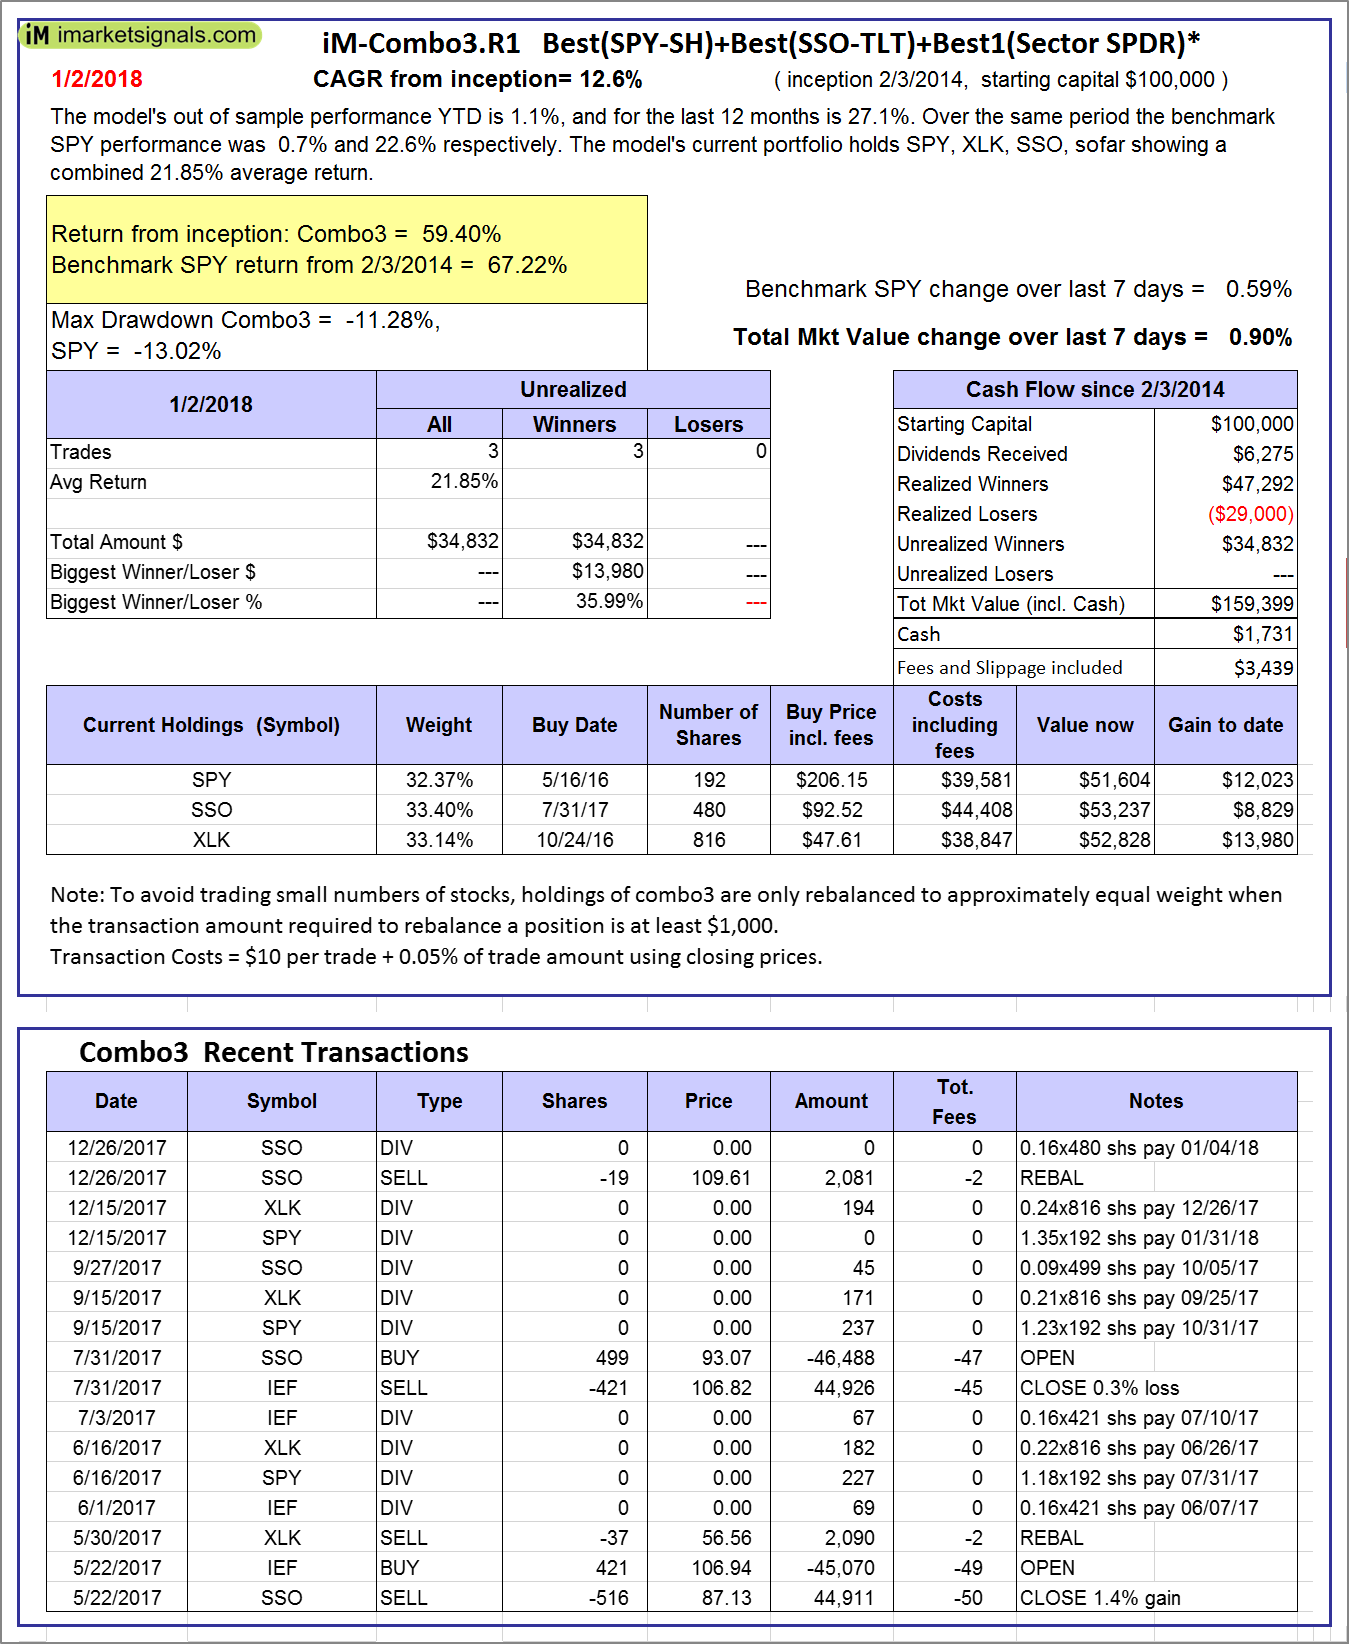 |
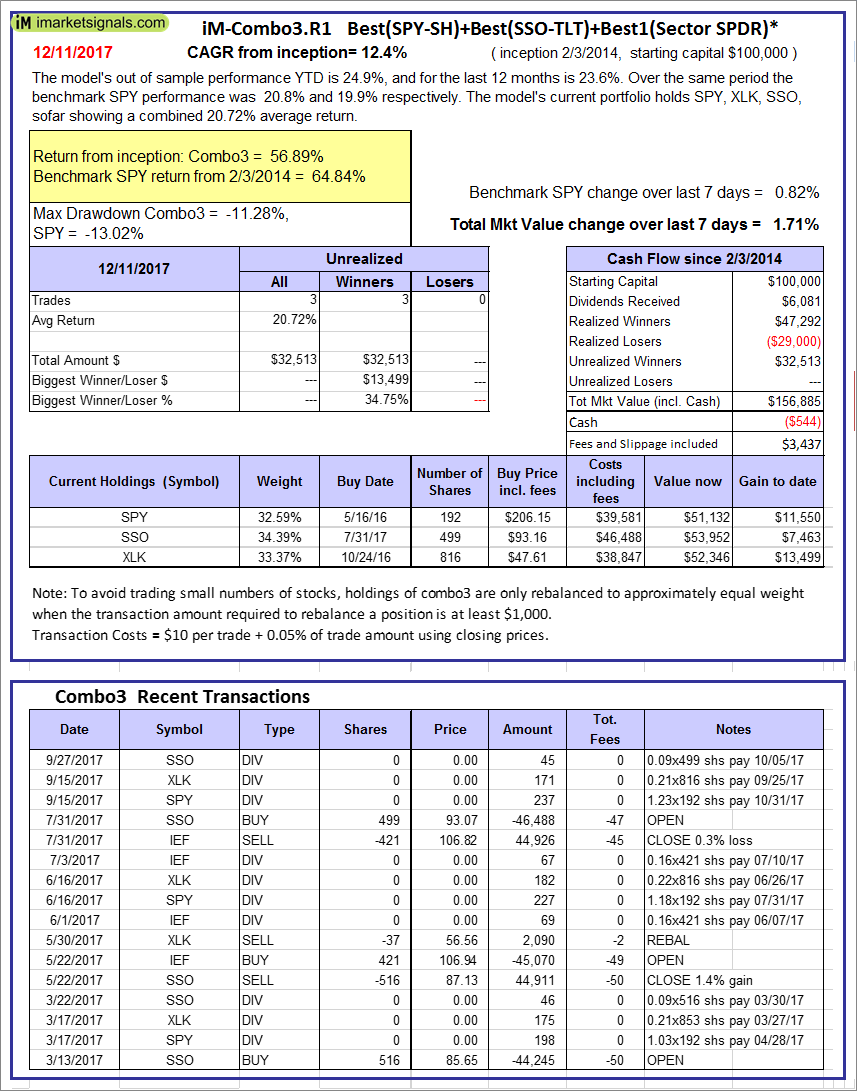
iM-Combo3.R1: The model’s out of sample performance YTD is 1.1%, and for the last 12 months is 27.1%. Over the same period the benchmark SPY performance was 0.7% and 22.6% respectively. Over the previous week the market value of iM-Combo3.R1 gained 0.90% at a time when SPY gained 0.59%. A starting capital of $100,000 at inception on 2/3/2014 would have grown to $159,399 which includes $1,731 cash and excludes $3,439 spent on fees and slippage. |
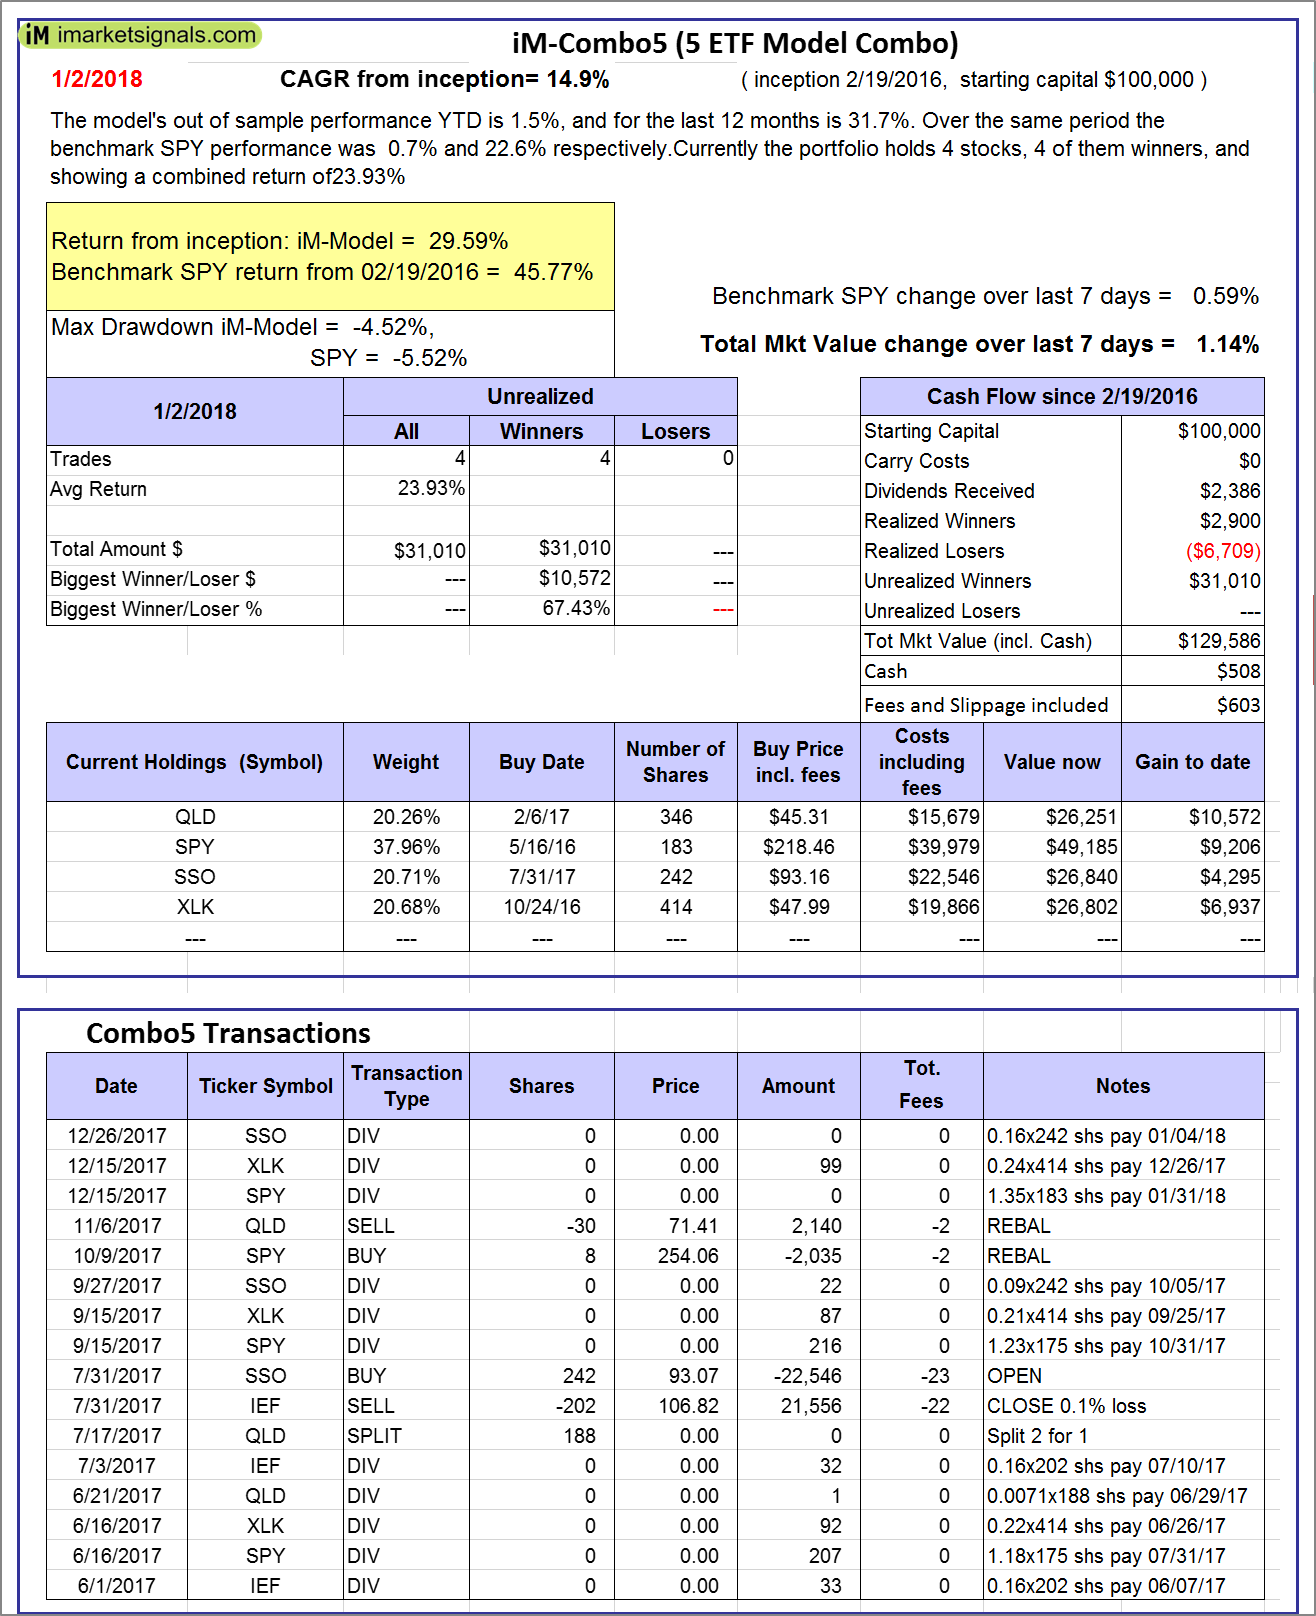 |
iM-Combo5: The model’s out of sample performance YTD is 1.5%, and for the last 12 months is 31.7%. Over the same period the benchmark SPY performance was 0.7% and 22.6% respectively. Over the previous week the market value of iM-Combo5 gained 1.14% at a time when SPY gained 0.59%. A starting capital of $100,000 at inception on 2/22/2016 would have grown to $129,586 which includes $508 cash and excludes $603 spent on fees and slippage. |
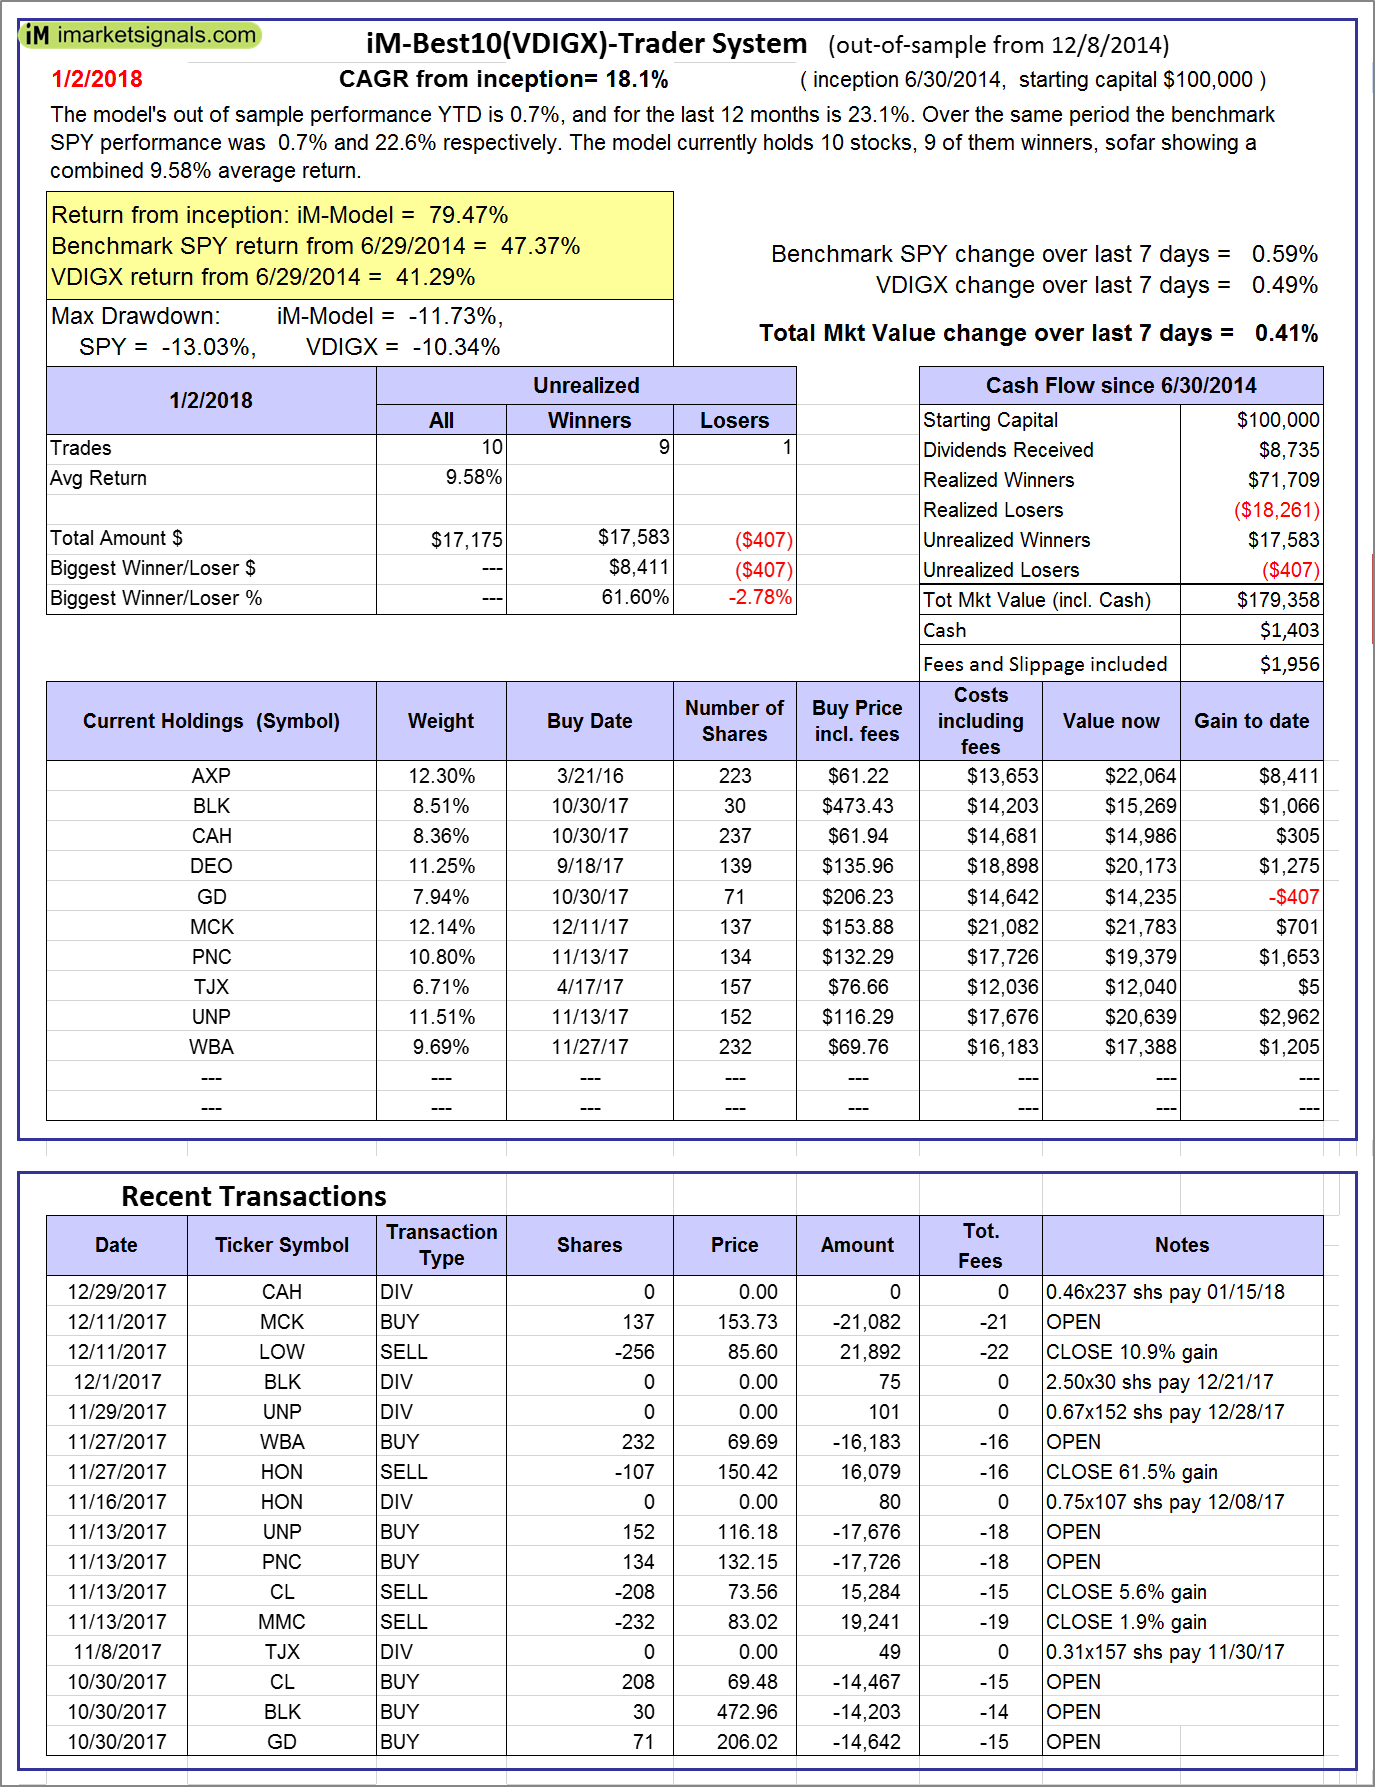 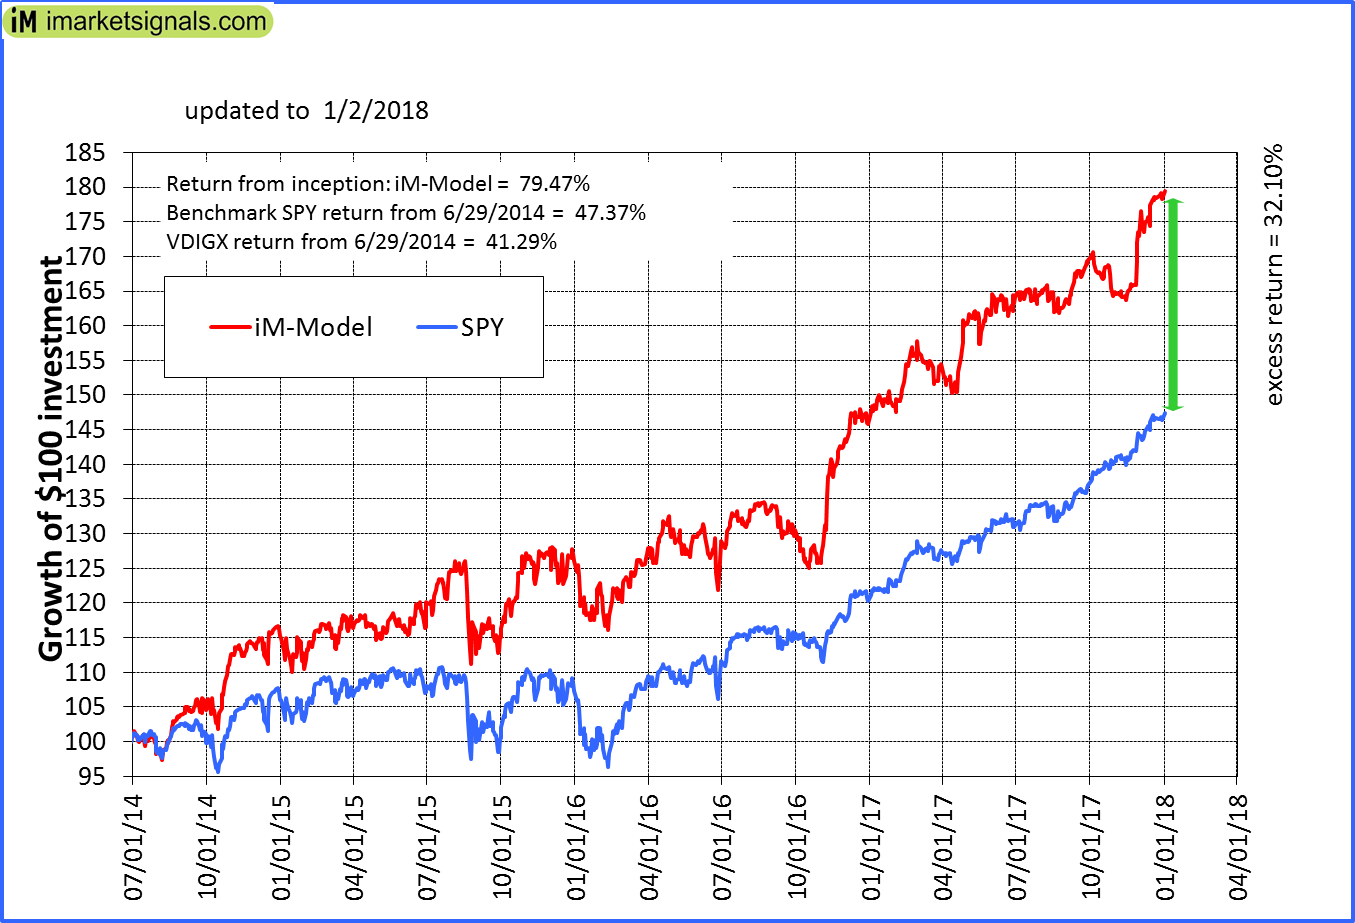 |
iM-Best10(VDIGX)-Trader: The model’s out of sample performance YTD is 0.7%, and for the last 12 months is 23.1%. Over the same period the benchmark SPY performance was 0.7% and 22.6% respectively. Since inception, on 7/1/2014, the model gained 79.47% while the benchmark SPY gained 47.37% and VDIGX gained 41.29% over the same period. Over the previous week the market value of iM-Best10(VDIGX) gained 0.41% at a time when SPY gained 0.59%. A starting capital of $100,000 at inception on 7/1/2014 would have grown to $179,358 which includes $1,403 cash and excludes $1,956 spent on fees and slippage. |
 |
iM-BESTOGA-3: The model’s out of sample performance YTD is -0.2%, and for the last 12 months is 14.3%. Over the same period the benchmark SPY performance was 0.7% and 22.6% respectively. Over the previous week the market value of iM-BESTOGA-3 gained -0.39% at a time when SPY gained 0.59%. A starting capital of $100,000 at inception on 2/3/2014 would have grown to $230,614 which includes $1,589 cash and excludes $1,818 spent on fees and slippage. |
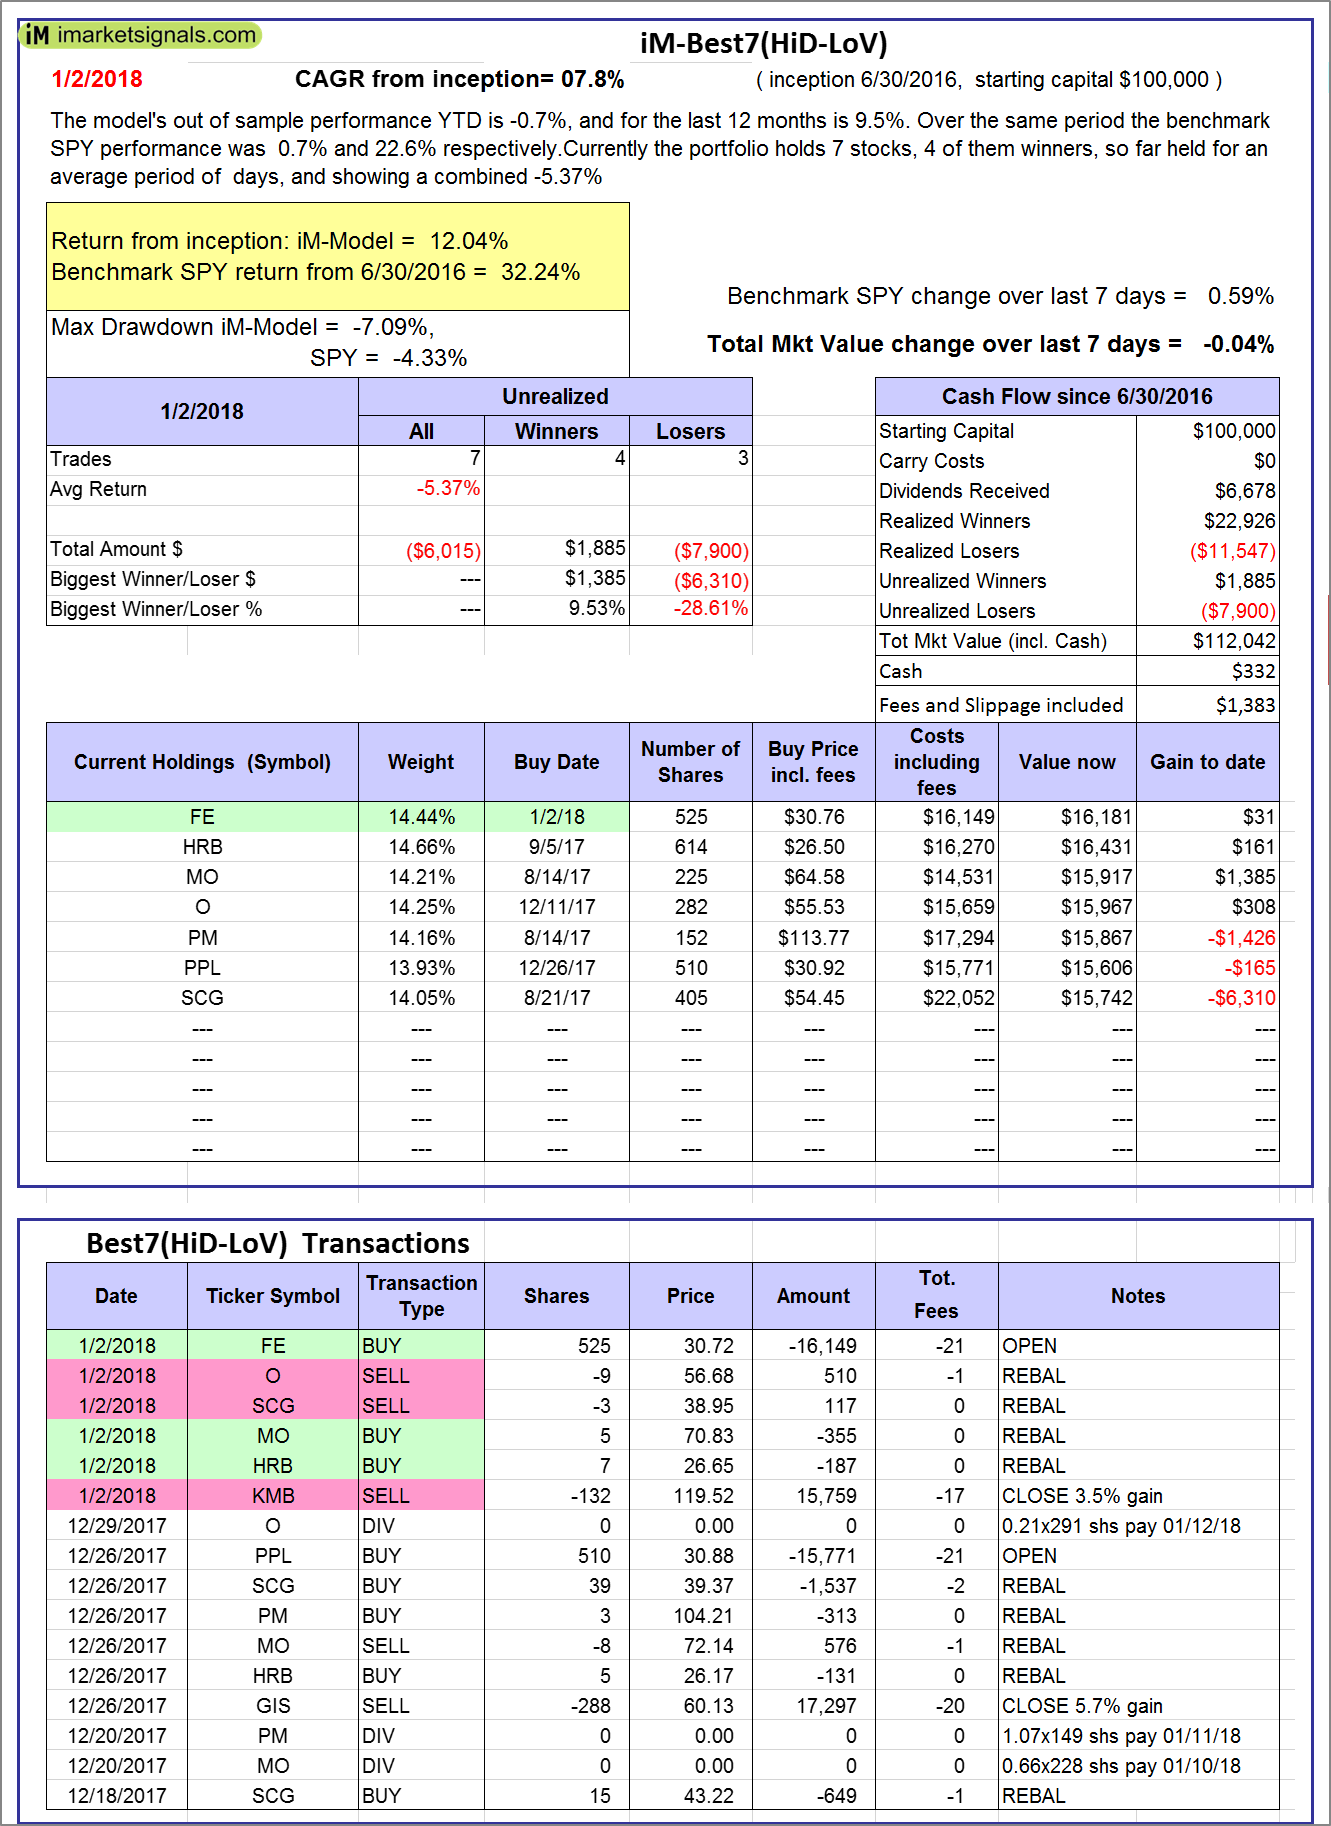 |
iM-Best7(HiD-LoV): The model’s out of sample performance YTD is -0.7%, and for the last 12 months is 9.5%. Over the same period the benchmark SPY performance was 0.7% and 22.6% respectively. Over the previous week the market value of iM-BESTOGA-3 gained -0.04% at a time when SPY gained 0.59%. A starting capital of $100,000 at inception on 6/30/2016 would have grown to $112,042 which includes $332 cash and excludes $1,383 spent on fees and slippage. |
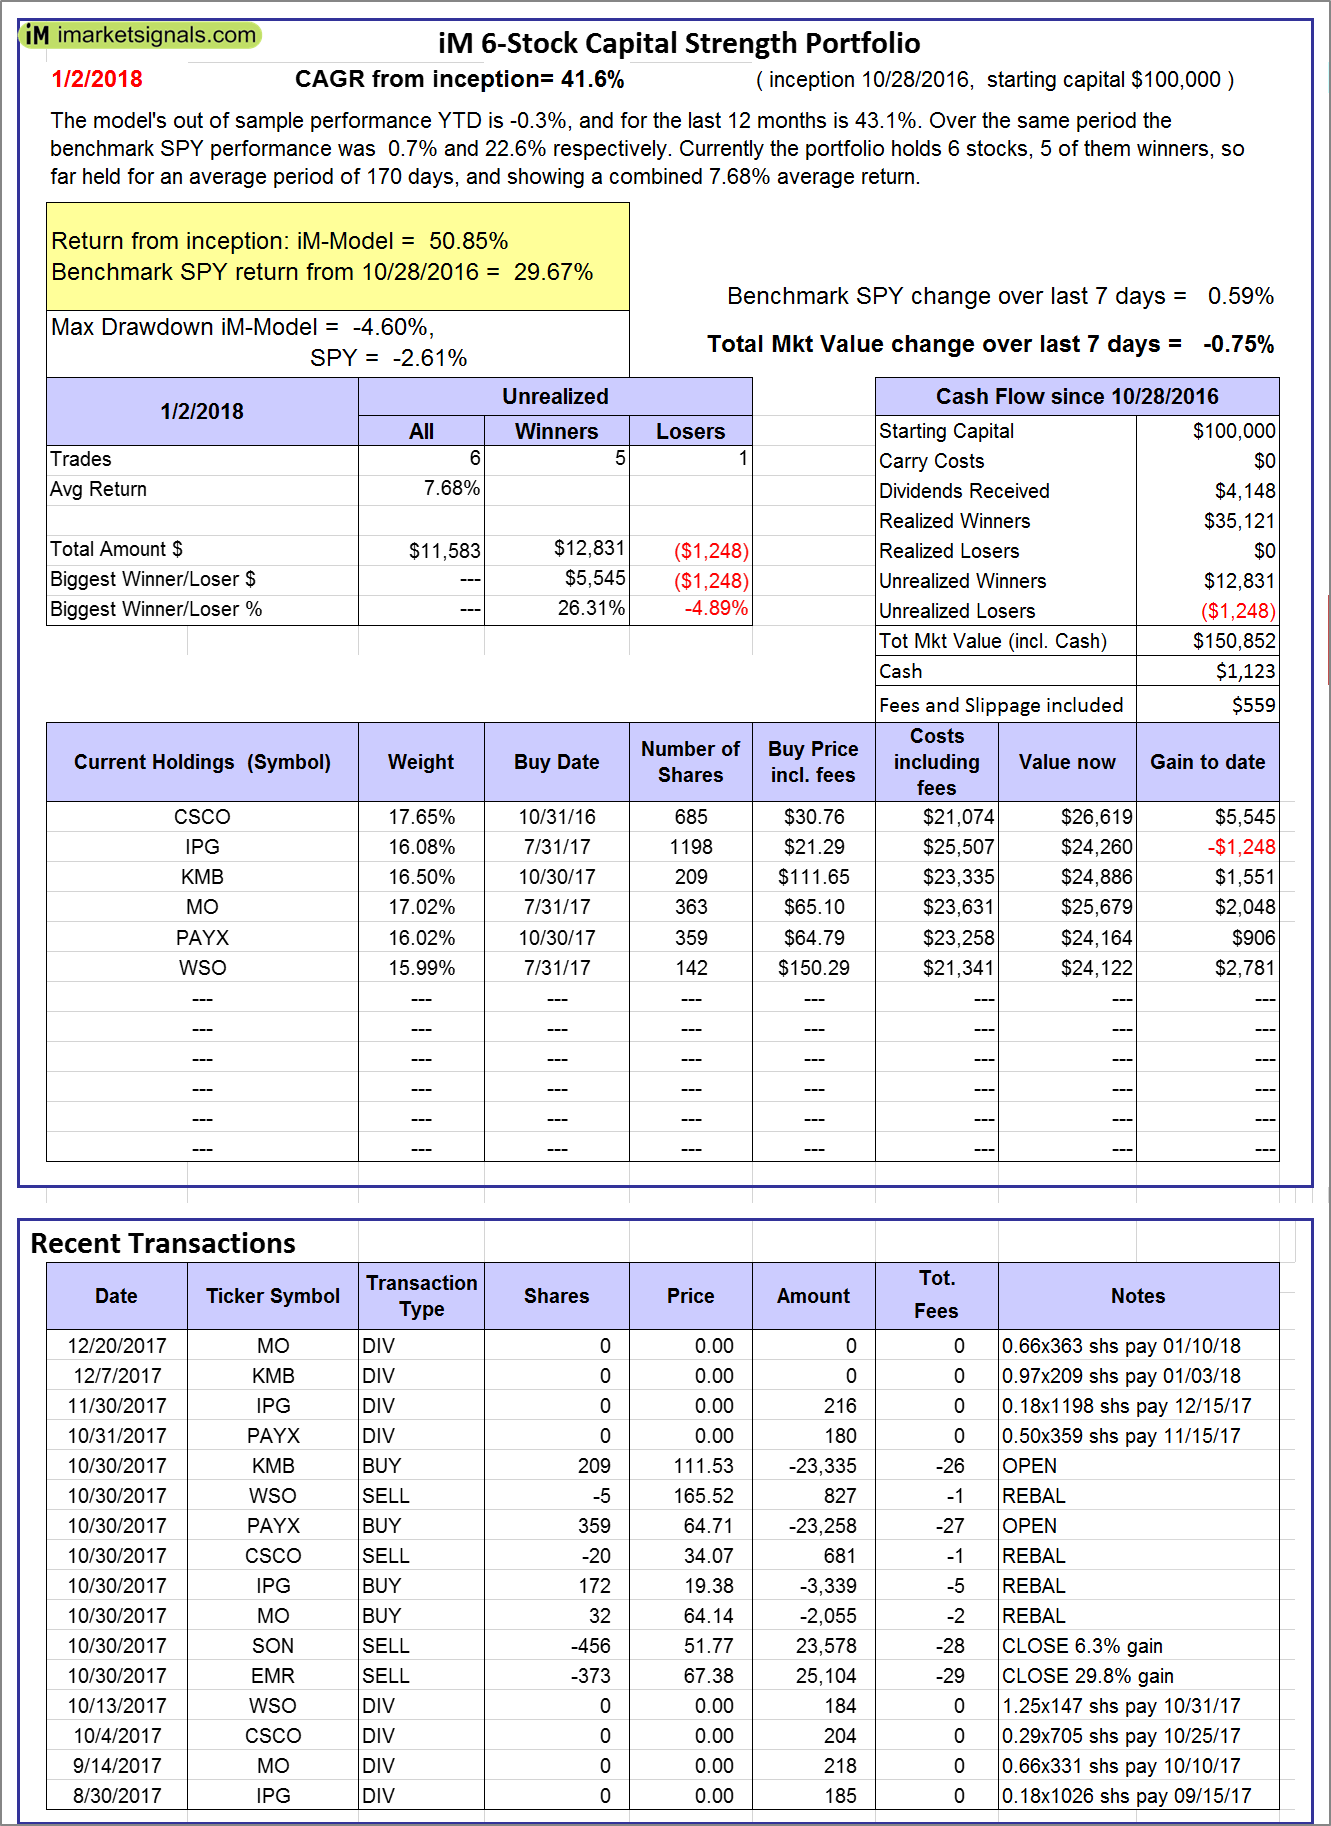 |
iM 6-Stock Capital Strength Portfolio: The model’s out of sample performance YTD is -0.3%, and for the last 12 months is 43.1%. Over the same period the benchmark SPY performance was 0.7% and 22.6% respectively. Over the previous week the market value of the iM 6-Stock Capital Strength Portfolio gained -0.75% at a time when SPY gained 0.59%. A starting capital of $100,000 at inception on 10/28/2016 would have grown to $150,852 which includes $1,123 cash and excludes $559 spent on fees and slippage. |
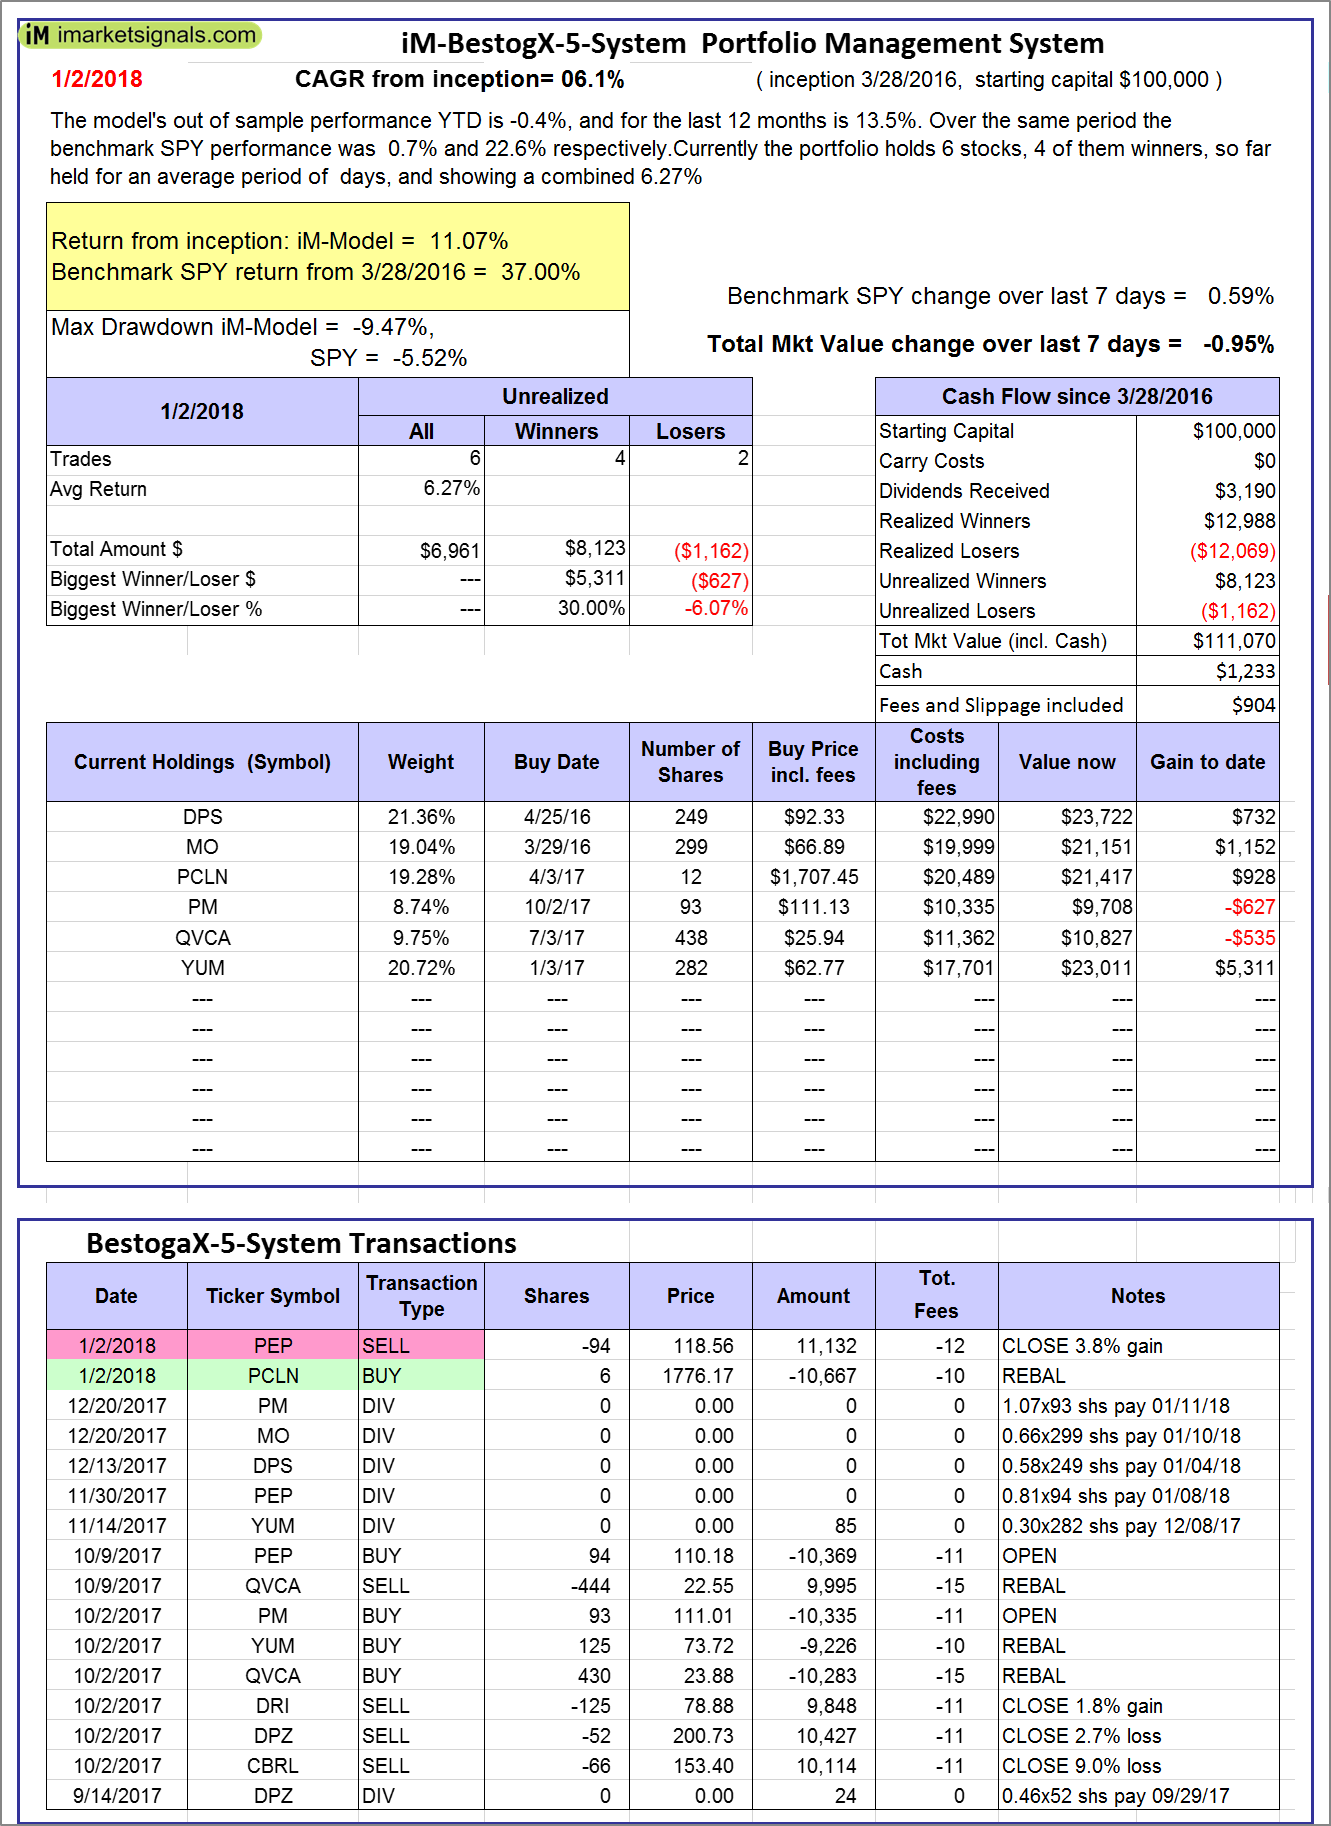 |
iM-BestogaX5-System: The model’s out of sample performance YTD is -0.4%, and for the last 12 months is 13.5%. Over the same period the benchmark SPY performance was 0.7% and 22.6% respectively. Over the previous week the market value of iM-Best8(S&P 500)Tax-Eff. gained -0.95% at a time when SPY gained 0.59%. A starting capital of $100,000 at inception on 3/28/2016 would have grown to $111,070 which includes $1,233 cash and excludes $904 spent on fees and slippage. |
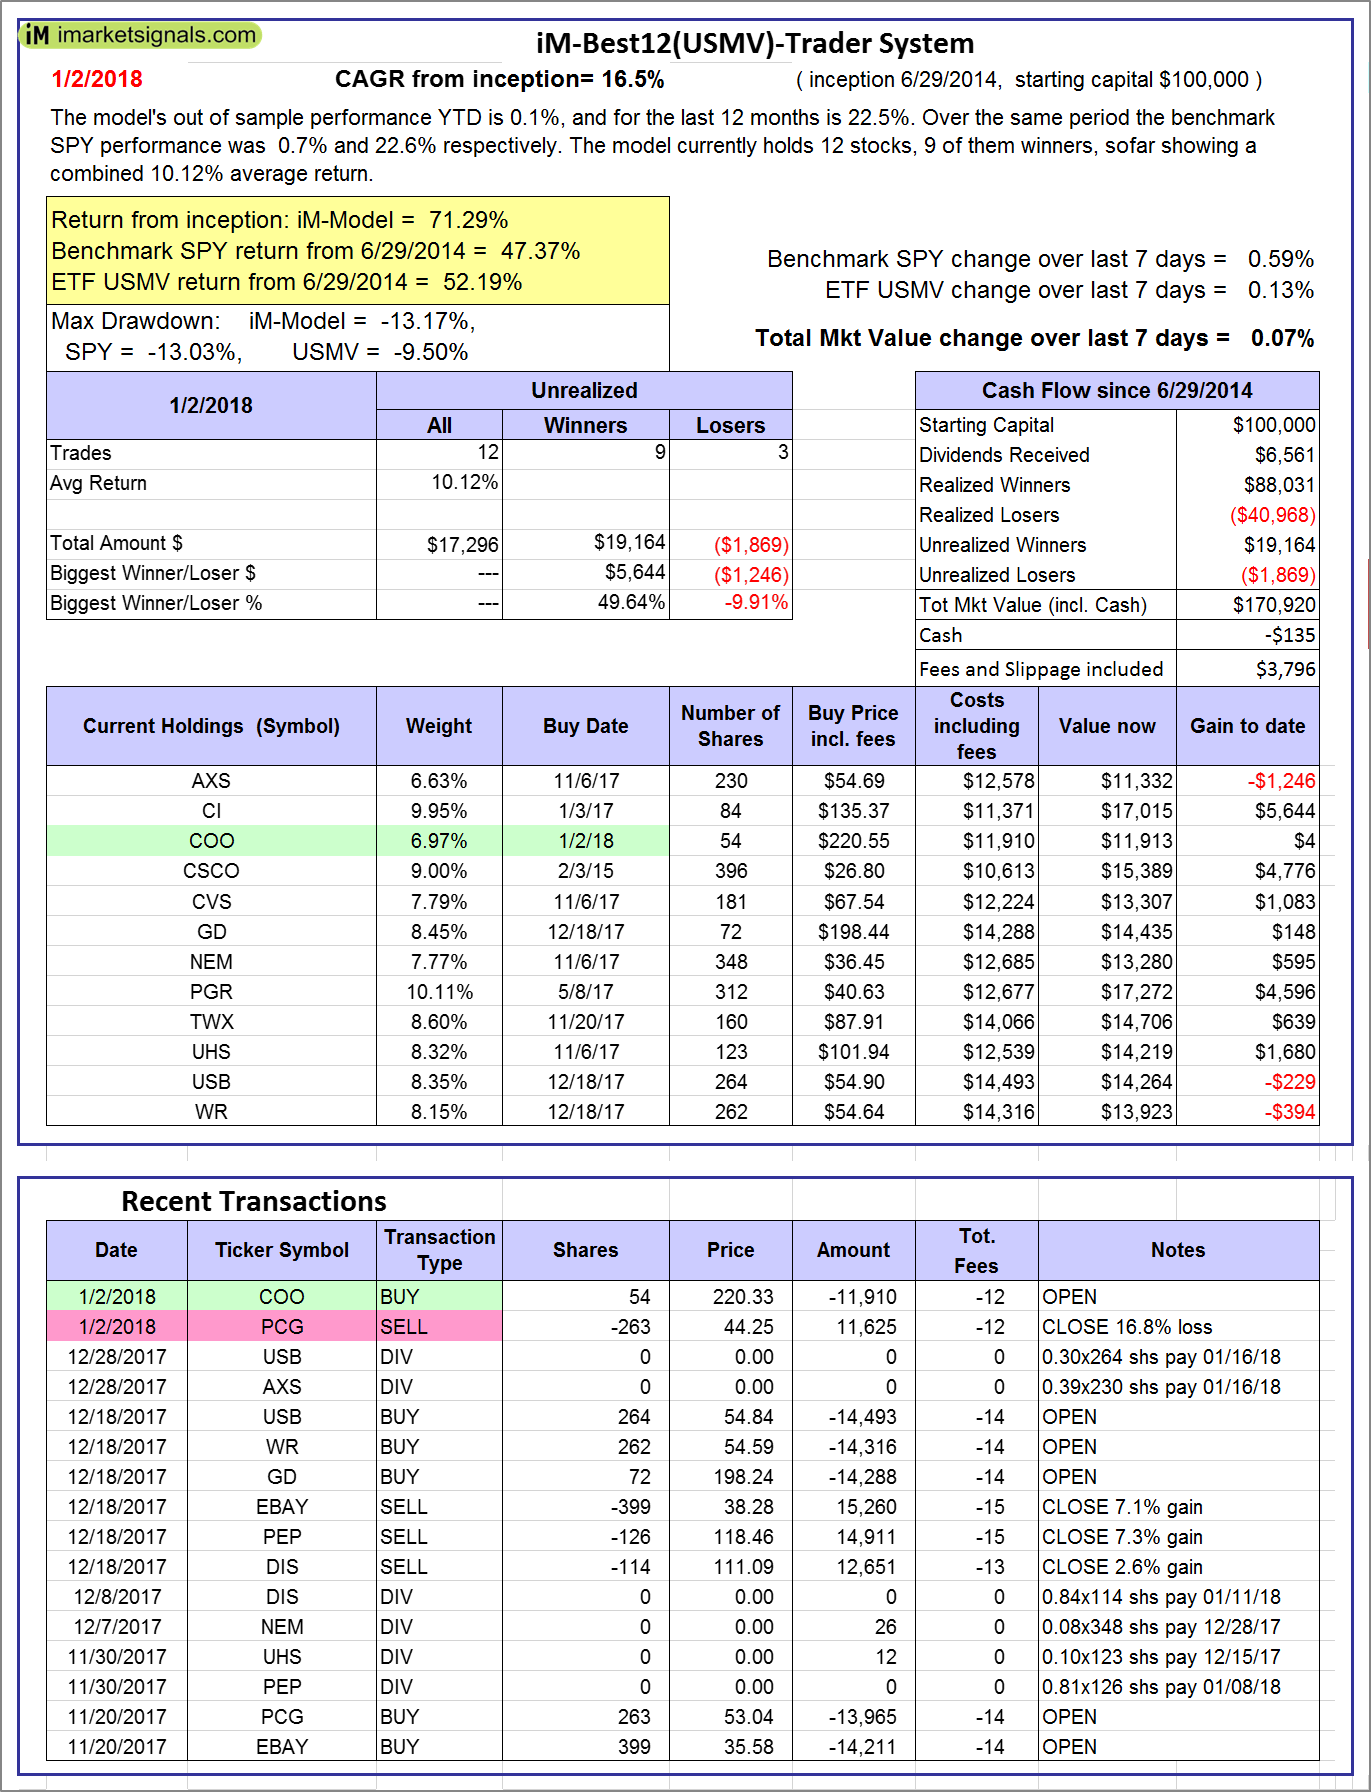 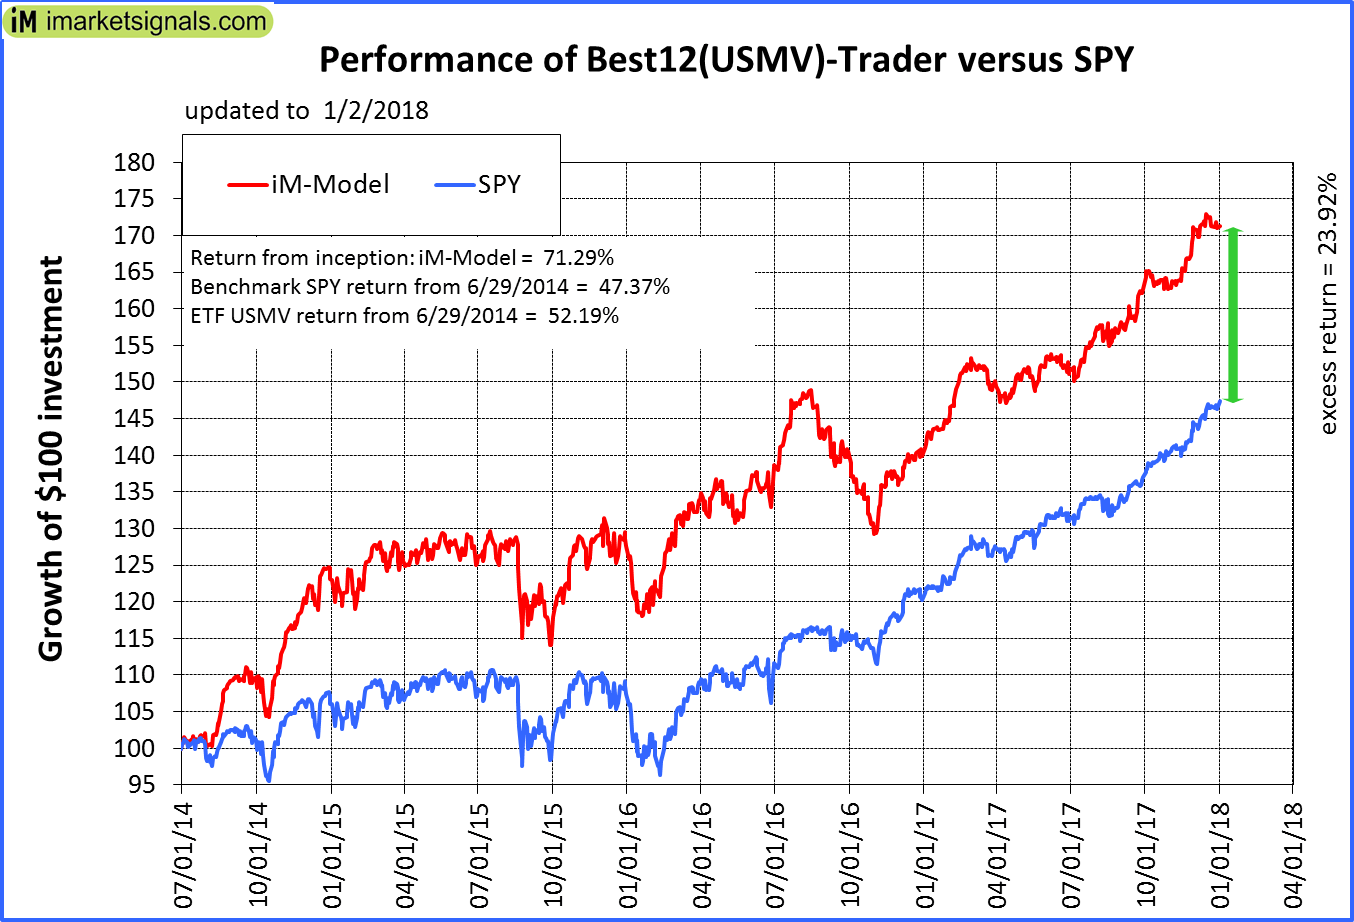 |
iM-Best12(USMV)-Trader: The model’s out of sample performance YTD is 0.1%, and for the last 12 months is 22.5%. Over the same period the benchmark SPY performance was 0.7% and 22.6% respectively. Since inception, on 6/30/2014, the model gained 71.29% while the benchmark SPY gained 47.37% and the ETF USMV gained 52.19% over the same period. Over the previous week the market value of iM-Best12(USMV)-Trader gained 0.07% at a time when SPY gained 0.59%. A starting capital of $100,000 at inception on 6/30/2014 would have grown to $170,920 which includes -$135 cash and excludes $3,796 spent on fees and slippage. |
 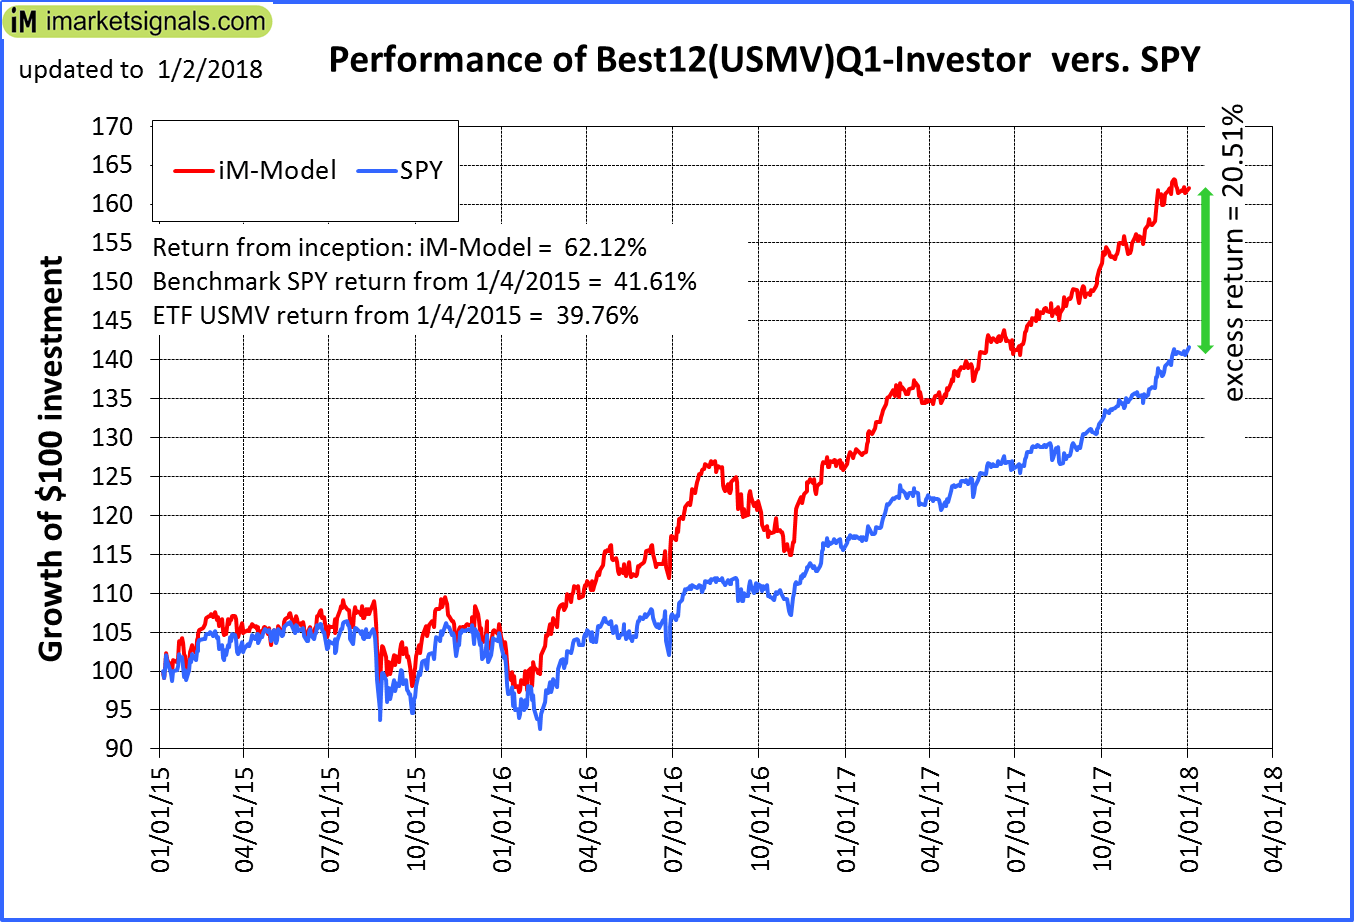 |
iM-Best12(USMV)Q1-Investor: The model’s out of sample performance YTD is 0.4%, and for the last 12 months is 28.8%. Over the same period the benchmark SPY performance was 0.7% and 22.6% respectively. Since inception, on 1/5/2015, the model gained 62.12% while the benchmark SPY gained 41.61% and the ETF USMV gained 39.76% over the same period. Over the previous week the market value of iM-Best12(USMV)Q1 gained 0.23% at a time when SPY gained 0.59%. A starting capital of $100,000 at inception on 1/5/2015 would have grown to $161,797 which includes $326 cash and excludes $871 spent on fees and slippage. |
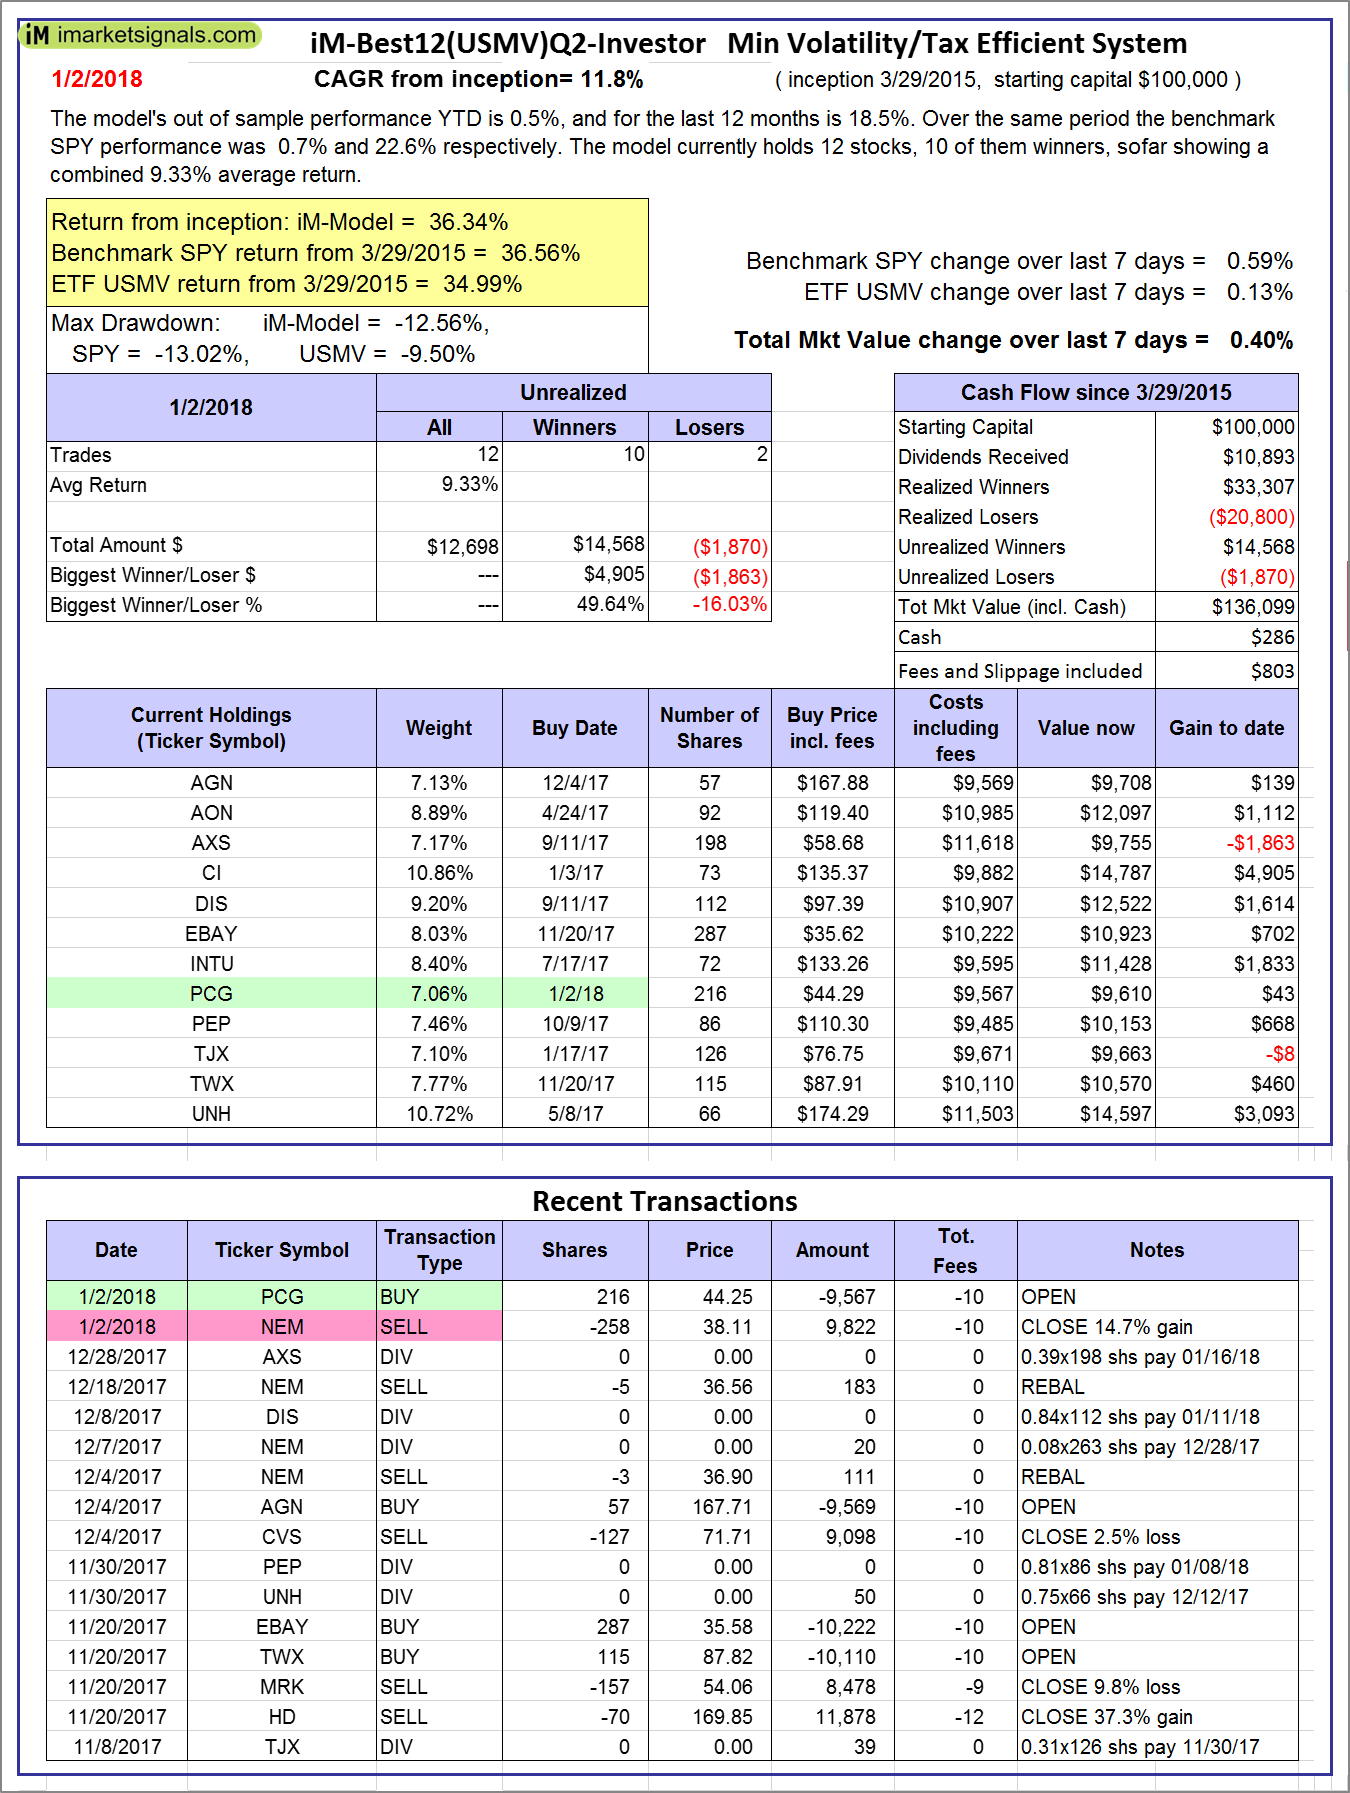 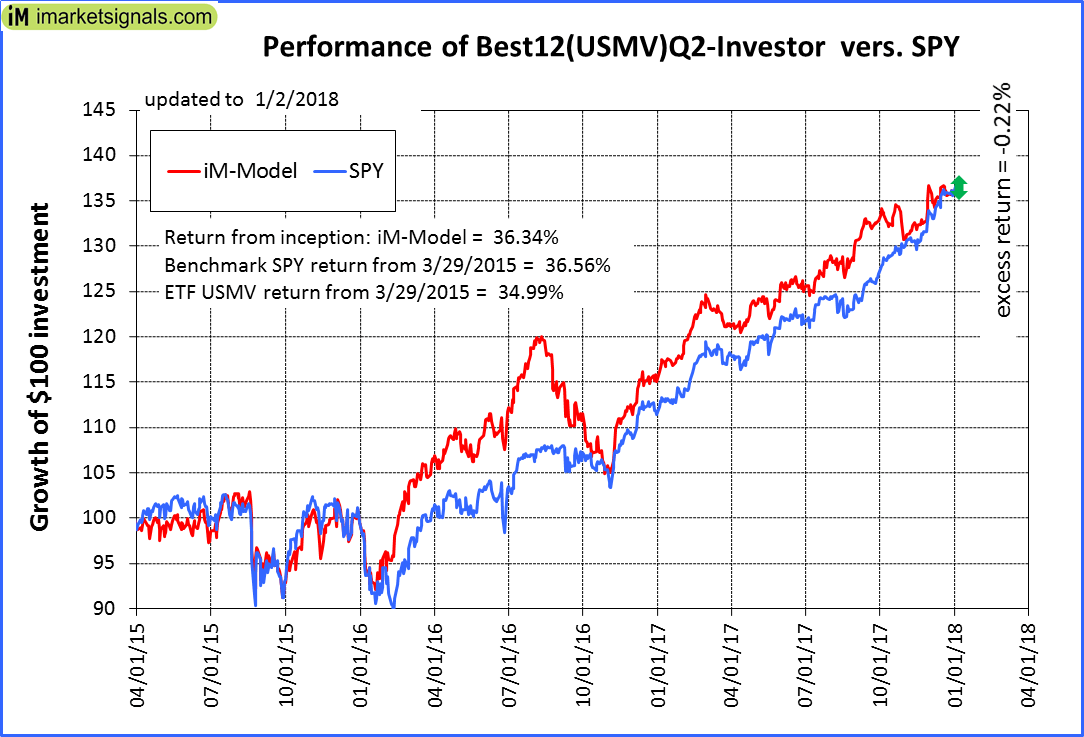 |
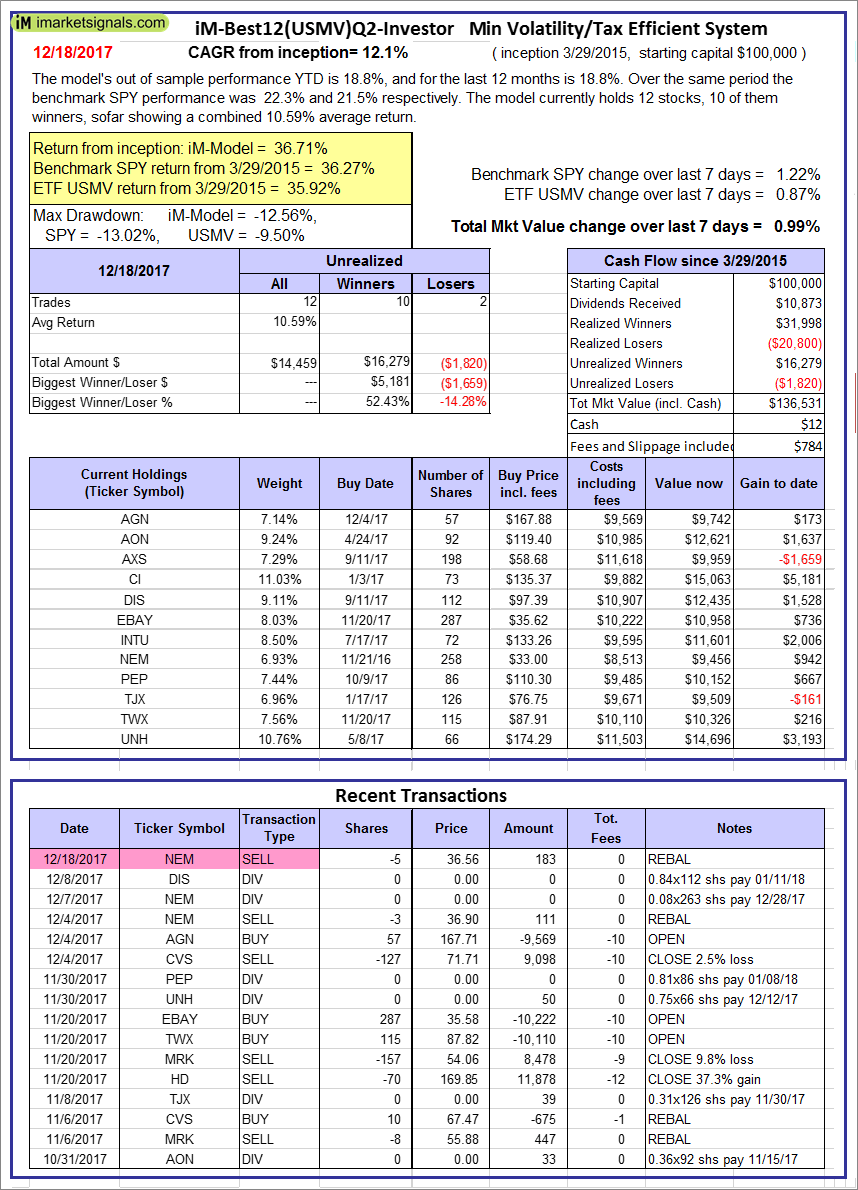
iM-Best12(USMV)Q2-Investor: The model’s out of sample performance YTD is 0.5%, and for the last 12 months is 18.5%. Over the same period the benchmark SPY performance was 0.7% and 22.6% respectively. Since inception, on 3/30/2015, the model gained 36.34% while the benchmark SPY gained 36.56% and the ETF USMV gained 34.99% over the same period. Over the previous week the market value of iM-Best12(USMV)Q2 gained 0.40% at a time when SPY gained 0.59%. A starting capital of $100,000 at inception on 3/30/2015 would have grown to $136,099 which includes $286 cash and excludes $803 spent on fees and slippage. |
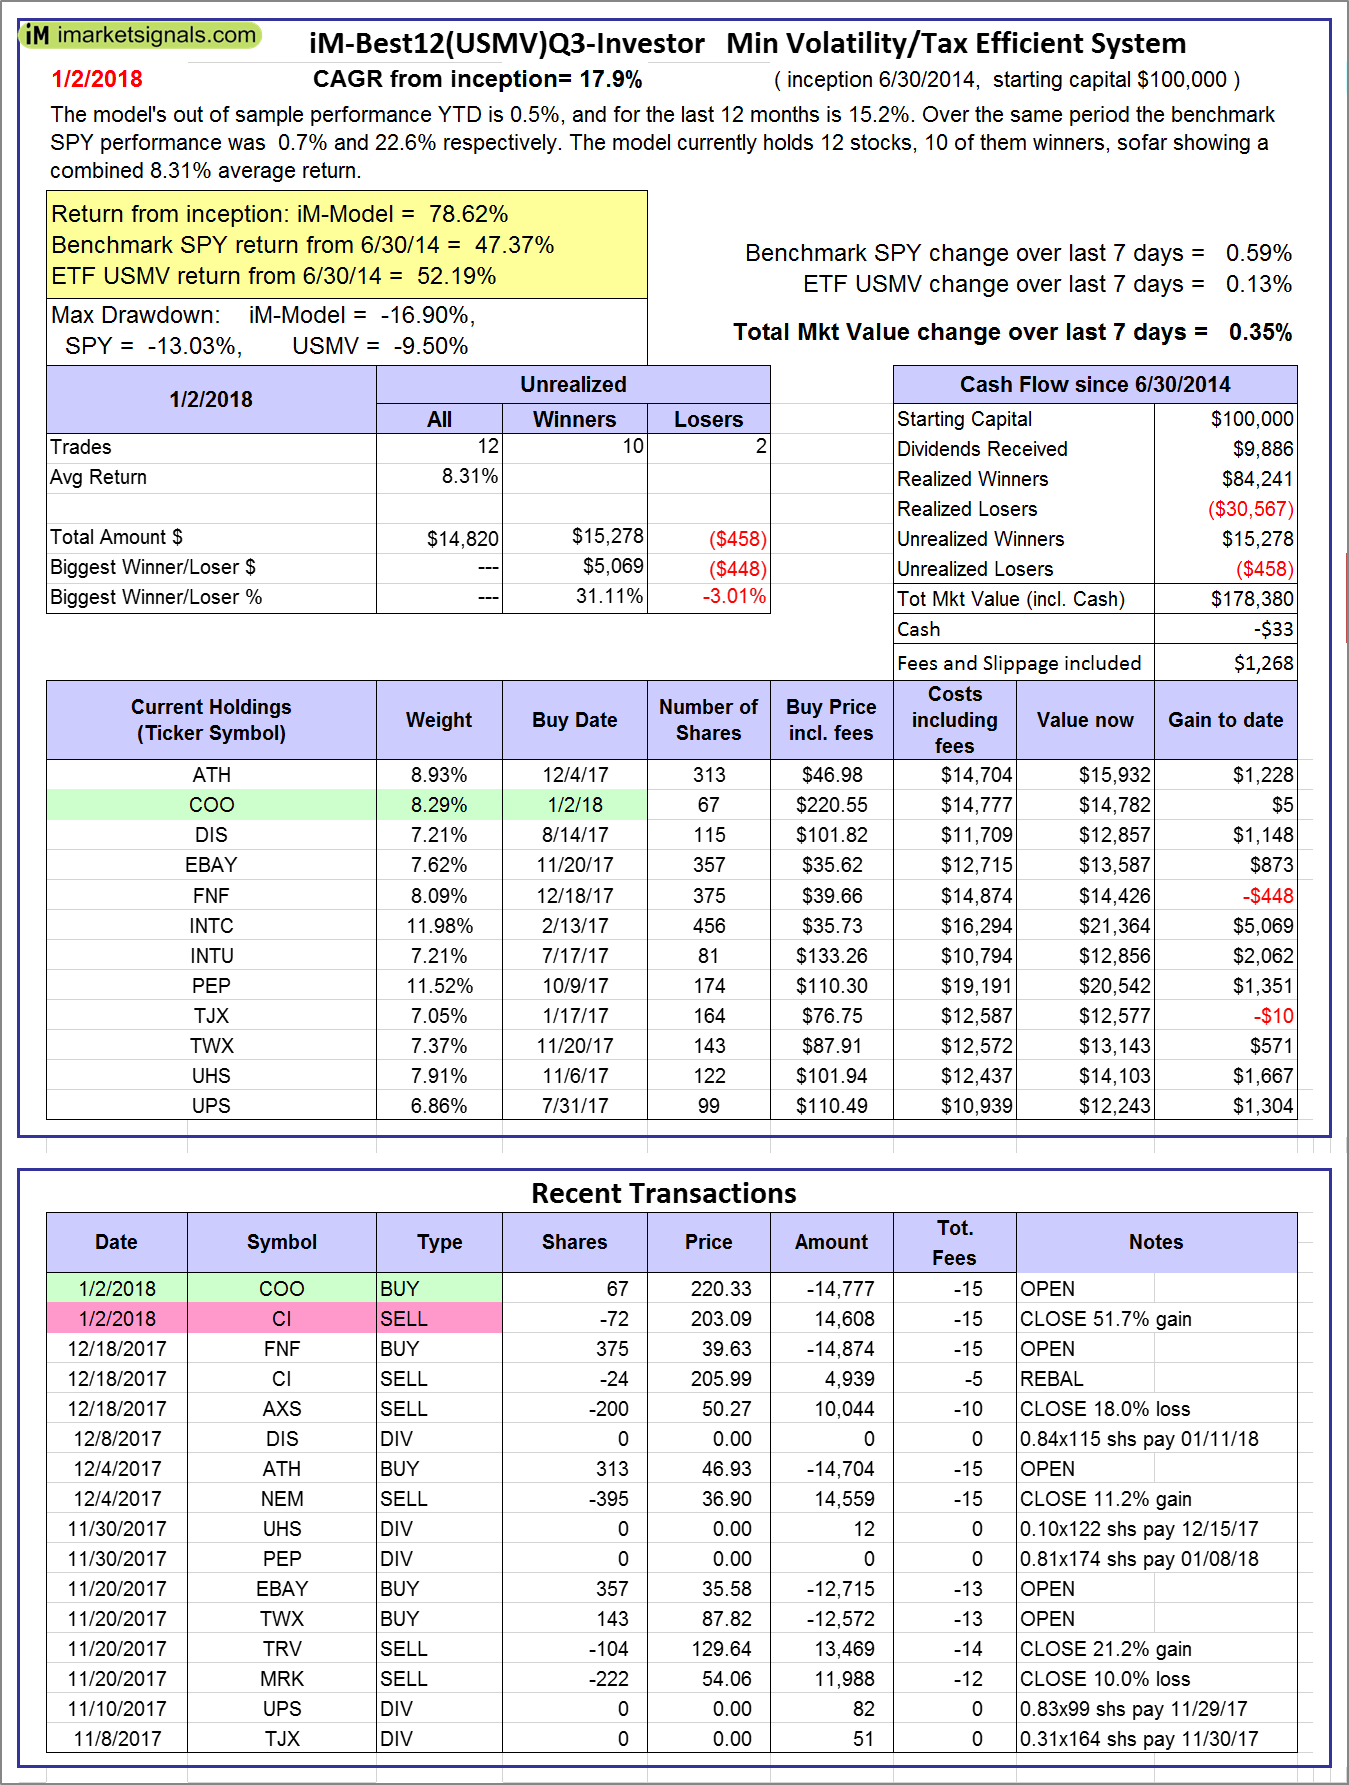 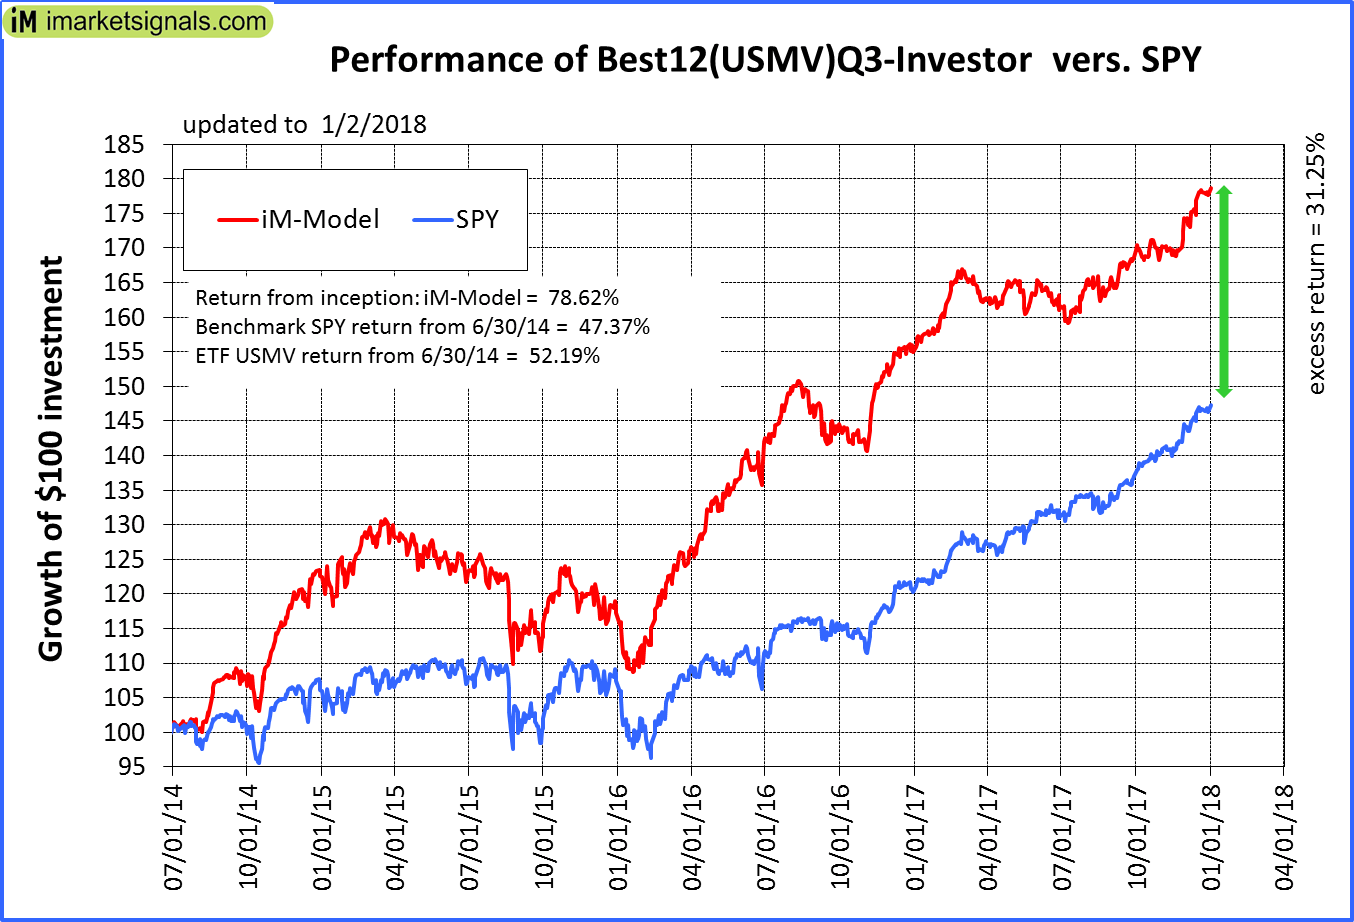 |
iM-Best12(USMV)Q3-Investor: The model’s out of sample performance YTD is 0.5%, and for the last 12 months is 15.2%. Over the same period the benchmark SPY performance was 0.7% and 22.6% respectively. Since inception, on 7/1/2014, the model gained 78.62% while the benchmark SPY gained 47.37% and the ETF USMV gained 52.19% over the same period. Over the previous week the market value of iM-Best12(USMV)Q3 gained 0.35% at a time when SPY gained 0.59%. A starting capital of $100,000 at inception on 7/1/2014 would have grown to $178,380 which includes -$33 cash and excludes $1,268 spent on fees and slippage. |
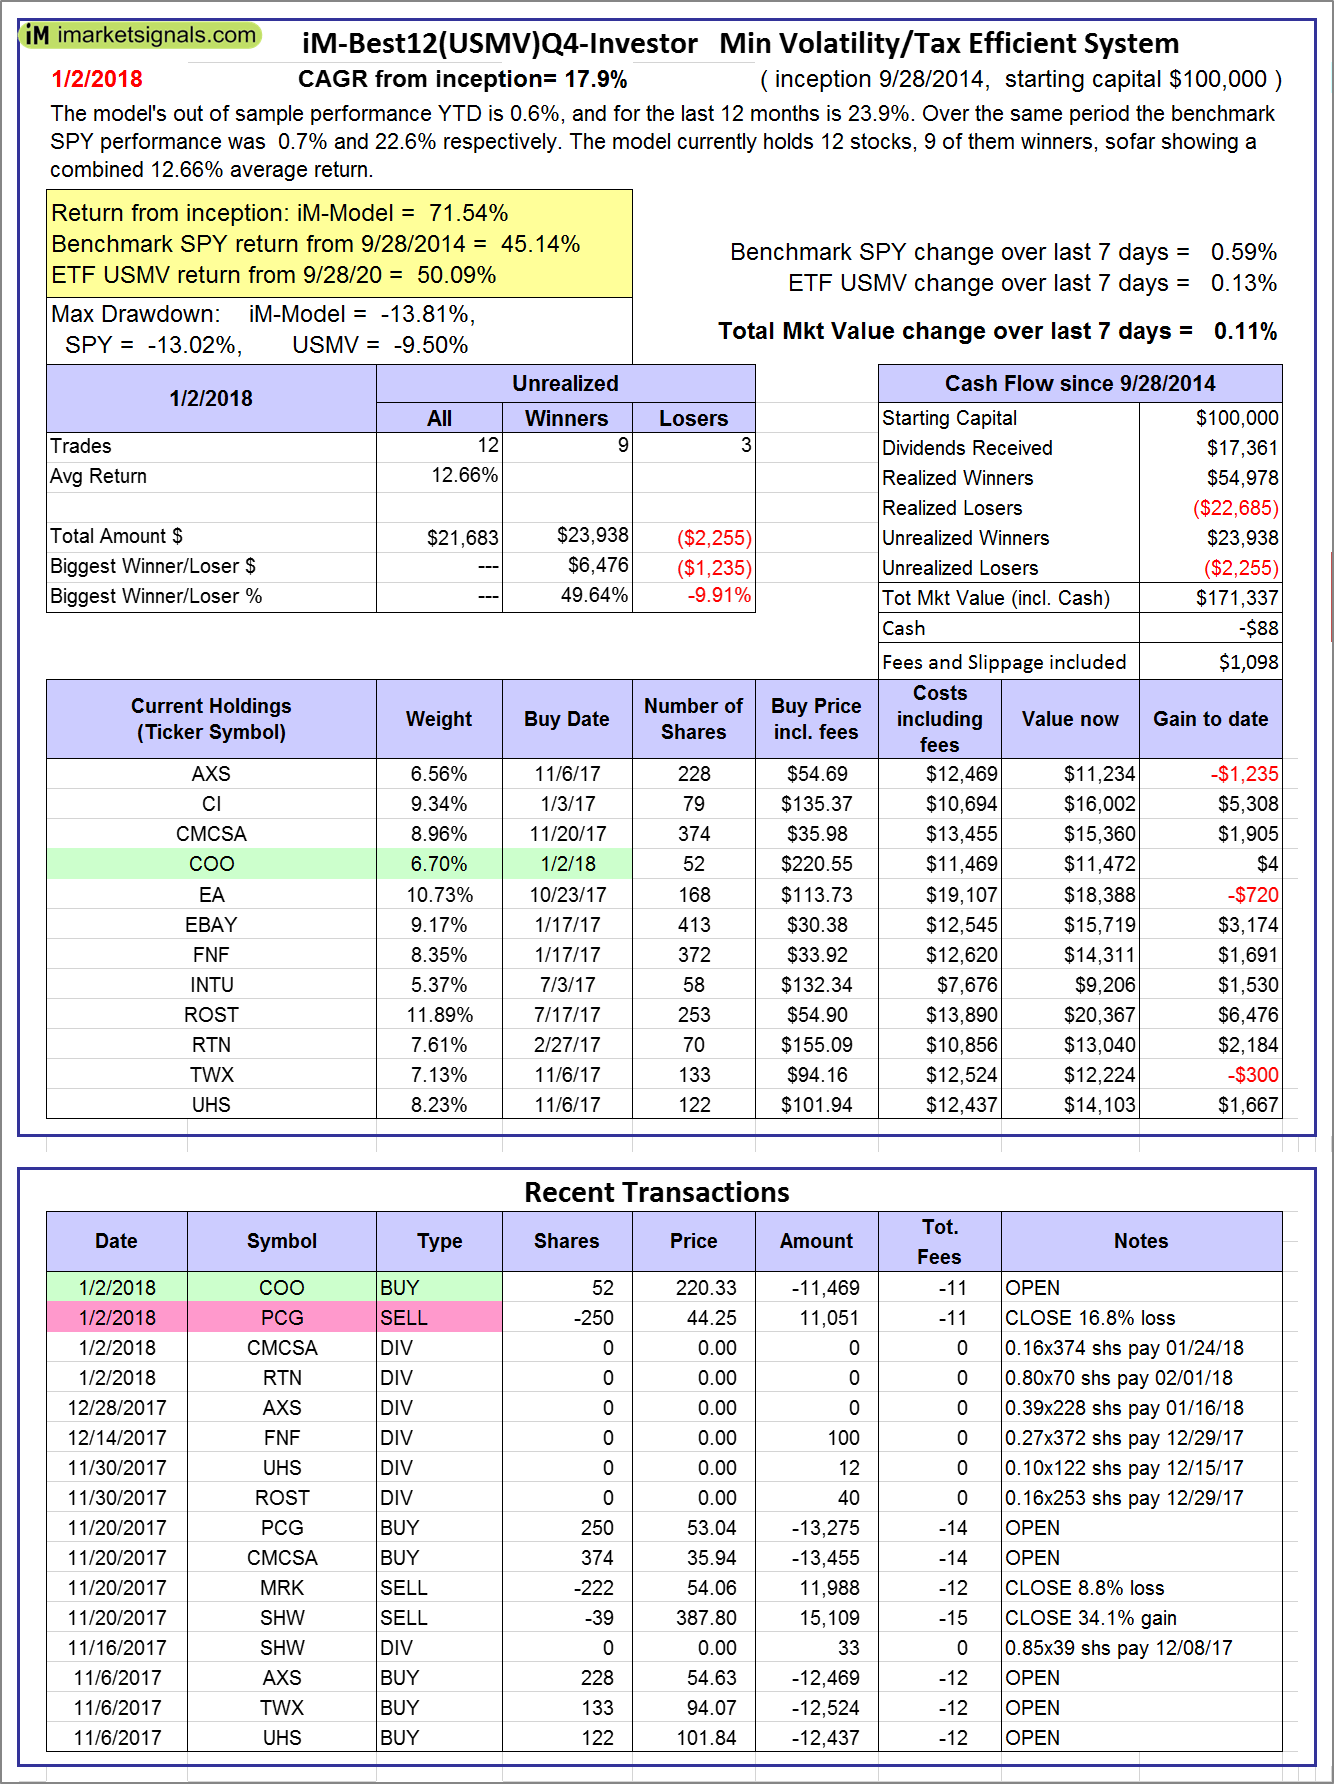 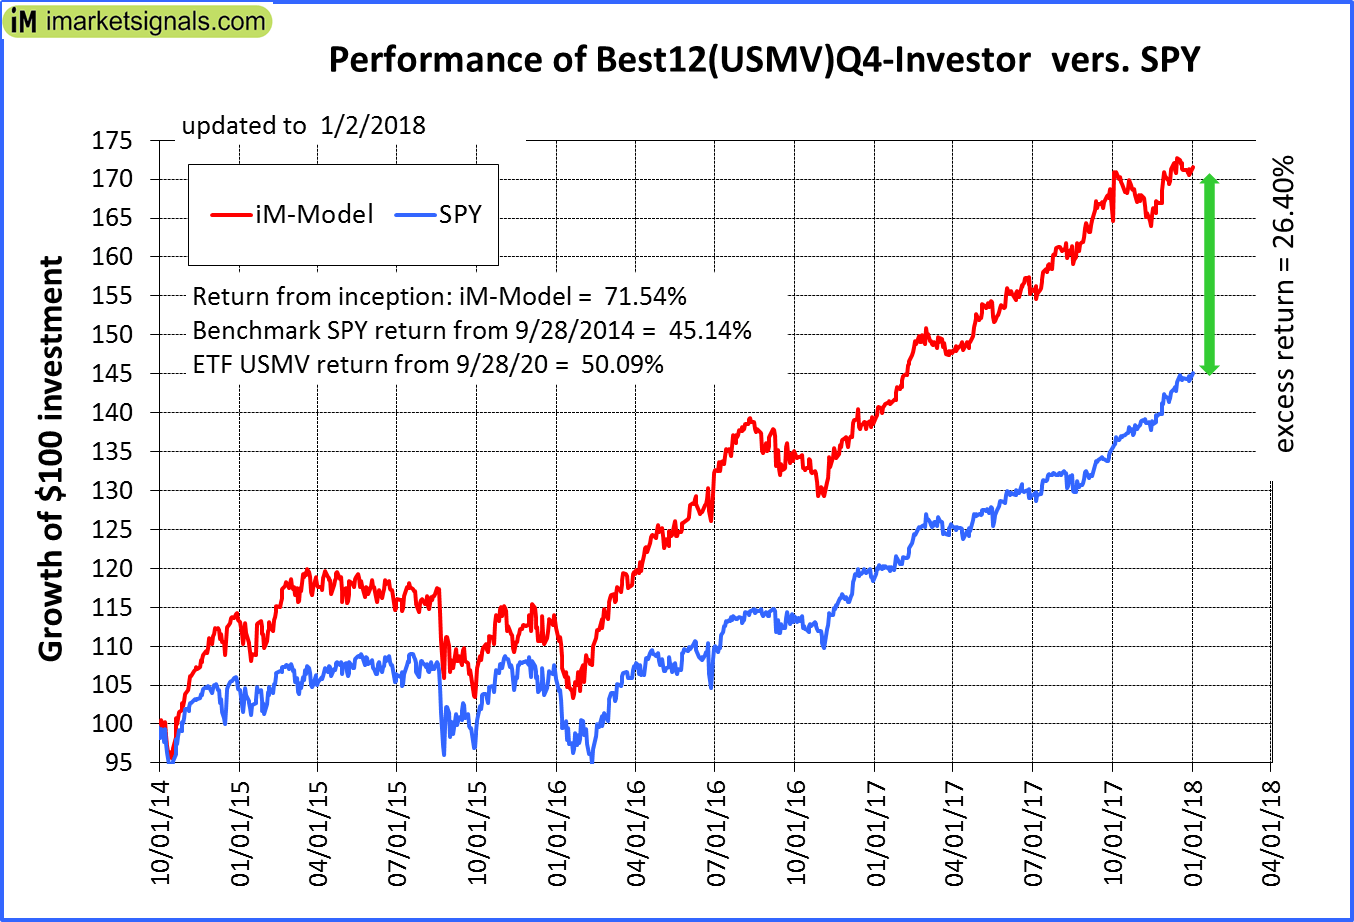 |
iM-Best12(USMV)Q4-Investor: Since inception, on 9/29/2014, the model gained 71.54% while the benchmark SPY gained 45.14% and the ETF USMV gained 50.09% over the same period. Over the previous week the market value of iM-Best12(USMV)Q4 gained 0.11% at a time when SPY gained 0.59%. A starting capital of $100,000 at inception on 9/29/2014 would have grown to $171,337 which includes -$88 cash and excludes $1,098 spent on fees and slippage. |
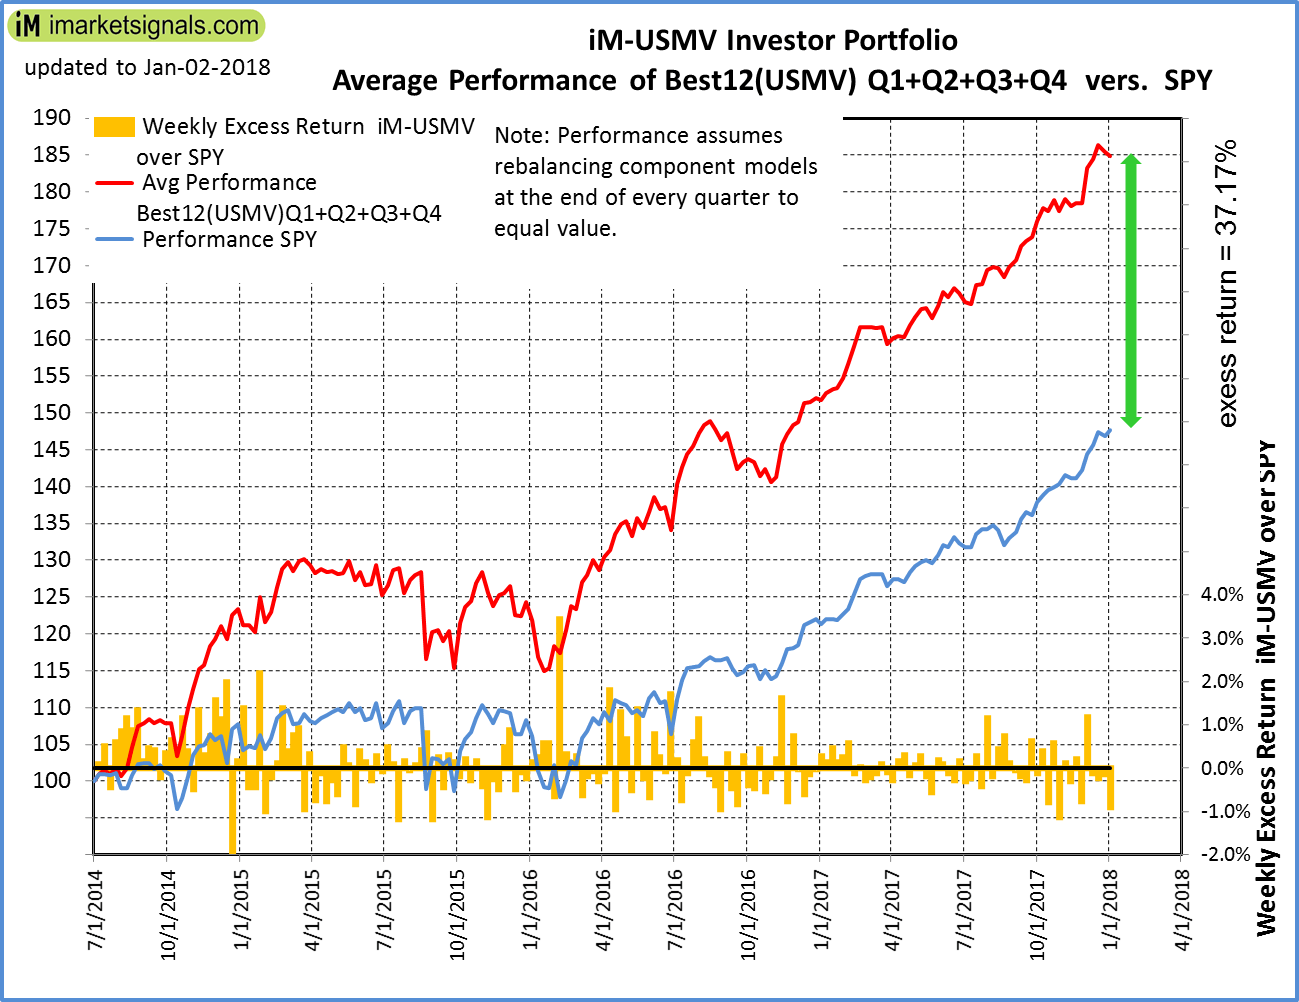 |
Average Performance of iM-Best12(USMV)Q1+Q2+Q3+Q4-Investor resulted in an excess return of 37.17% over SPY. (see iM-USMV Investor Portfolio) |
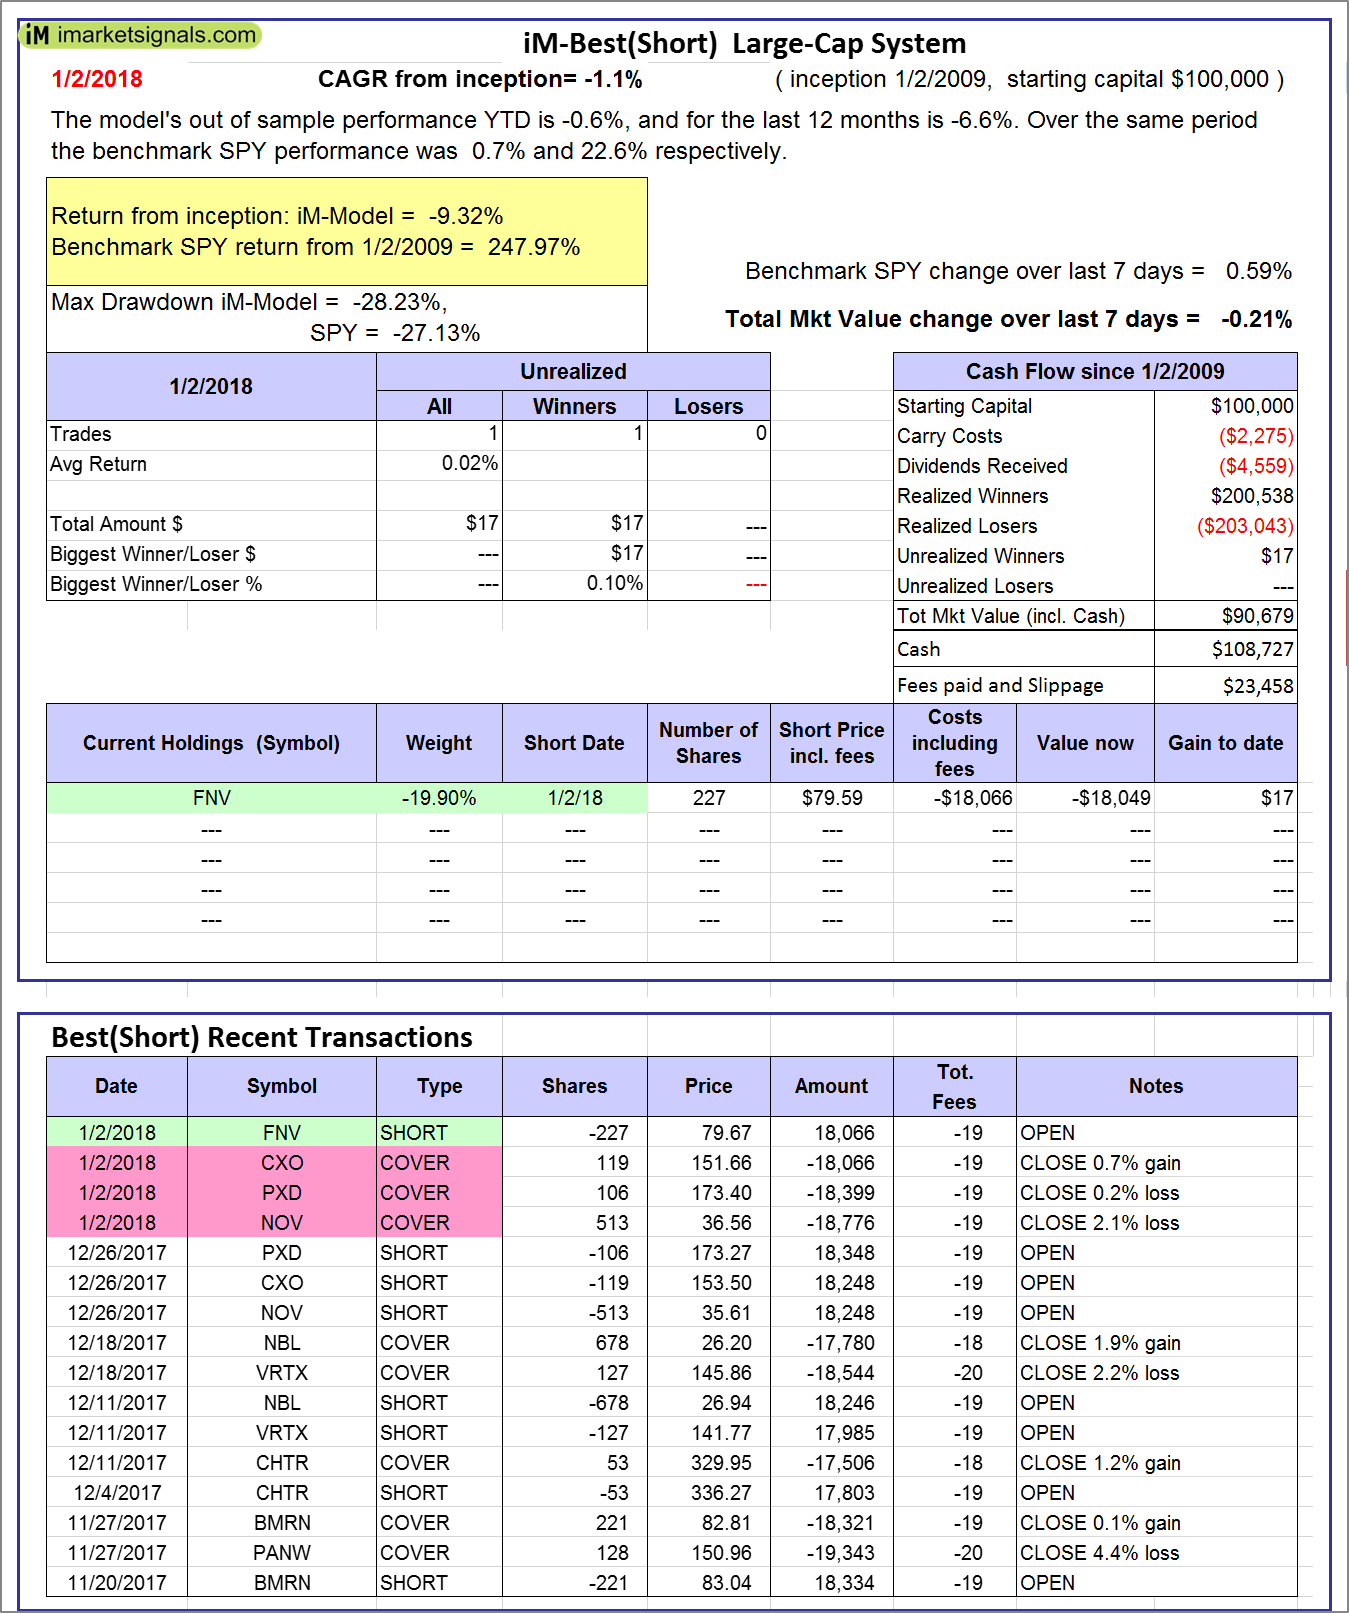 |
iM-Best(Short): The model’s out of sample performance YTD is -0.6%, and for the last 12 months is -6.6%. Over the same period the benchmark SPY performance was 0.7% and 22.6% respectively. Over the previous week the market value of iM-Best(Short) gained -0.21% at a time when SPY gained 0.59%. Over the period 1/2/2009 to 1/2/2018 the starting capital of $100,000 would have grown to $90,679 which includes $108,727 cash and excludes $23,458 spent on fees and slippage. |
 |
iM-Best2 MC-Score ETF System: The model’s out of sample performance YTD is -0.3%, and for the last 12 months is 15.5%. Over the same period the benchmark SPY performance was 0.7% and 22.6% respectively. Over the previous week the market value of the iM-Best2 MC-Score ETF System gained -0.35% at a time when SPY gained 0.59%. A starting capital of $100,000 at inception on 6/30/2016 would have grown to $112,002 which includes $743 cash and excludes $115 spent on fees and slippage. |
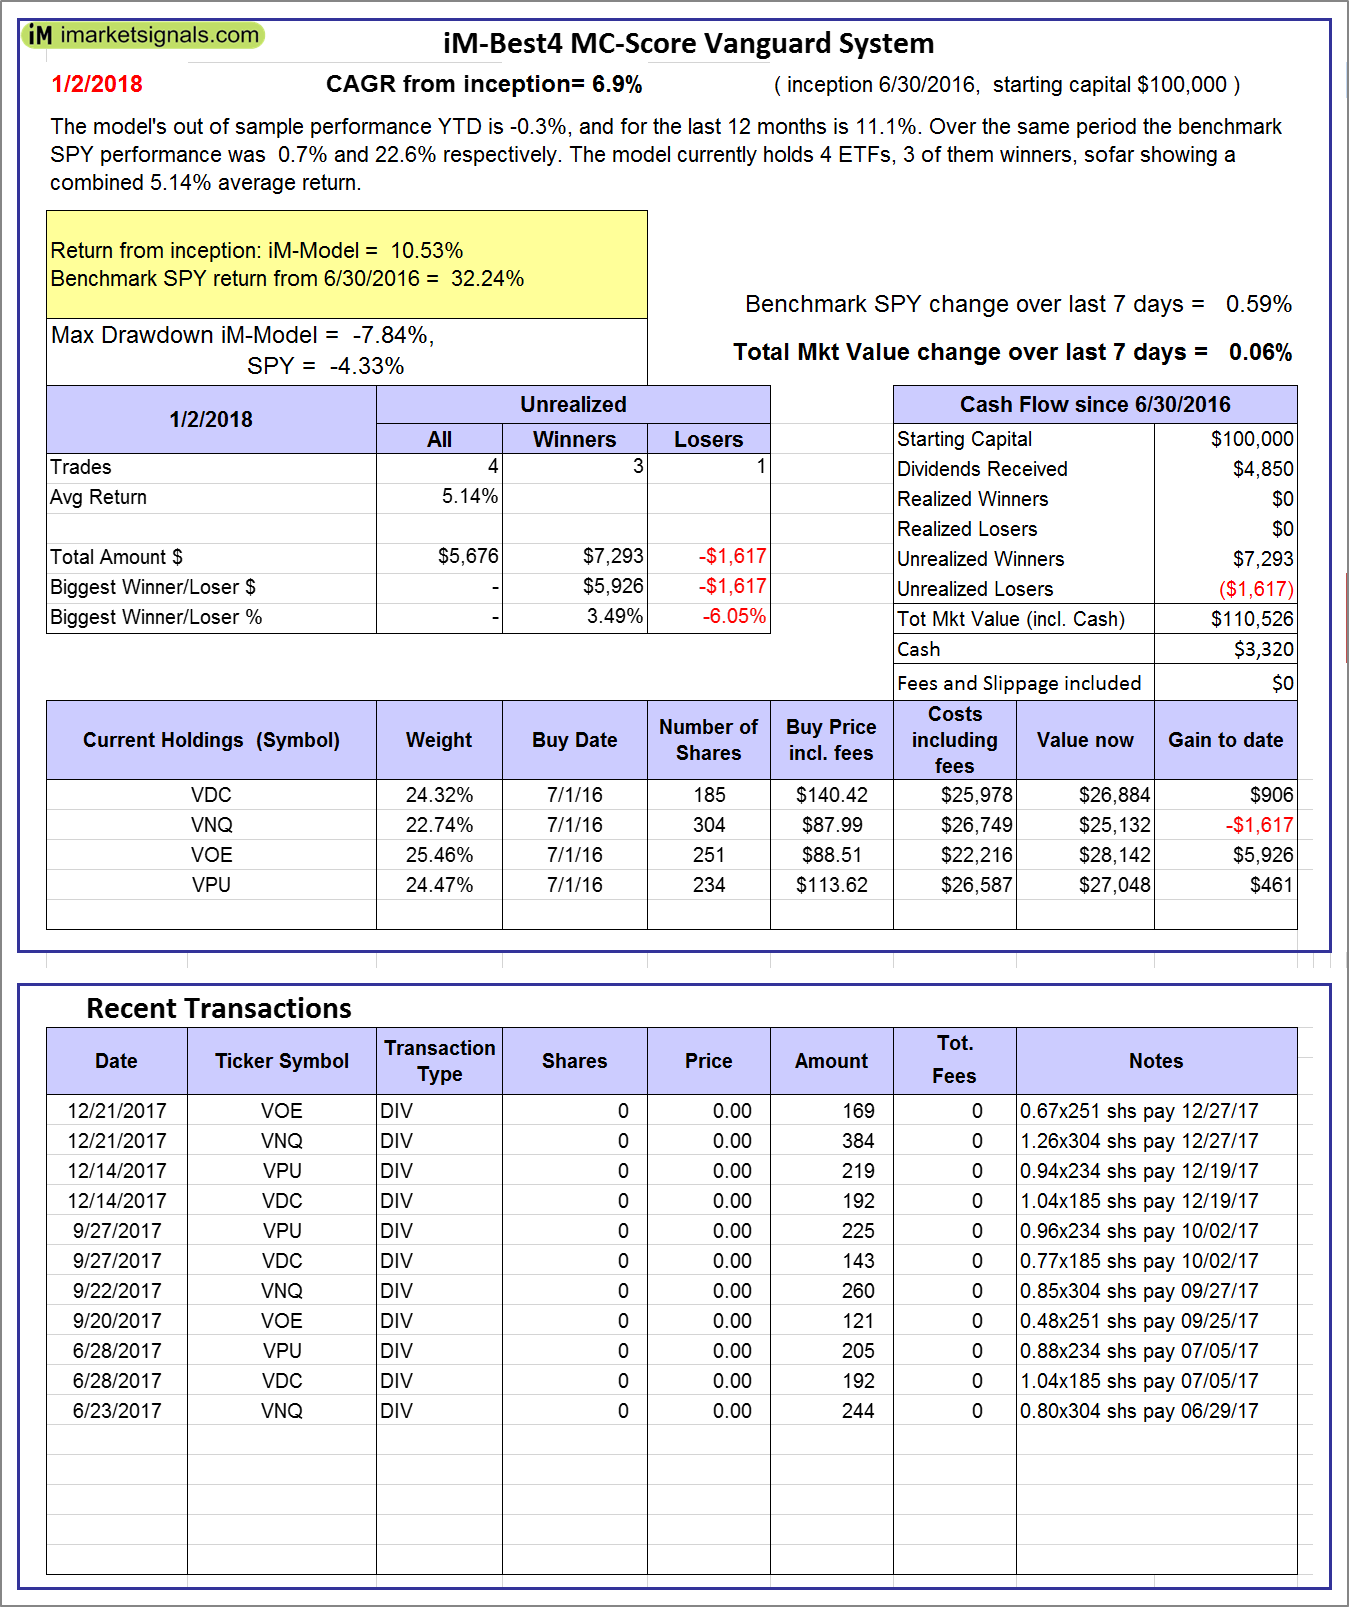 |
iM-Best4 MC-Score Vanguard System: The model’s out of sample performance YTD is -0.3%, and for the last 12 months is 11.1%. Over the same period the benchmark SPY performance was 0.7% and 22.6% respectively. Over the previous week the market value of the iM-Best4 MC-Score Vanguard System gained 0.06% at a time when SPY gained 0.59%. A starting capital of $100,000 at inception on 6/30/2016 would have grown to $110,526 which includes $3,320 cash and excludes $00 spent on fees and slippage. |
 |
iM-Composite (SH-RSP) Timer: The model’s out of sample performance YTD is 0.7%, and for the last 12 months is 19.2%. Over the same period the benchmark SPY performance was 0.7% and 22.6% respectively. Over the previous week the market value of the iM-Composite (SH-RSP) Timer gained 0.57% at a time when SPY gained 0.59%. A starting capital of $100,000 at inception on 6/30/2016 would have grown to $130,924 which includes $2,172 cash and excludes $513 spent on fees and slippage. |
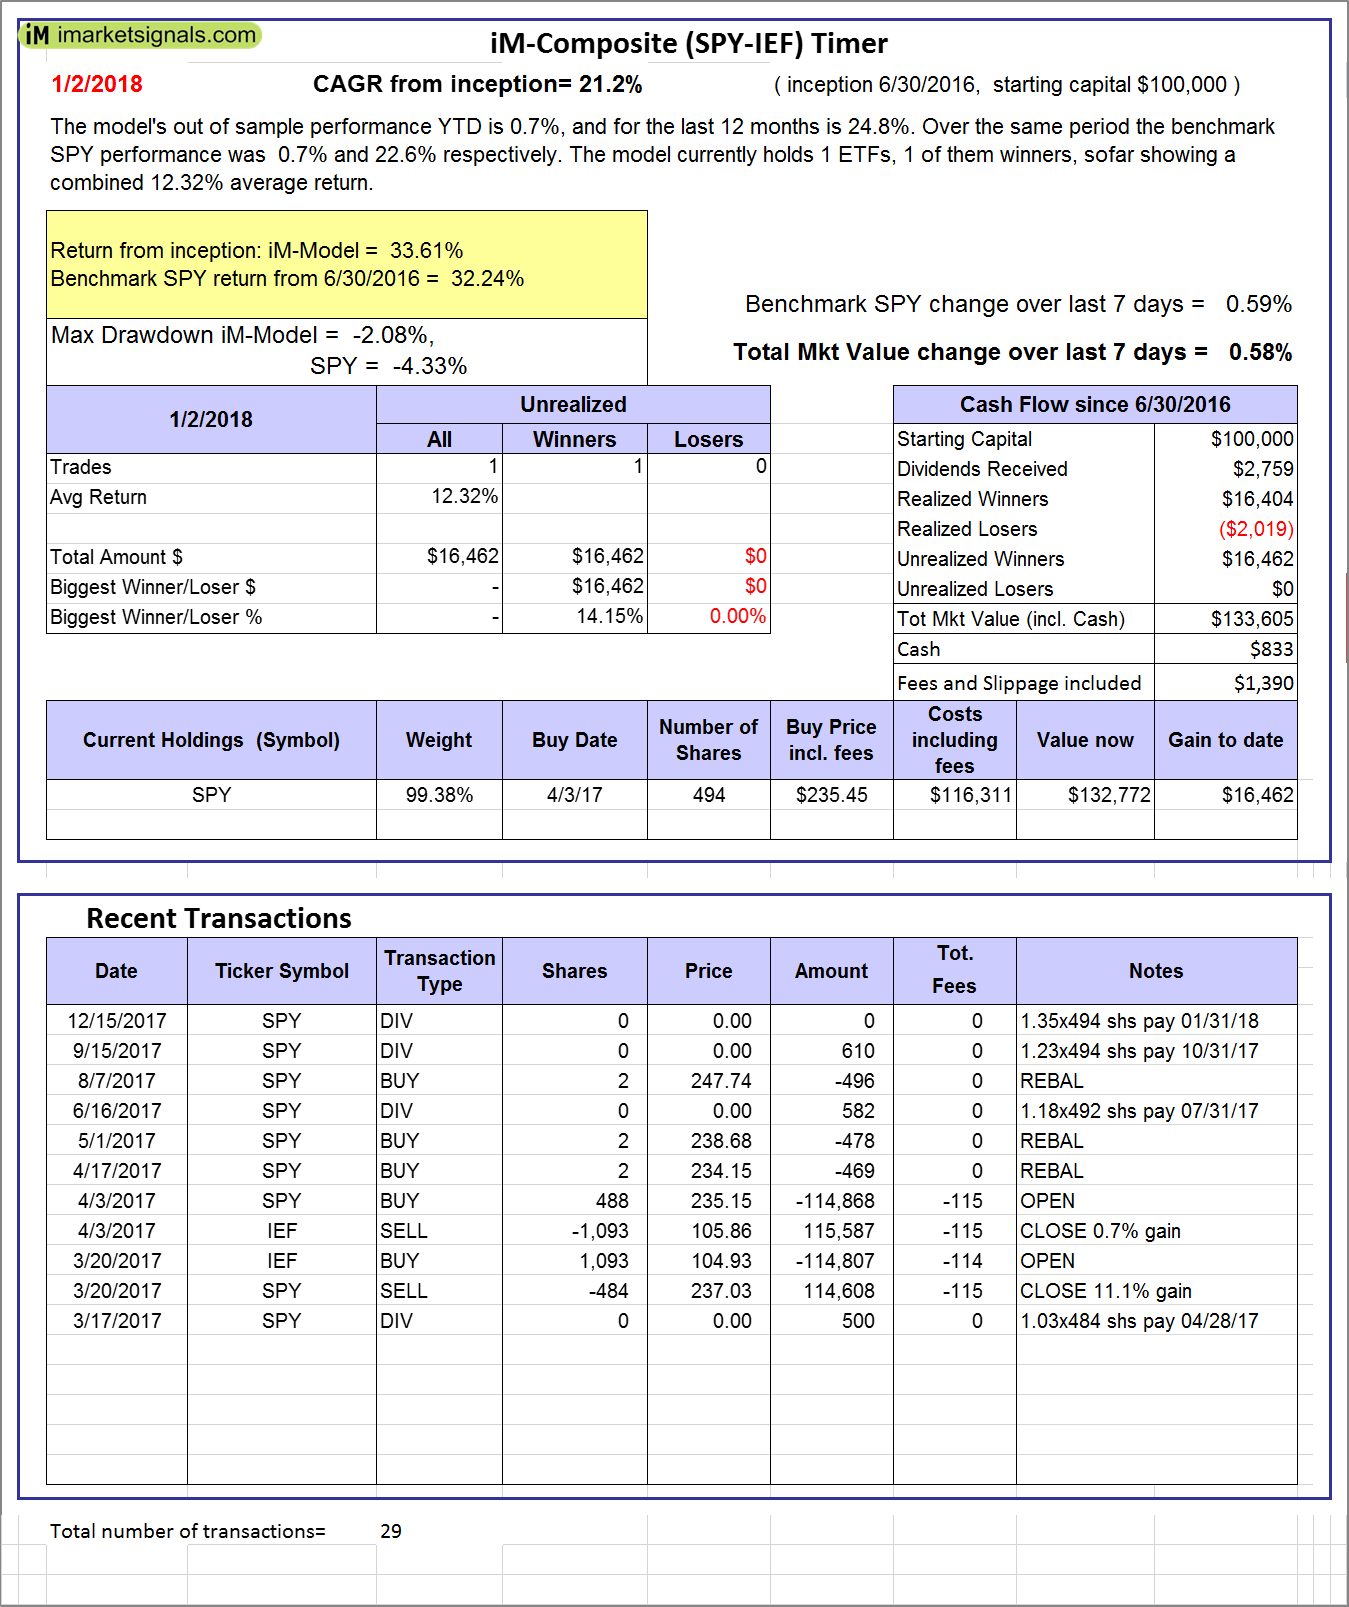 |
iM-Composite (SPY-IEF) Timer: The model’s out of sample performance YTD is 0.7%, and for the last 12 months is 24.8%. Over the same period the benchmark SPY performance was 0.7% and 22.6% respectively. Over the previous week the market value of the iM-Composite (SPY-IEF) Timer gained 0.58% at a time when SPY gained 0.59%. A starting capital of $100,000 at inception on 6/30/2016 would have grown to $133,605 which includes $833 cash and excludes $1,390 spent on fees and slippage. |
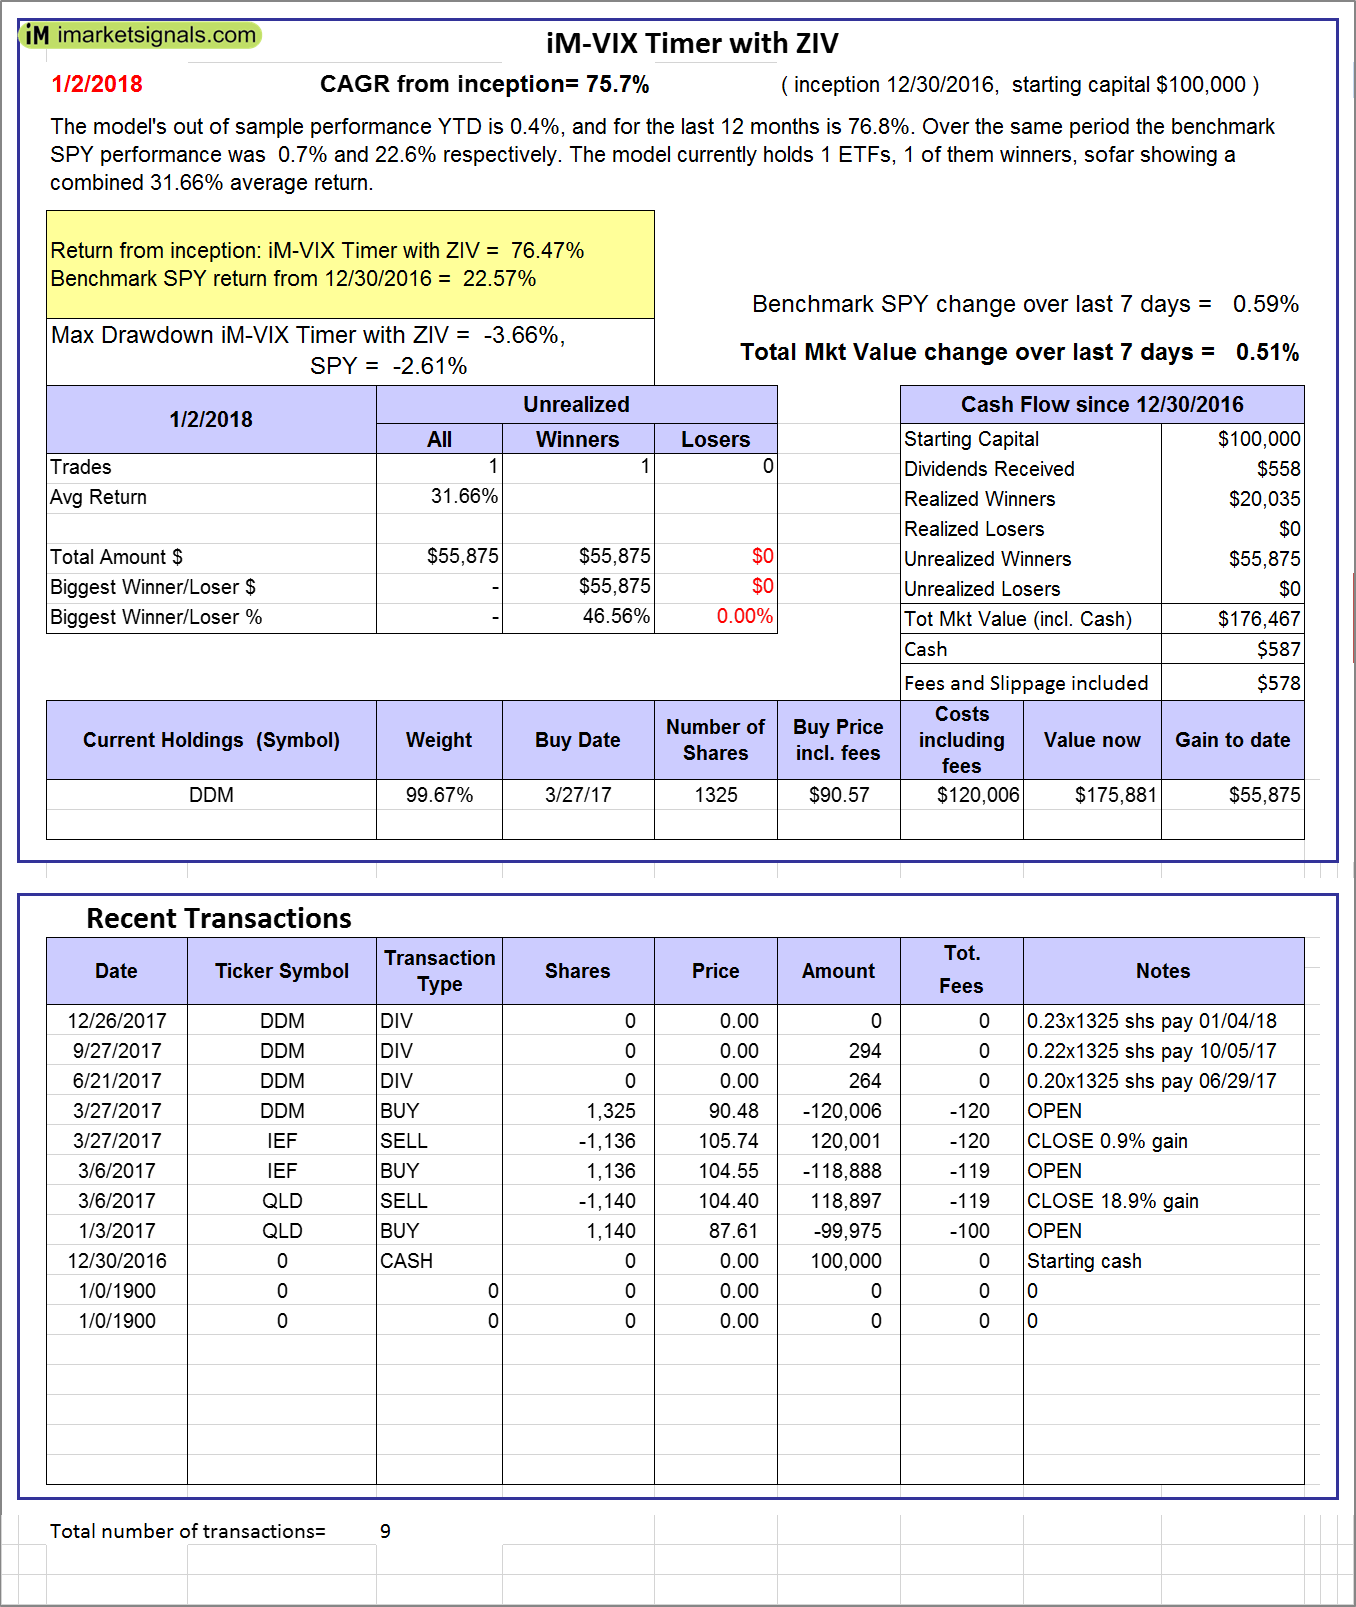 |
iM-VIX Timer with ZIV: The model’s out of sample performance YTD is 0.4%, and for the last 12 months is 76.8%. Over the same period the benchmark SPY performance was 0.7% and 22.6% respectively. Over the previous week the market value of the iM-VIX Timer with ZIV gained 0.51% at a time when SPY gained 0.59%. A starting capital of $100,000 at inception on 6/30/2016 would have grown to $176,467 which includes $587 cash and excludes $578 spent on fees and slippage. |
 |
iM-Composite(Gold-Stocks-Bond) Timer: The model’s out of sample performance YTD is 1.3%, and for the last 12 months is 25.4%. Over the same period the benchmark SPY performance was 0.7% and 22.6% respectively. Over the previous week the market value of the iM-Composite(Gold-Stocks-Bond) Timer gained 2.81% at a time when SPY gained 0.59%. A starting capital of $100,000 at inception on 6/30/2016 would have grown to $130,318 which includes $53 cash and excludes $1,955 spent on fees and slippage. |
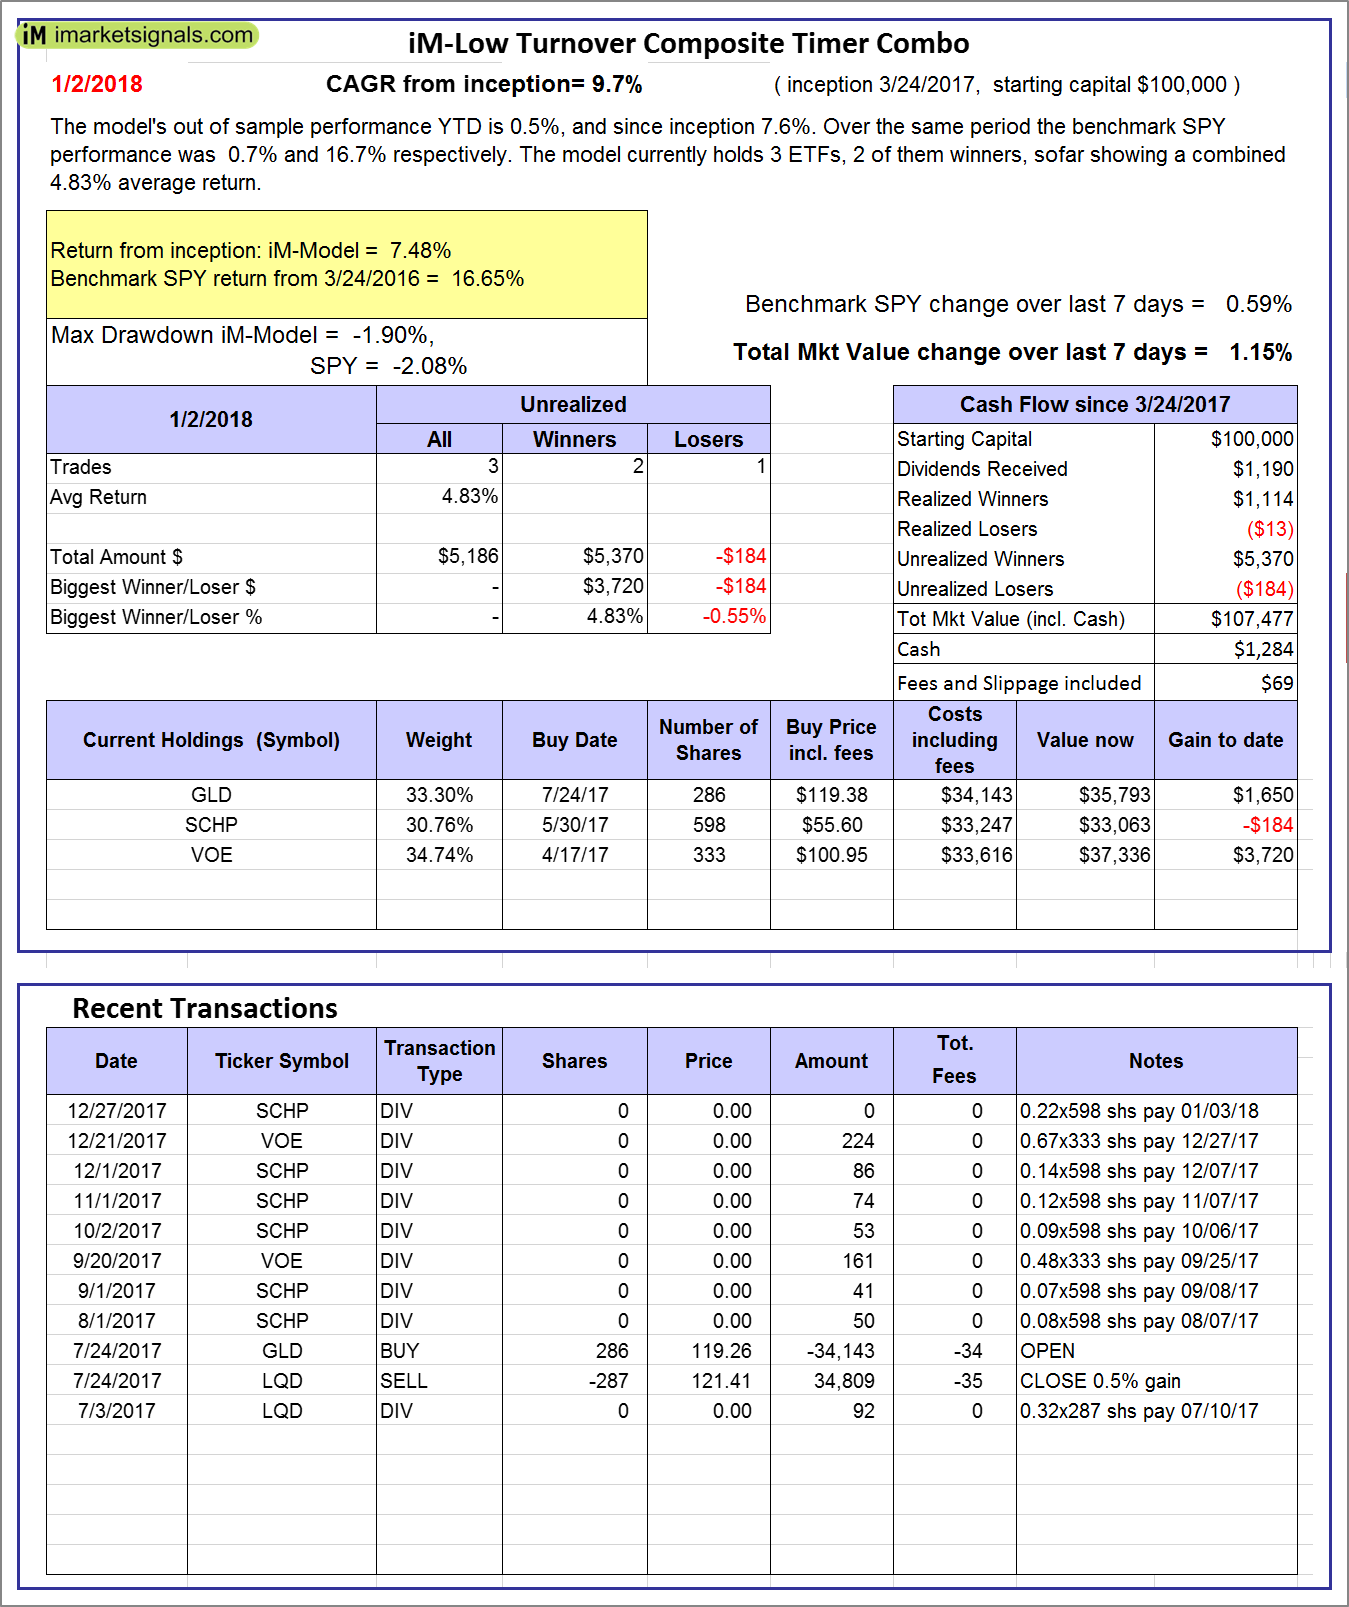 |
iM-Low Turnover Composite Timer Combo: The model’s out of sample performance YTD is 0.5%, and since inception 7.6%. Over the same period the benchmark SPY performance was 0.7% and 16.7% respectively. Over the previous week the market value of the iM-Low Turnover Composite Timer Combo gained 1.15% at a time when SPY gained 0.59%. A starting capital of $100,000 at inception on 3/24/27 would have grown to $107,477 which includes $1,284 cash and excludes $69 spent on fees and slippage. |
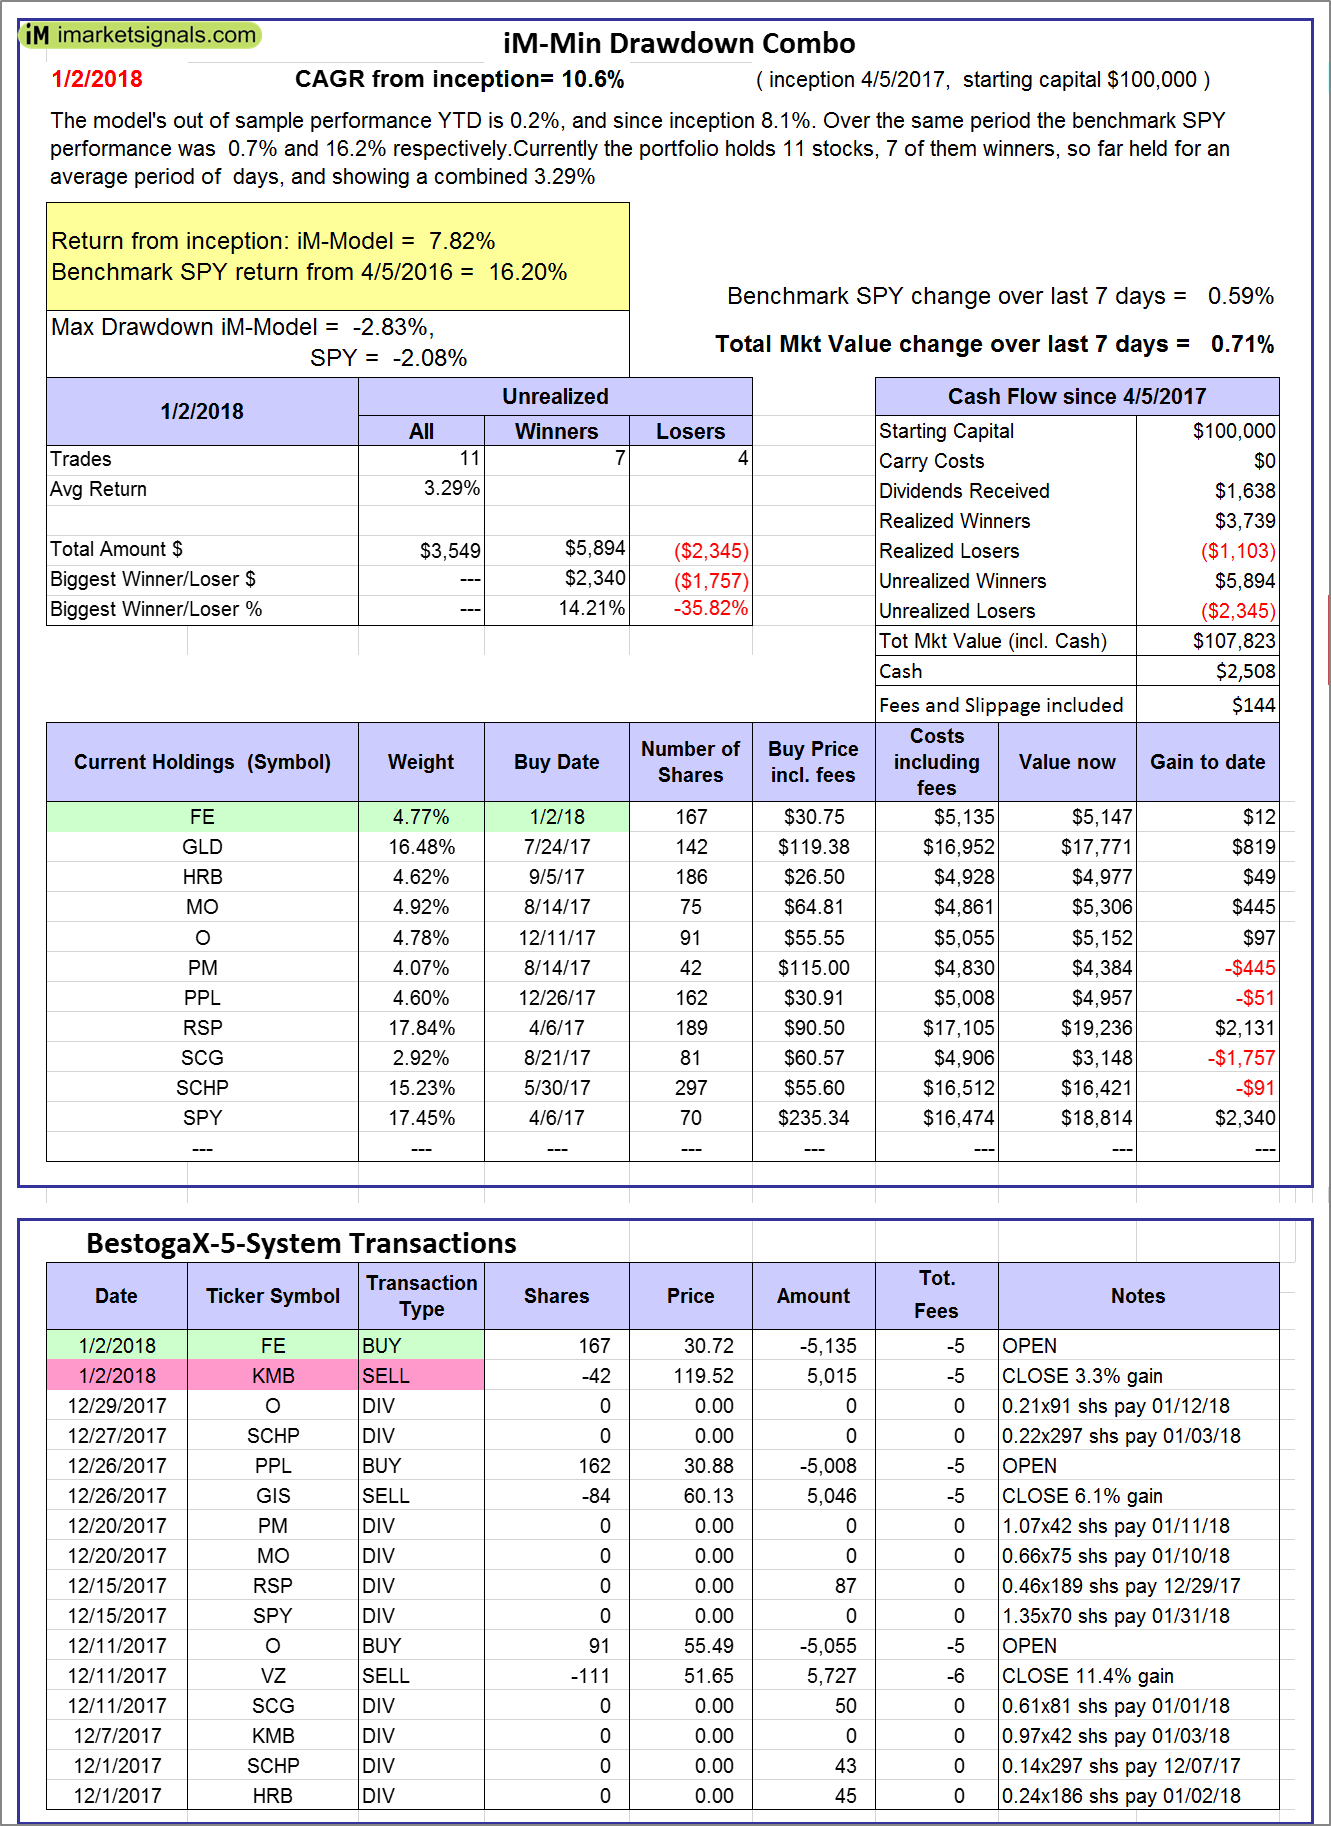 |
iM-Min Drawdown Combo: The model’s out of sample performance YTD is 0.2%, and since inception 8.1%. Over the same period the benchmark SPY performance was 0.7% and 16.2% respectively. Over the previous week the market value of the iM-Min Drawdown Combo gained 0.71% at a time when SPY gained 0.59%. A starting capital of $100,000 at inception on 4/5/2017 would have grown to $107,823 which includes $2,508 cash and excludes $144 spent on fees and slippage. |
 |
iM-5ETF Trader (includes leveraged ETFs): The model’s out of sample performance YTD is 1.6%, and for the last 12 months is 46.5%. Over the same period the benchmark SPY performance was 0.7% and 22.6% respectively. Over the previous week the market value of the iM-5ETF Trader (includes leveraged ETFs) gained 1.06% at a time when SPY gained 0.59%. A starting capital of $100,000 at inception on 10/30/2016 would have grown to $165,159 which includes $924 cash and excludes $1,030 spent on fees and slippage. |
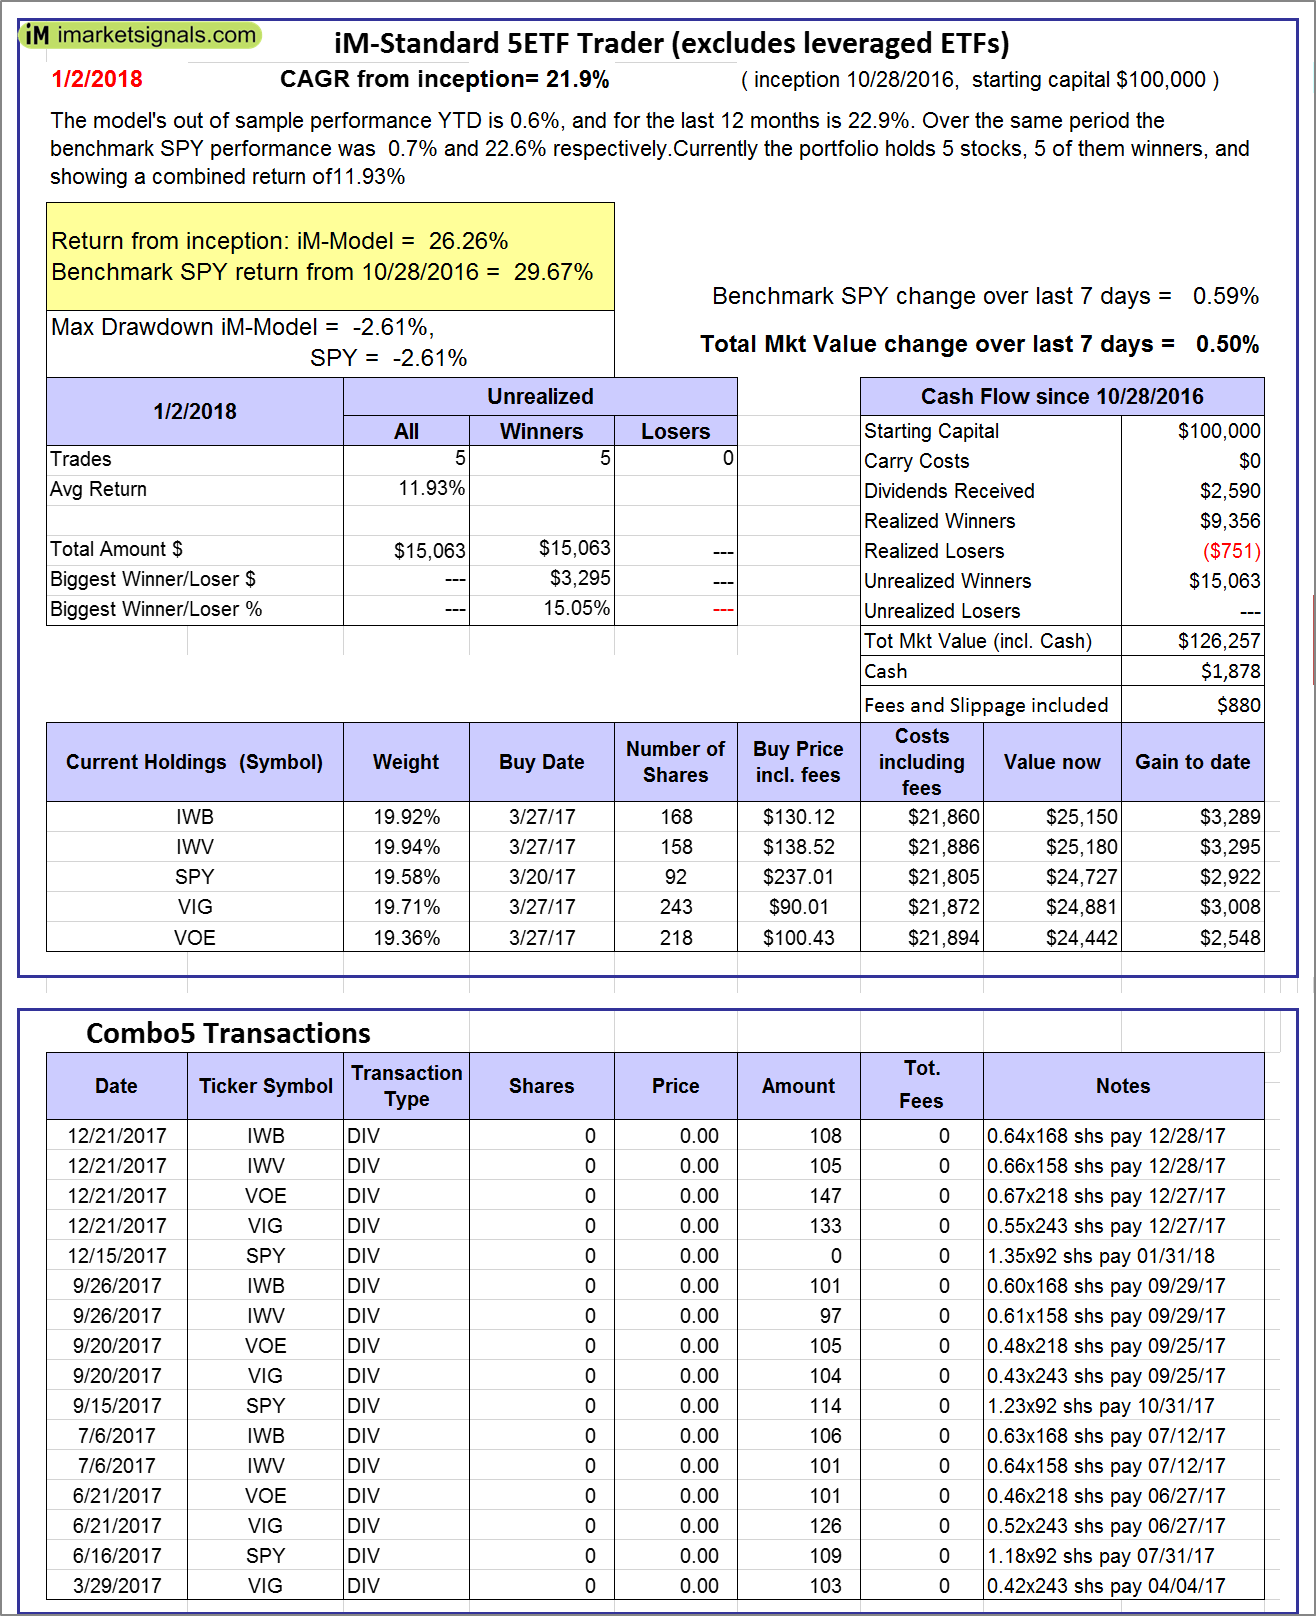 |
iM-Standard 5ETF Trader (excludes leveraged ETFs): The model’s out of sample performance YTD is 0.6%, and for the last 12 months is 22.9%. Over the same period the benchmark SPY performance was 0.7% and 22.6% respectively. Over the previous week the market value of the iM-Standard 5ETF Trader (excludes leveraged ETFs) gained 0.50% at a time when SPY gained 0.59%. A starting capital of $100,000 at inception on 10/30/2016 would have grown to $126,257 which includes $1,878 cash and excludes $880 spent on fees and slippage. |

Blog Archives
iM-Best Reports – 1/2/2018
Posted in pmp SPY-SH
iM-Best Reports – 12/19/2017
  |
Out of sample performance summary of our models for the past 1, 2, 4 and 13 week periods. The active active return indicates how the models over- or underperformed the benchmark ETF SPY. Also the YTD, and the 1-, 3-, 5- and 10-year annualized returns are shown in the second table |
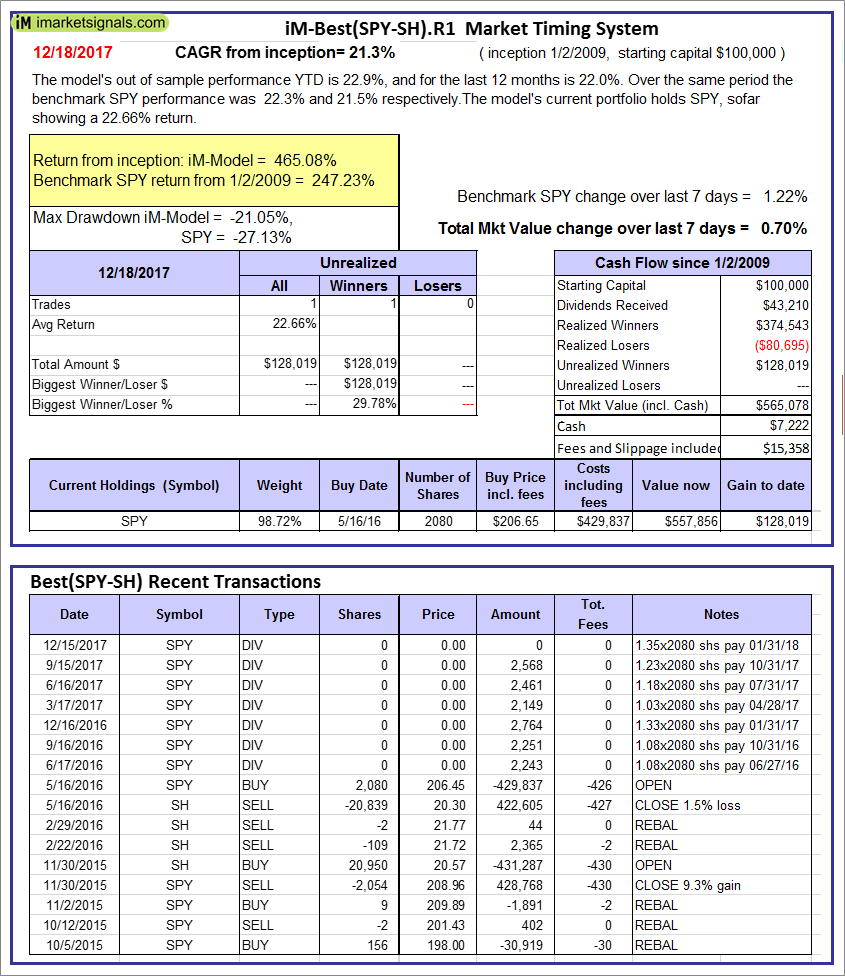 |
iM-Best(SPY-SH).R1: The model’s out of sample performance YTD is 22.9%, and for the last 12 months is 22.0%. Over the same period the benchmark SPY performance was 22.3% and 21.5% respectively. Over the previous week the market value of Best(SPY-SH) gained 0.70% at a time when SPY gained 1.22%. A starting capital of $100,000 at inception on 1/2/2009 would have grown to $565,078 which includes $7,222 cash and excludes $15,358 spent on fees and slippage. |
 |
iM-Combo3.R1: The model’s out of sample performance YTD is 27.2%, and for the last 12 months is 26.2%. Over the same period the benchmark SPY performance was 22.3% and 21.5% respectively. Over the previous week the market value of iM-Combo3.R1 gained 1.55% at a time when SPY gained 1.22%. A starting capital of $100,000 at inception on 2/3/2014 would have grown to $159,321 which includes -$544 cash and excludes $3,437 spent on fees and slippage. |
 |
iM-Combo5: The model’s out of sample performance YTD is 31.7%, and for the last 12 months is 31.8%. Over the same period the benchmark SPY performance was 22.3% and 21.5% respectively. Over the previous week the market value of iM-Combo5 gained 1.85% at a time when SPY gained 1.22%. A starting capital of $100,000 at inception on 2/22/2016 would have grown to $129,580 which includes $409 cash and excludes $603 spent on fees and slippage. |
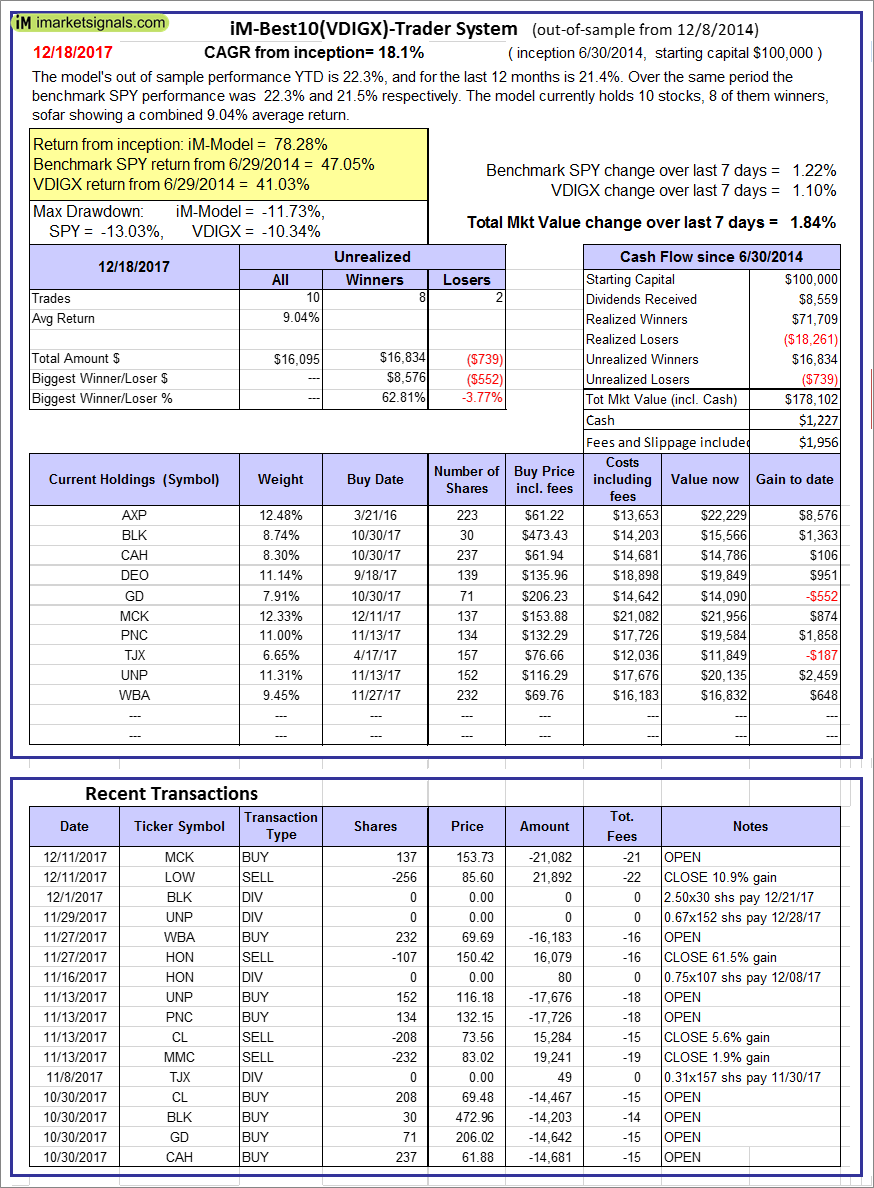 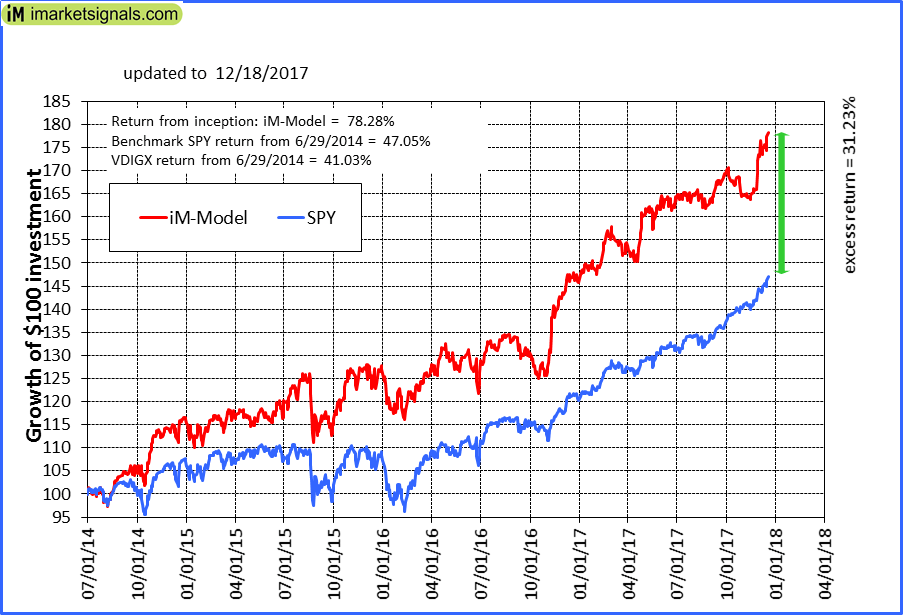 |
iM-Best10(VDIGX)-Trader: The model’s out of sample performance YTD is 22.3%, and for the last 12 months is 21.4%. Over the same period the benchmark SPY performance was 22.3% and 21.5% respectively. Since inception, on 7/1/2014, the model gained 78.28% while the benchmark SPY gained 47.05% and VDIGX gained 41.03% over the same period. Over the previous week the market value of iM-Best10(VDIGX) gained 1.84% at a time when SPY gained 1.22%. A starting capital of $100,000 at inception on 7/1/2014 would have grown to $178,102 which includes $1,227 cash and excludes $1,956 spent on fees and slippage. |
 |
iM-BESTOGA-3: The model’s out of sample performance YTD is 13.9%, and for the last 12 months is 14.0%. Over the same period the benchmark SPY performance was 22.3% and 21.5% respectively. Over the previous week the market value of iM-BESTOGA-3 gained 0.41% at a time when SPY gained 1.22%. A starting capital of $100,000 at inception on 2/3/2014 would have grown to $230,503 which includes $1,589 cash and excludes $1,818 spent on fees and slippage. |
 |
iM-Best7(HiD-LoV): The model’s out of sample performance YTD is 12.0%, and for the last 12 months is 9.5%. Over the same period the benchmark SPY performance was 22.3% and 21.5% respectively. Over the previous week the market value of iM-BESTOGA-3 gained 2.00% at a time when SPY gained 1.22%. A starting capital of $100,000 at inception on 6/30/2016 would have grown to $114,602 which includes $155 cash and excludes $1,298 spent on fees and slippage. |
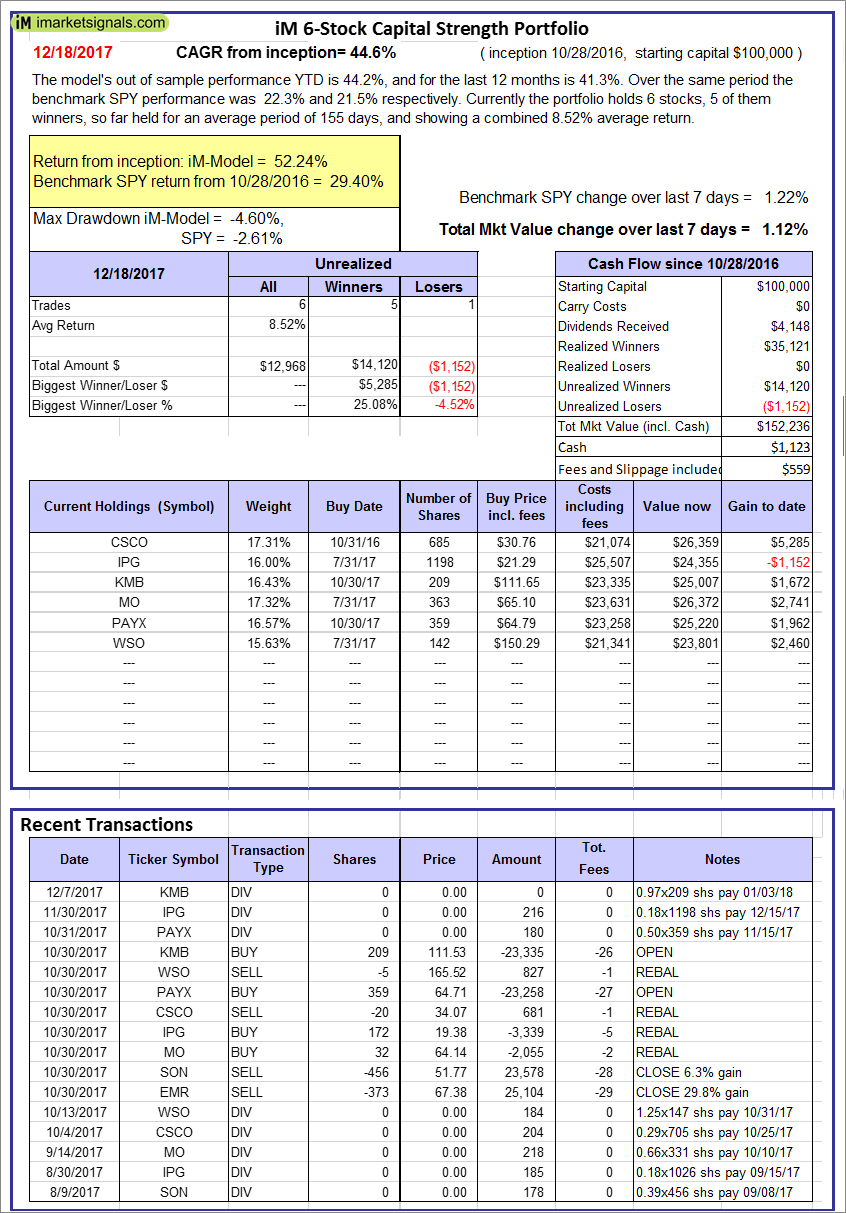 |
iM 6-Stock Capital Strength Portfolio: The model’s out of sample performance YTD is 44.2%, and for the last 12 months is 41.3%. Over the same period the benchmark SPY performance was 22.3% and 21.5% respectively. Over the previous week the market value of the iM 6-Stock Capital Strength Portfolio gained 1.12% at a time when SPY gained 1.22%. A starting capital of $100,000 at inception on 10/28/2016 would have grown to $152,236 which includes $1,123 cash and excludes $559 spent on fees and slippage. |
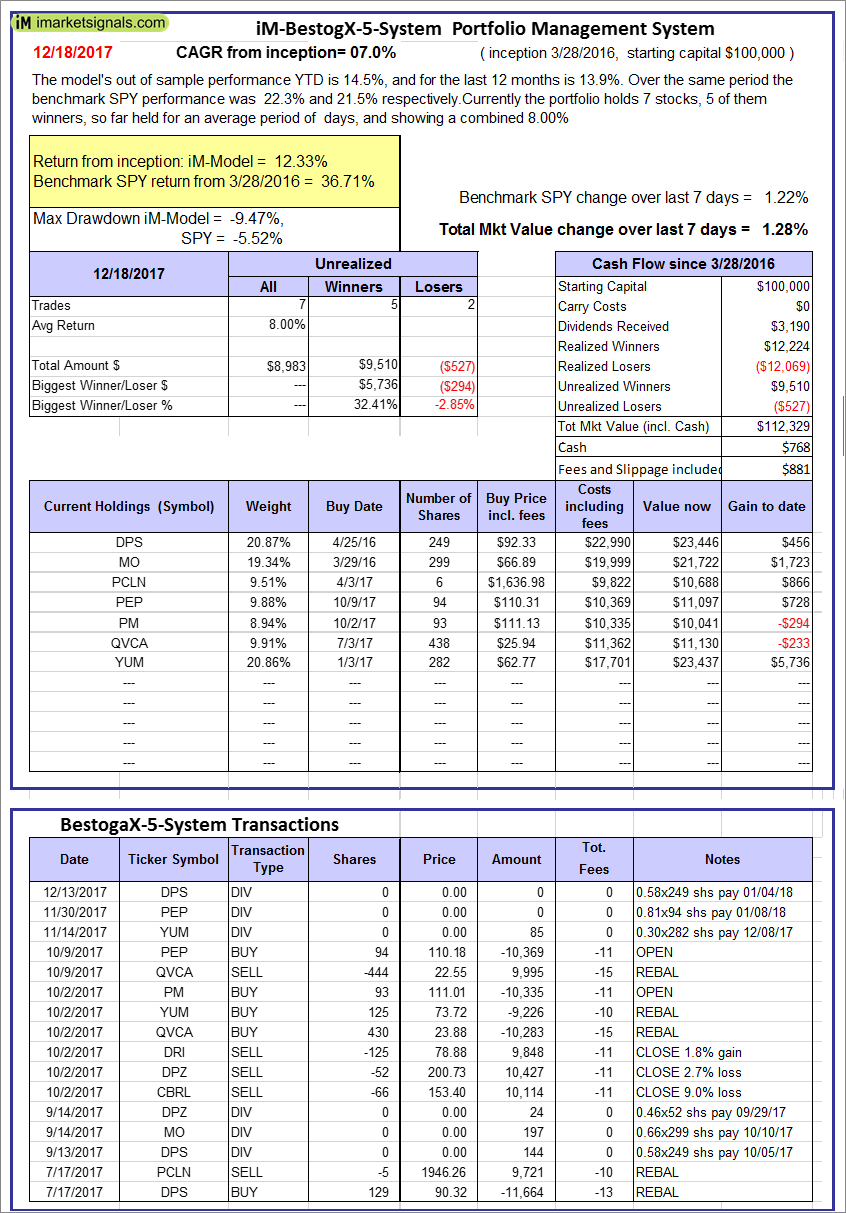 |
iM-BestogaX5-System: The model’s out of sample performance YTD is 14.5%, and for the last 12 months is 13.9%. Over the same period the benchmark SPY performance was 22.3% and 21.5% respectively. Over the previous week the market value of iM-Best8(S&P 500)Tax-Eff. gained 1.28% at a time when SPY gained 1.22%. A starting capital of $100,000 at inception on 3/28/2016 would have grown to $112,329 which includes $768 cash and excludes $881 spent on fees and slippage. |
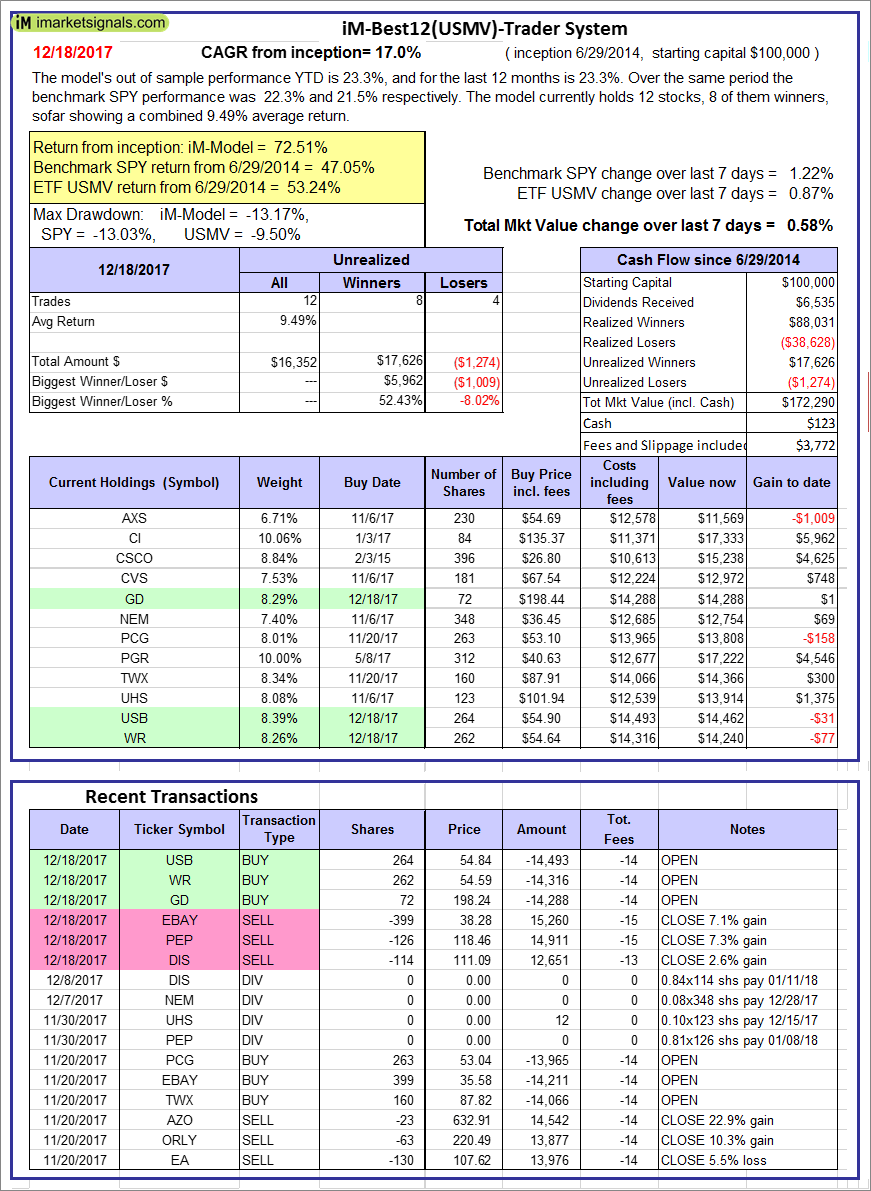 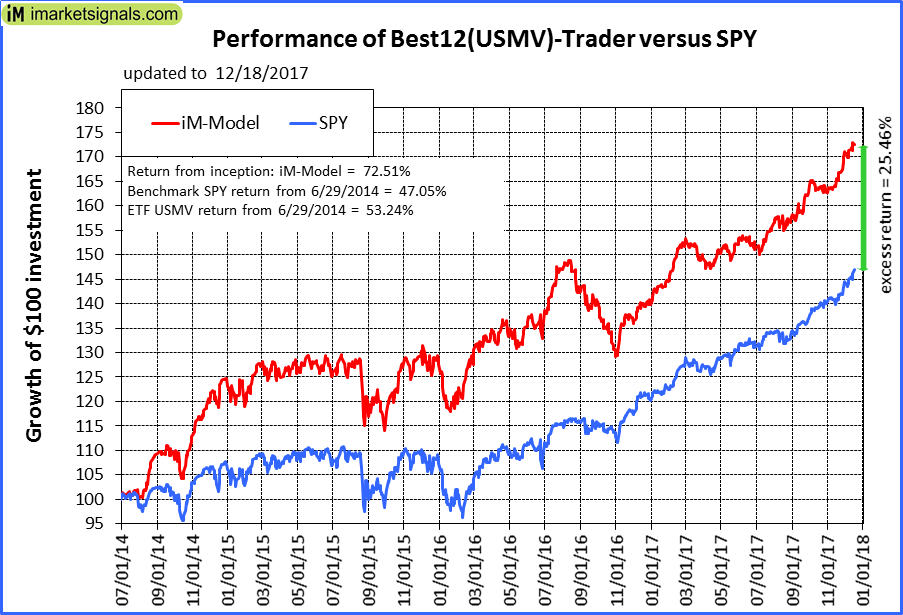 |
iM-Best12(USMV)-Trader: The model’s out of sample performance YTD is 23.3%, and for the last 12 months is 23.3%. Over the same period the benchmark SPY performance was 22.3% and 21.5% respectively. Since inception, on 6/30/2014, the model gained 72.51% while the benchmark SPY gained 47.05% and the ETF USMV gained 53.24% over the same period. Over the previous week the market value of iM-Best12(USMV)-Trader gained 0.58% at a time when SPY gained 1.22%. A starting capital of $100,000 at inception on 6/30/2014 would have grown to $172,290 which includes $123 cash and excludes $3,772 spent on fees and slippage. |
 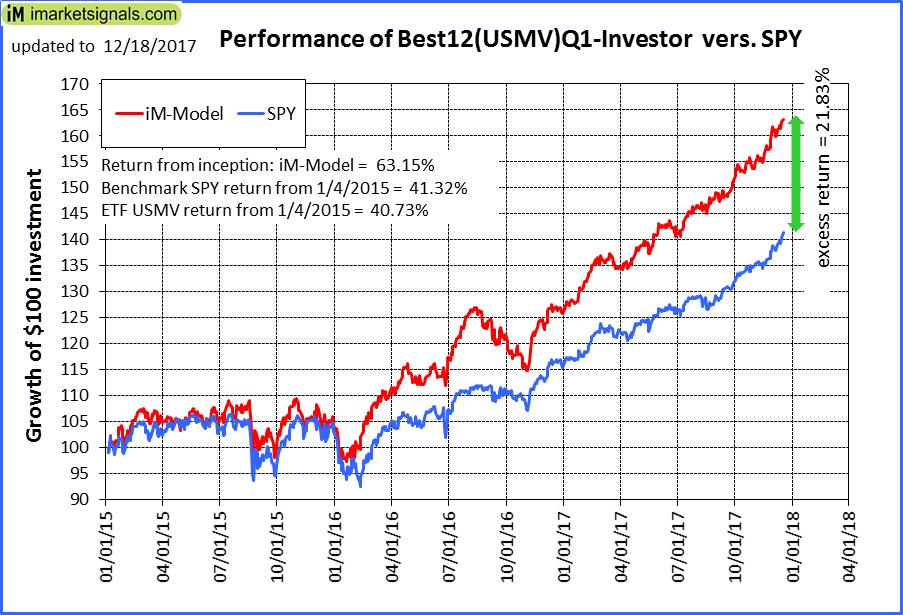 |
iM-Best12(USMV)Q1-Investor: The model’s out of sample performance YTD is 29.7%, and for the last 12 months is 28.5%. Over the same period the benchmark SPY performance was 22.3% and 21.5% respectively. Since inception, on 1/5/2015, the model gained 63.15% while the benchmark SPY gained 41.32% and the ETF USMV gained 40.73% over the same period. Over the previous week the market value of iM-Best12(USMV)Q1 gained 0.88% at a time when SPY gained 1.22%. A starting capital of $100,000 at inception on 1/5/2015 would have grown to $162,842 which includes $204 cash and excludes $871 spent on fees and slippage. |
 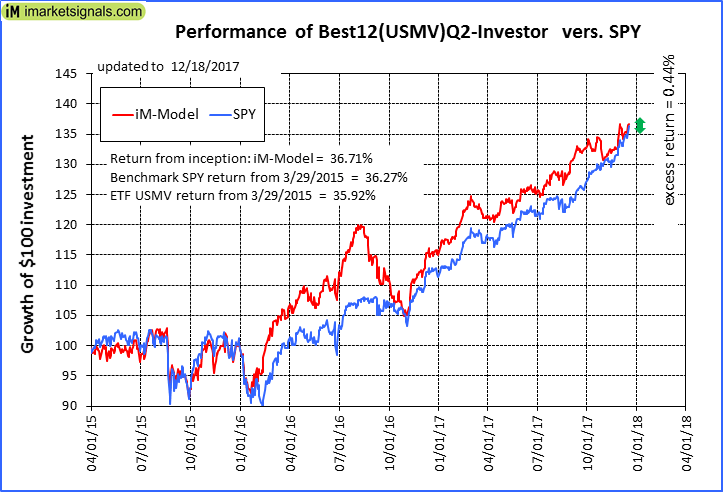 |
iM-Best12(USMV)Q2-Investor: The model’s out of sample performance YTD is 18.8%, and for the last 12 months is 18.8%. Over the same period the benchmark SPY performance was 22.3% and 21.5% respectively. Since inception, on 3/30/2015, the model gained 36.71% while the benchmark SPY gained 36.27% and the ETF USMV gained 35.92% over the same period. Over the previous week the market value of iM-Best12(USMV)Q2 gained 0.99% at a time when SPY gained 1.22%. A starting capital of $100,000 at inception on 3/30/2015 would have grown to $136,531 which includes $12 cash and excludes $784 spent on fees and slippage. |
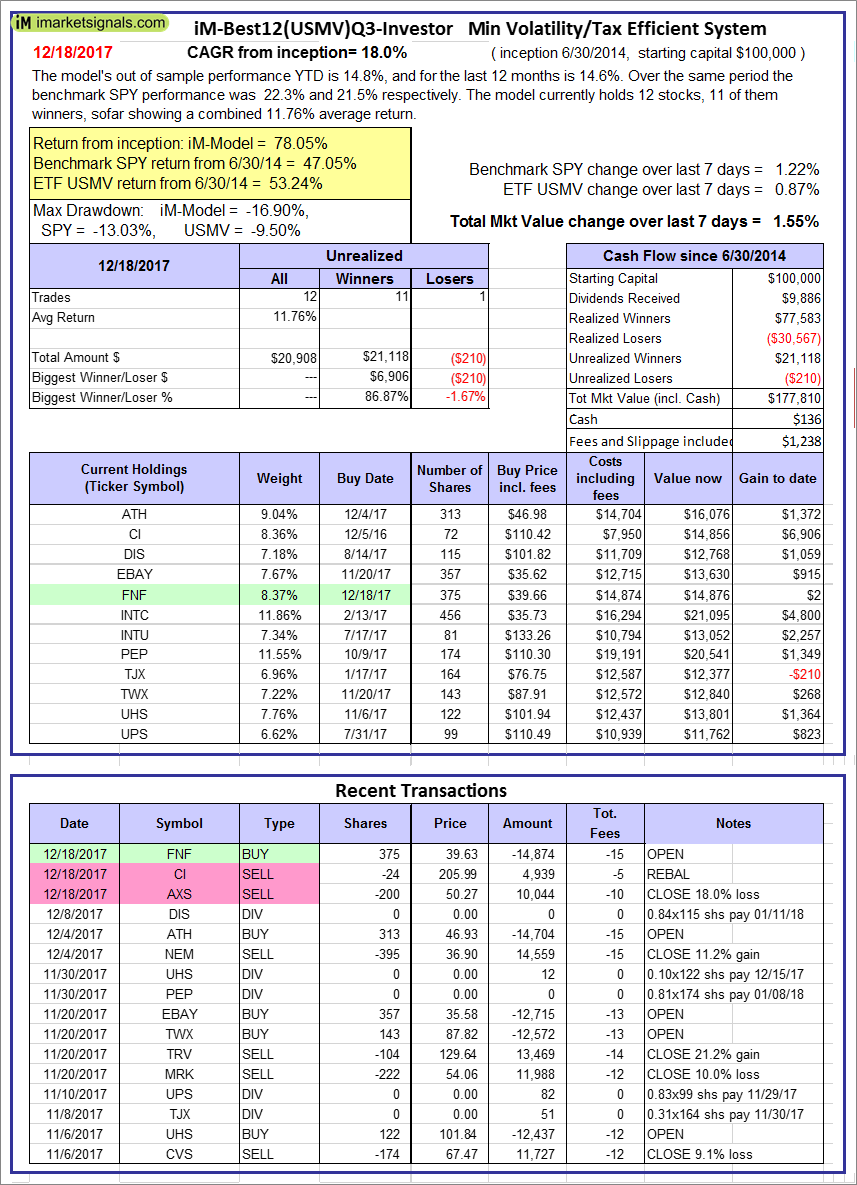 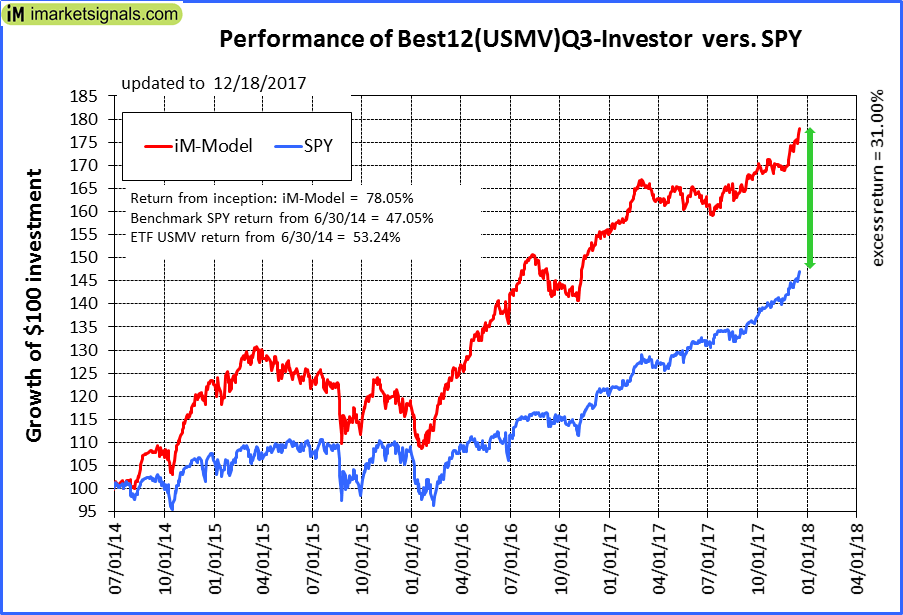 |
iM-Best12(USMV)Q3-Investor: The model’s out of sample performance YTD is 14.8%, and for the last 12 months is 14.6%. Over the same period the benchmark SPY performance was 22.3% and 21.5% respectively. Since inception, on 7/1/2014, the model gained 78.05% while the benchmark SPY gained 47.05% and the ETF USMV gained 53.24% over the same period. Over the previous week the market value of iM-Best12(USMV)Q3 gained 1.55% at a time when SPY gained 1.22%. A starting capital of $100,000 at inception on 7/1/2014 would have grown to $177,810 which includes $136 cash and excludes $1,238 spent on fees and slippage. |
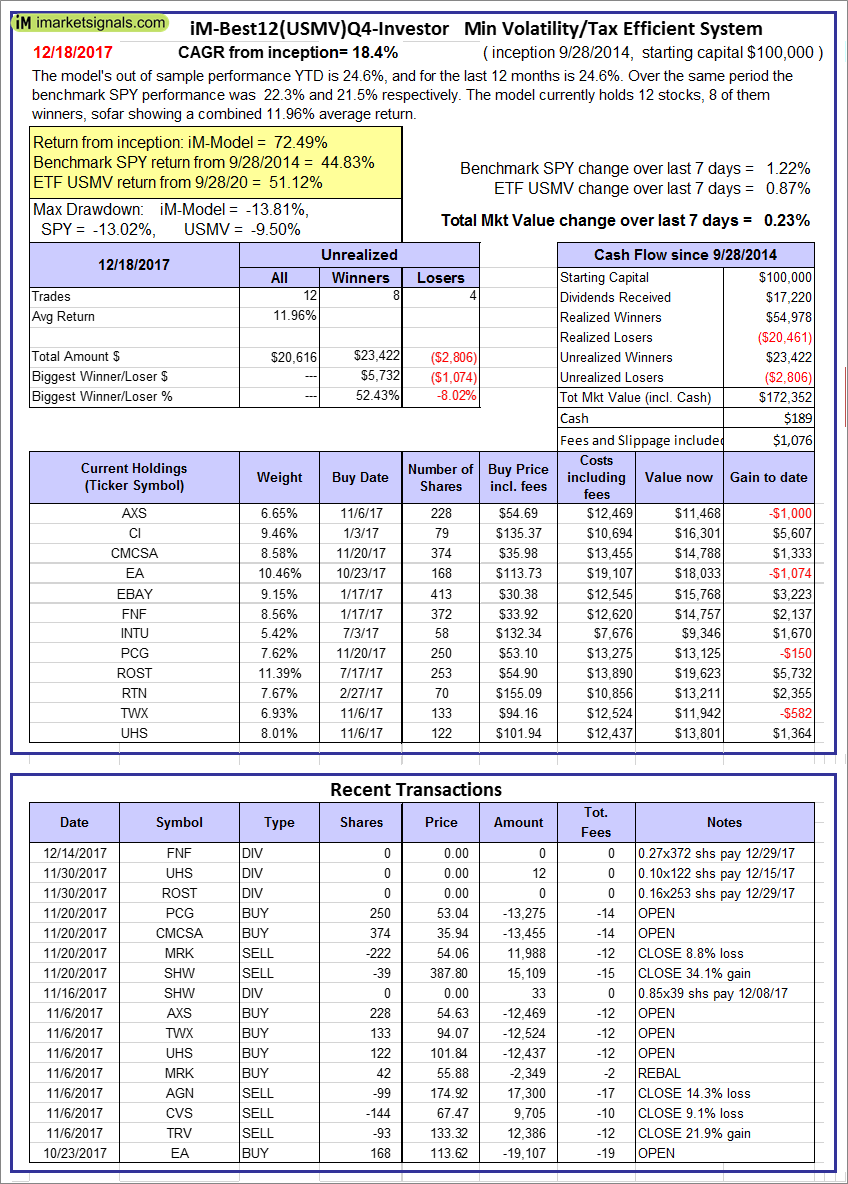 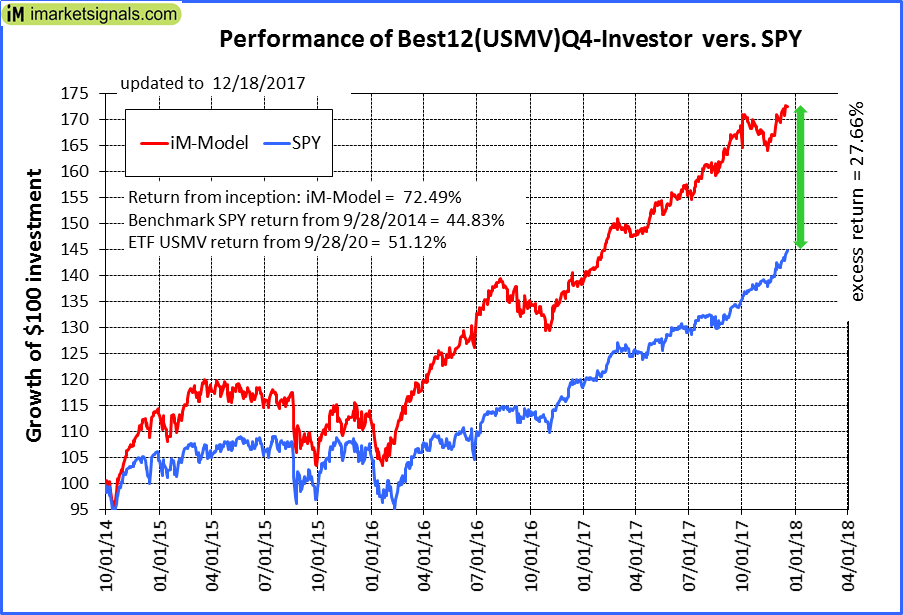 |
iM-Best12(USMV)Q4-Investor: Since inception, on 9/29/2014, the model gained 72.49% while the benchmark SPY gained 44.83% and the ETF USMV gained 51.12% over the same period. Over the previous week the market value of iM-Best12(USMV)Q4 gained 0.23% at a time when SPY gained 1.22%. A starting capital of $100,000 at inception on 9/29/2014 would have grown to $172,352 which includes $189 cash and excludes $1,076 spent on fees and slippage. |
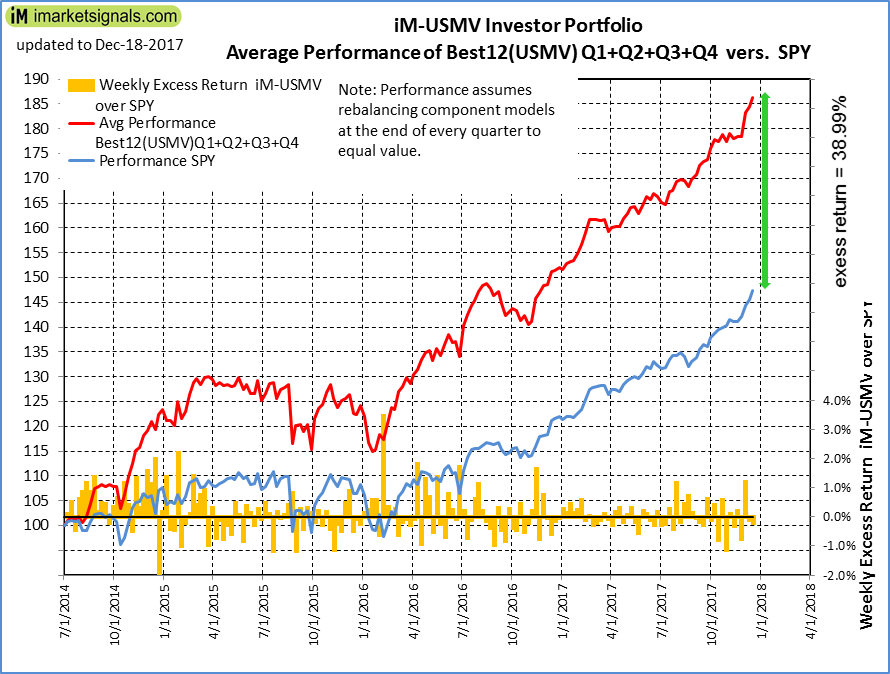 |
Average Performance of iM-Best12(USMV)Q1+Q2+Q3+Q4-Investor resulted in an excess return of 38.99% over SPY. (see iM-USMV Investor Portfolio) |
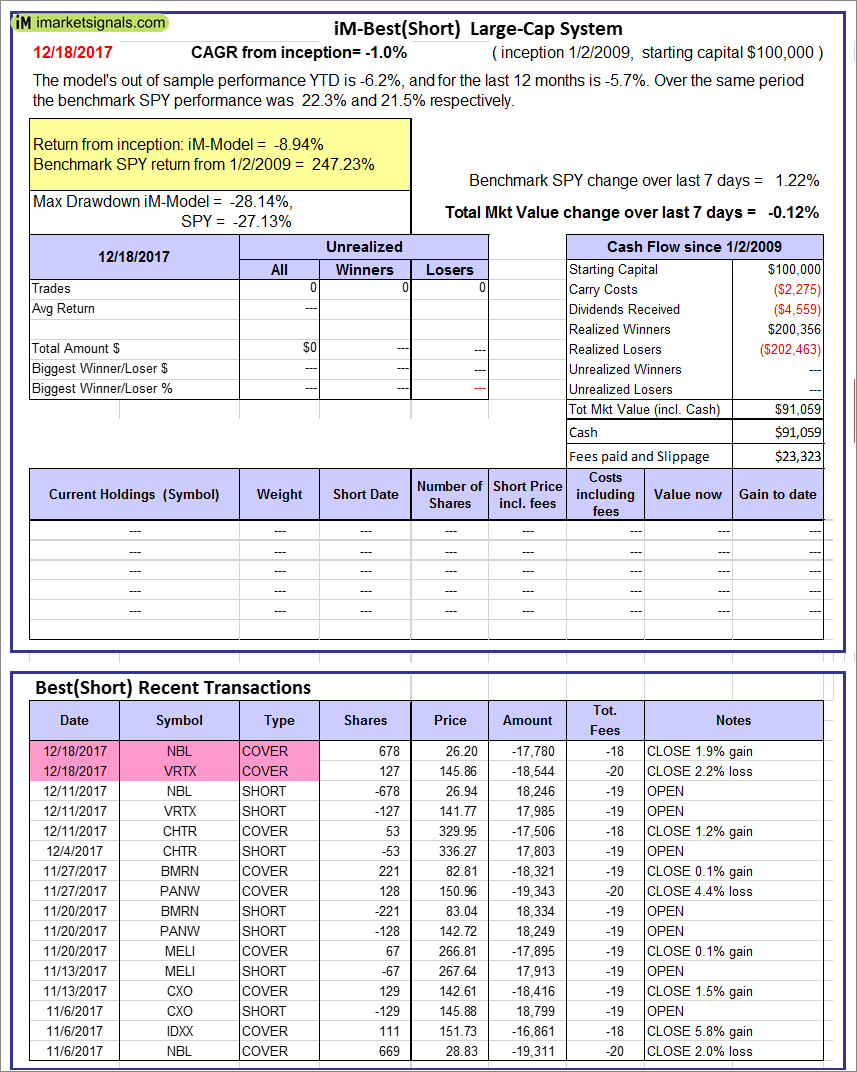 |
iM-Best(Short): The model’s out of sample performance YTD is -6.2%, and for the last 12 months is -5.7%. Over the same period the benchmark SPY performance was 22.3% and 21.5% respectively. Over the previous week the market value of iM-Best(Short) gained -0.12% at a time when SPY gained 1.22%. Over the period 1/2/2009 to 12/18/2017 the starting capital of $100,000 would have grown to $91,059 which includes $91,059 cash and excludes $23,323 spent on fees and slippage. |
 |
iM-Best2 MC-Score ETF System: The model’s out of sample performance YTD is 16.2%, and for the last 12 months is 16.2%. Over the same period the benchmark SPY performance was 22.3% and 21.5% respectively. Over the previous week the market value of the iM-Best2 MC-Score ETF System gained 0.67% at a time when SPY gained 1.22%. A starting capital of $100,000 at inception on 6/30/2016 would have grown to $112,271 which includes $70 cash and excludes $115 spent on fees and slippage. |
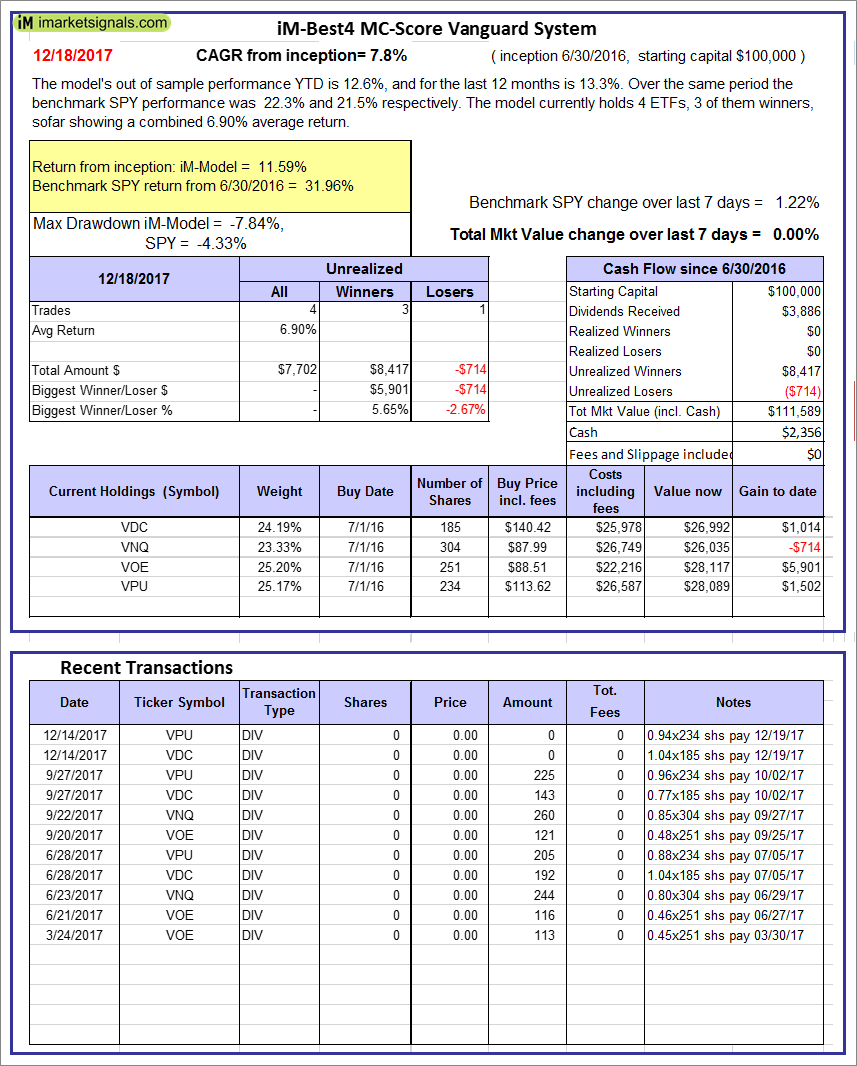 |
iM-Best4 MC-Score Vanguard System: The model’s out of sample performance YTD is 12.6%, and for the last 12 months is 13.3%. Over the same period the benchmark SPY performance was 22.3% and 21.5% respectively. Over the previous week the market value of the iM-Best4 MC-Score Vanguard System gained 0.00% at a time when SPY gained 1.22%. A starting capital of $100,000 at inception on 6/30/2016 would have grown to $111,589 which includes $2,356 cash and excludes $00 spent on fees and slippage. |
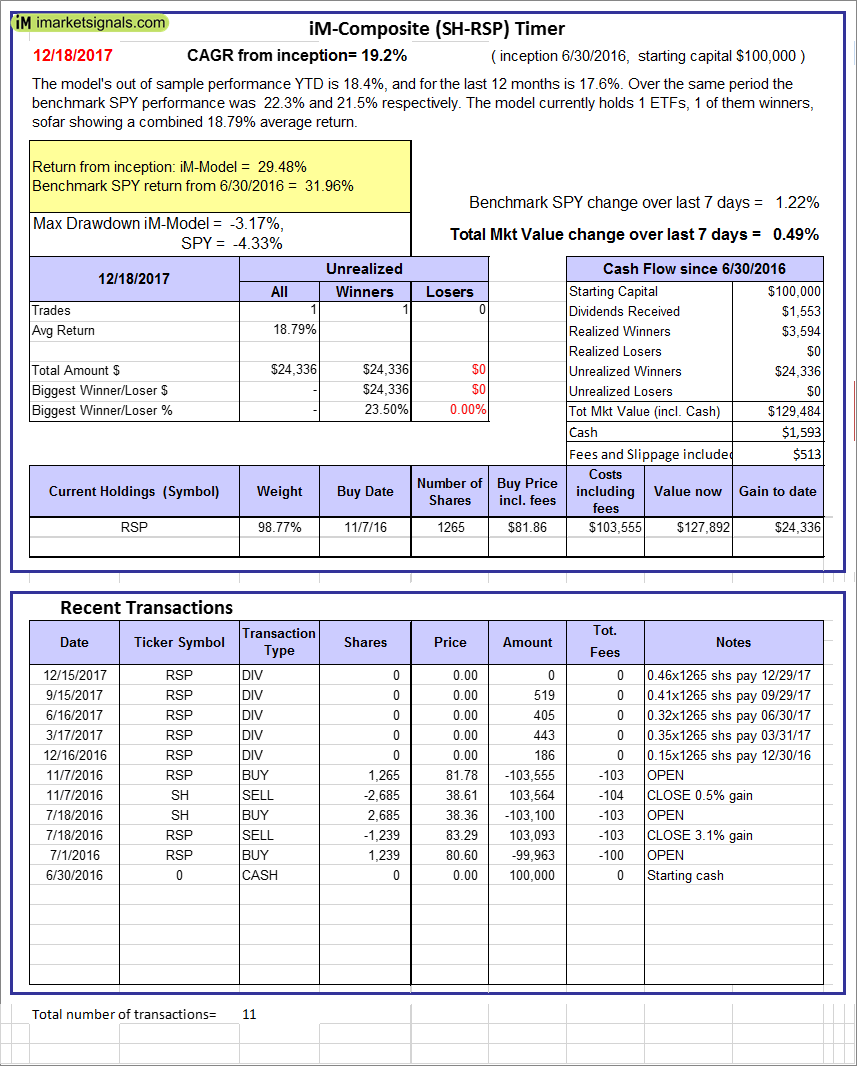 |
iM-Composite (SH-RSP) Timer: The model’s out of sample performance YTD is 18.4%, and for the last 12 months is 17.6%. Over the same period the benchmark SPY performance was 22.3% and 21.5% respectively. Over the previous week the market value of the iM-Composite (SH-RSP) Timer gained 0.49% at a time when SPY gained 1.22%. A starting capital of $100,000 at inception on 6/30/2016 would have grown to $129,484 which includes $1,593 cash and excludes $513 spent on fees and slippage. |
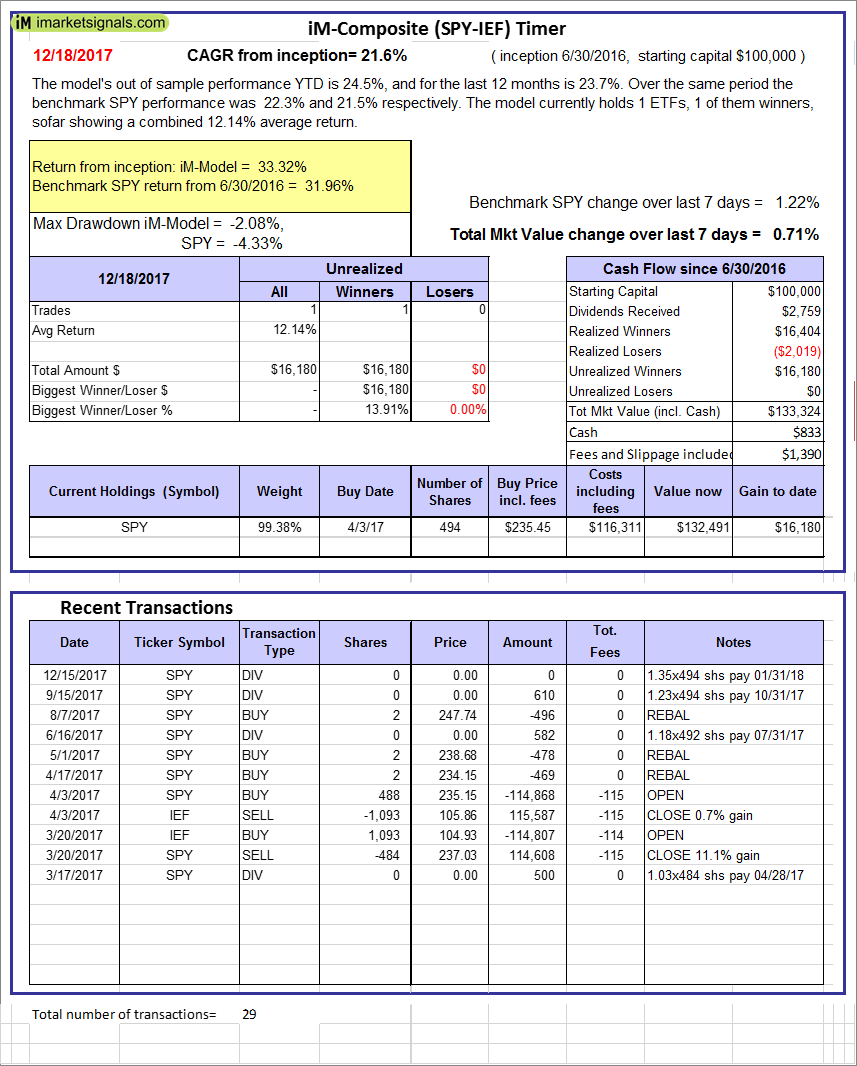 |
iM-Composite (SPY-IEF) Timer: The model’s out of sample performance YTD is 24.5%, and for the last 12 months is 23.7%. Over the same period the benchmark SPY performance was 22.3% and 21.5% respectively. Over the previous week the market value of the iM-Composite (SPY-IEF) Timer gained 0.71% at a time when SPY gained 1.22%. A starting capital of $100,000 at inception on 6/30/2016 would have grown to $133,324 which includes $833 cash and excludes $1,390 spent on fees and slippage. |
 |
iM-VIX Timer with ZIV: The model’s out of sample performance YTD is 76.8%, and since inception 76.8%. Over the same period the benchmark SPY performance was 22.3% and 22.3% respectively. Over the previous week the market value of the iM-VIX Timer with ZIV gained 3.41% at a time when SPY gained 1.22%. A starting capital of $100,000 at inception on 6/30/2016 would have grown to $176,799 which includes $587 cash and excludes $578 spent on fees and slippage. |
 |
iM-Composite(Gold-Stocks-Bond) Timer: The model’s out of sample performance YTD is 20.0%, and for the last 12 months is 21.7%. Over the same period the benchmark SPY performance was 22.3% and 21.5% respectively. Over the previous week the market value of the iM-Composite(Gold-Stocks-Bond) Timer gained 1.44% at a time when SPY gained 1.22%. A starting capital of $100,000 at inception on 6/30/2016 would have grown to $124,618 which includes $53 cash and excludes $1,955 spent on fees and slippage. |
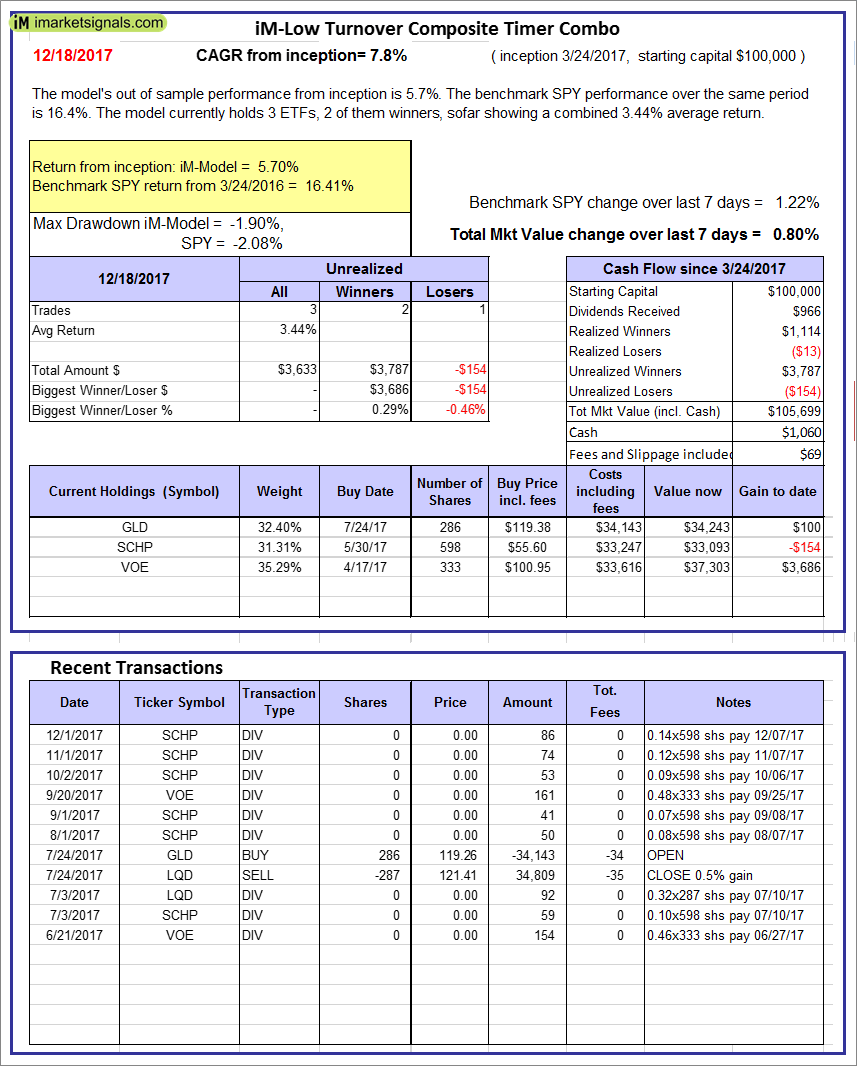 |
iM-Low Turnover Composite Timer Combo: The model’s out of sample performance from inception is 5.7%. The benchmark SPY performance over the same period is 16.4%. Over the previous week the market value of the iM-Low Turnover Composite Timer Combo gained 0.80% at a time when SPY gained 1.22%. A starting capital of $100,000 at inception on 3/24/27 would have grown to $105,699 which includes $1,060 cash and excludes $69 spent on fees and slippage. |
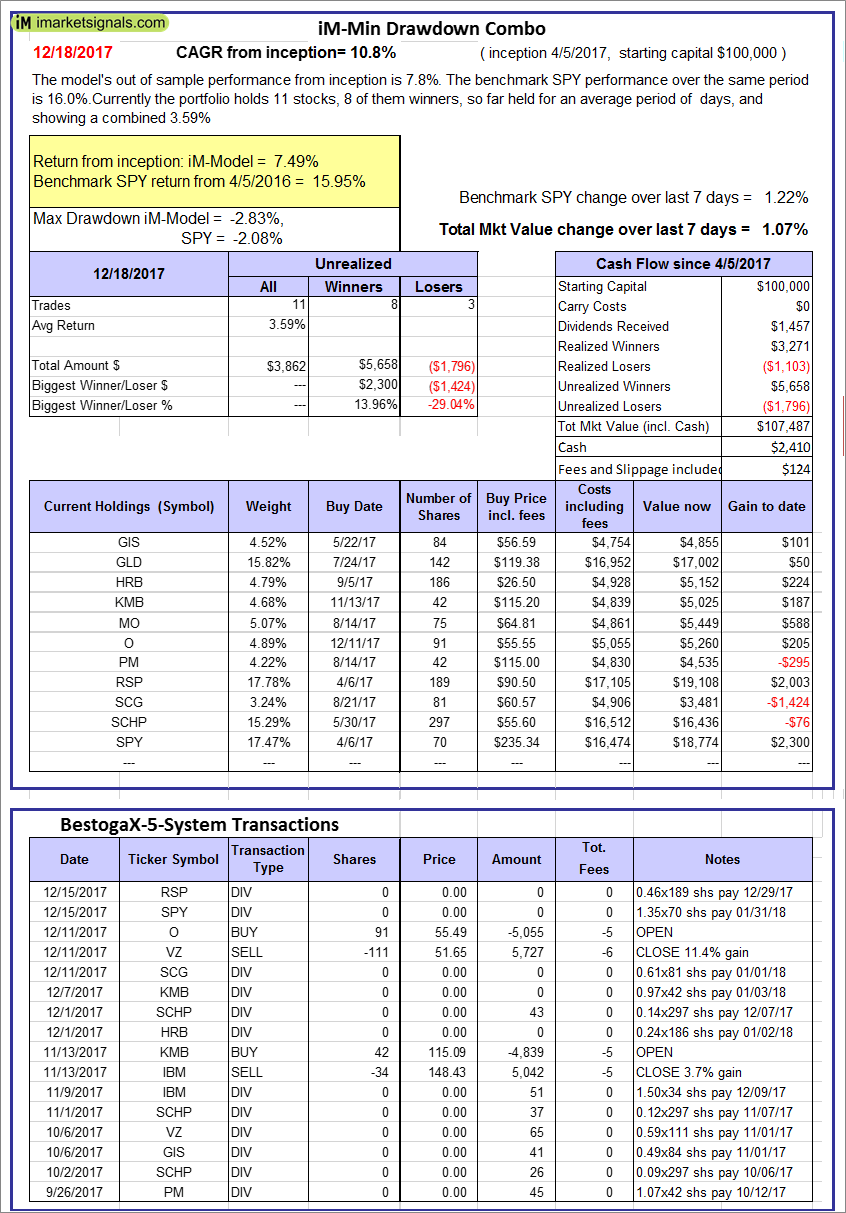 |
iM-Min Drawdown Combo: The model’s out of sample performance from inception is 7.8%. The benchmark SPY performance over the same period is 16.0%. Over the previous week the market value of the iM-Min Drawdown Combo gained 1.07% at a time when SPY gained 1.22%. A starting capital of $100,000 at inception on 4/5/2017 would have grown to $107,487 which includes $2,410 cash and excludes $124 spent on fees and slippage. |
 |
iM-5ETF Trader (includes leveraged ETFs): The model’s out of sample performance YTD is 46.3%, and for the last 12 months is 45.3%. Over the same period the benchmark SPY performance was 22.3% and 21.5% respectively. Over the previous week the market value of the iM-5ETF Trader (includes leveraged ETFs) gained 2.94% at a time when SPY gained 1.22%. A starting capital of $100,000 at inception on 10/30/2016 would have grown to $165,076 which includes $757 cash and excludes $1,030 spent on fees and slippage. |
 |
iM-Standard 5ETF Trader (excludes leveraged ETFs): The model’s out of sample performance YTD is 22.4%, and for the last 12 months is 22.2%. Over the same period the benchmark SPY performance was 22.3% and 21.5% respectively. Over the previous week the market value of the iM-Standard 5ETF Trader (excludes leveraged ETFs) gained 1.02% at a time when SPY gained 1.22%. A starting capital of $100,000 at inception on 10/30/2016 would have grown to $125,757 which includes $1,385 cash and excludes $880 spent on fees and slippage. |
Posted in pmp SPY-SH
iM-Best Reports – 12/12/2017
  |
Out of sample performance summary of our models for the past 1, 2, 4 and 13 week periods. The active active return indicates how the models over- or underperformed the benchmark ETF SPY. Also the YTD, and the 1-, 3-, 5- and 10-year annualized returns are shown in the second table |
 |
iM-Best(SPY-SH).R1: The model’s out of sample performance YTD is 21.4%, and for the last 12 months is 19.8%. Over the same period the benchmark SPY performance was 20.8% and 19.9% respectively. Over the previous week the market value of Best(SPY-SH) gained 0.81% at a time when SPY gained 0.82%. A starting capital of $100,000 at inception on 1/2/2009 would have grown to $561,146 which includes $7,222 cash and excludes $15,358 spent on fees and slippage. |
 |
iM-Combo3.R1: The model’s out of sample performance YTD is 24.9%, and for the last 12 months is 23.6%. Over the same period the benchmark SPY performance was 20.8% and 19.9% respectively. Over the previous week the market value of iM-Combo3.R1 gained 1.71% at a time when SPY gained 0.82%. A starting capital of $100,000 at inception on 2/3/2014 would have grown to $156,885 which includes -$544 cash and excludes $3,437 spent on fees and slippage. |
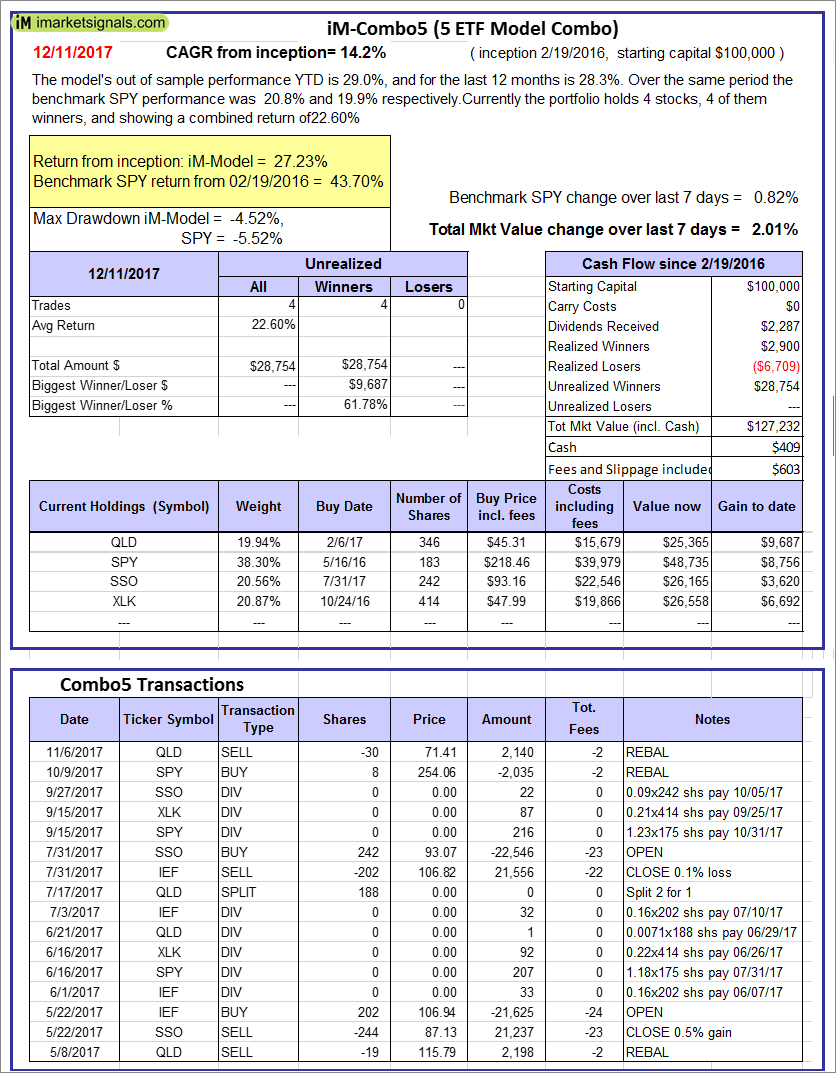 |
iM-Combo5: The model’s out of sample performance YTD is 29.0%, and for the last 12 months is 28.3%. Over the same period the benchmark SPY performance was 20.8% and 19.9% respectively. Over the previous week the market value of iM-Combo5 gained 2.01% at a time when SPY gained 0.82%. A starting capital of $100,000 at inception on 2/22/2016 would have grown to $127,232 which includes $409 cash and excludes $603 spent on fees and slippage. |
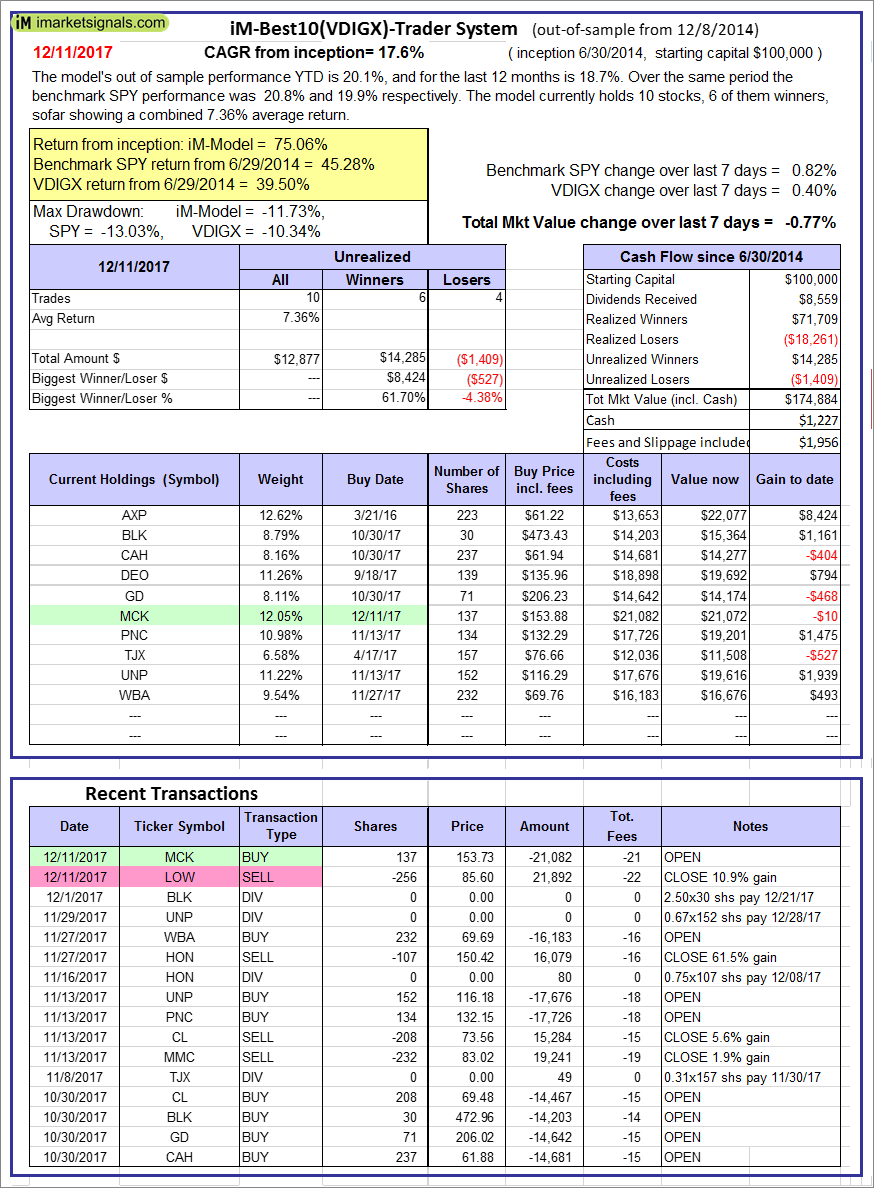  |
iM-Best10(VDIGX)-Trader: The model’s out of sample performance YTD is 20.1%, and for the last 12 months is 18.7%. Over the same period the benchmark SPY performance was 20.8% and 19.9% respectively. Since inception, on 7/1/2014, the model gained 75.06% while the benchmark SPY gained 45.28% and VDIGX gained 39.50% over the same period. Over the previous week the market value of iM-Best10(VDIGX) gained -0.77% at a time when SPY gained 0.82%. A starting capital of $100,000 at inception on 7/1/2014 would have grown to $174,884 which includes $1,227 cash and excludes $1,956 spent on fees and slippage. |
 |
iM-BESTOGA-3: The model’s out of sample performance YTD is 13.7%, and for the last 12 months is 14.2%. Over the same period the benchmark SPY performance was 20.8% and 19.9% respectively. Over the previous week the market value of iM-BESTOGA-3 gained 0.05% at a time when SPY gained 0.82%. A starting capital of $100,000 at inception on 2/3/2014 would have grown to $229,553 which includes $1,003 cash and excludes $1,818 spent on fees and slippage. |
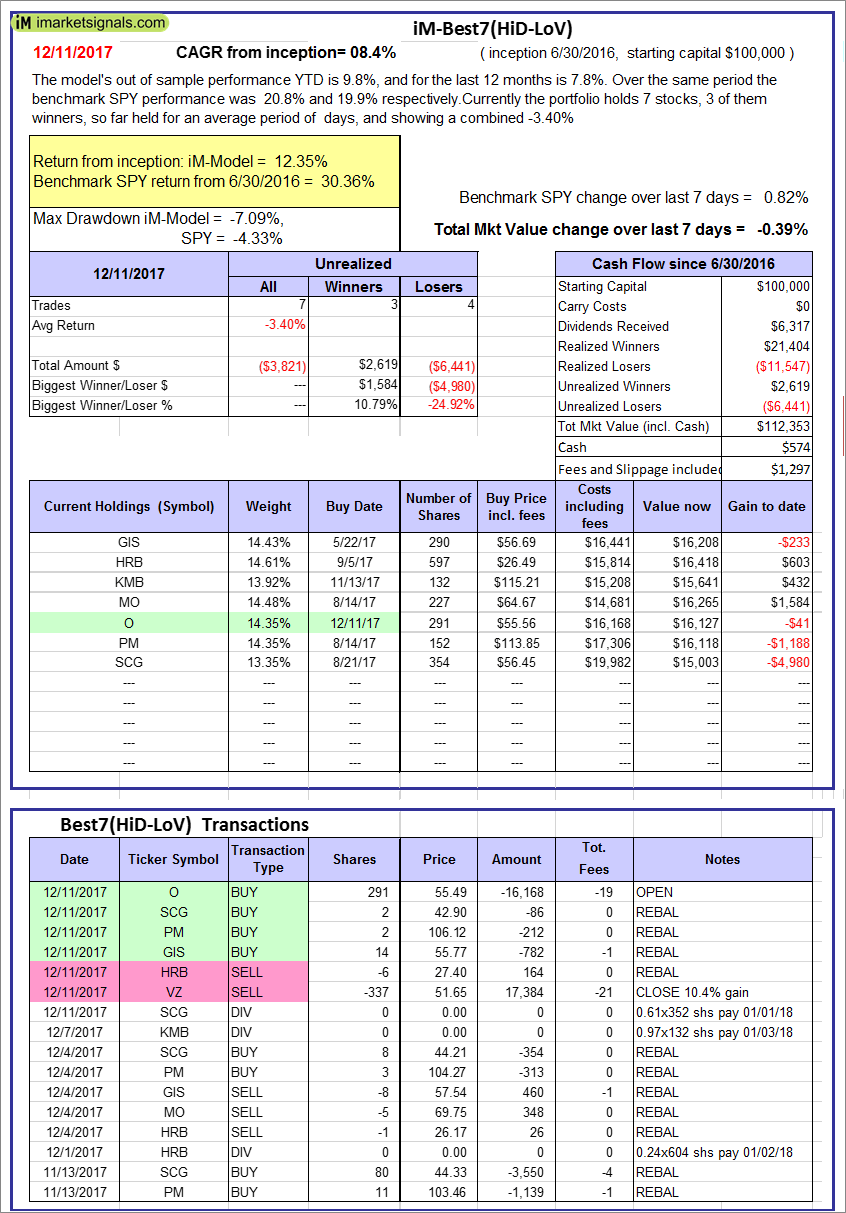 |
iM-Best7(HiD-LoV): The model’s out of sample performance YTD is 9.8%, and for the last 12 months is 7.8%. Over the same period the benchmark SPY performance was 20.8% and 19.9% respectively. Over the previous week the market value of iM-BESTOGA-3 gained -0.39% at a time when SPY gained 0.82%. A starting capital of $100,000 at inception on 6/30/2016 would have grown to $112,353 which includes $574 cash and excludes $1,297 spent on fees and slippage. |
 |
iM 6-Stock Capital Strength Portfolio: The model’s out of sample performance YTD is 42.8%, and for the last 12 months is 38.7%. Over the same period the benchmark SPY performance was 20.8% and 19.9% respectively. Over the previous week the market value of the iM 6-Stock Capital Strength Portfolio gained -0.23% at a time when SPY gained 0.82%. A starting capital of $100,000 at inception on 10/28/2016 would have grown to $150,550 which includes $907 cash and excludes $559 spent on fees and slippage. |
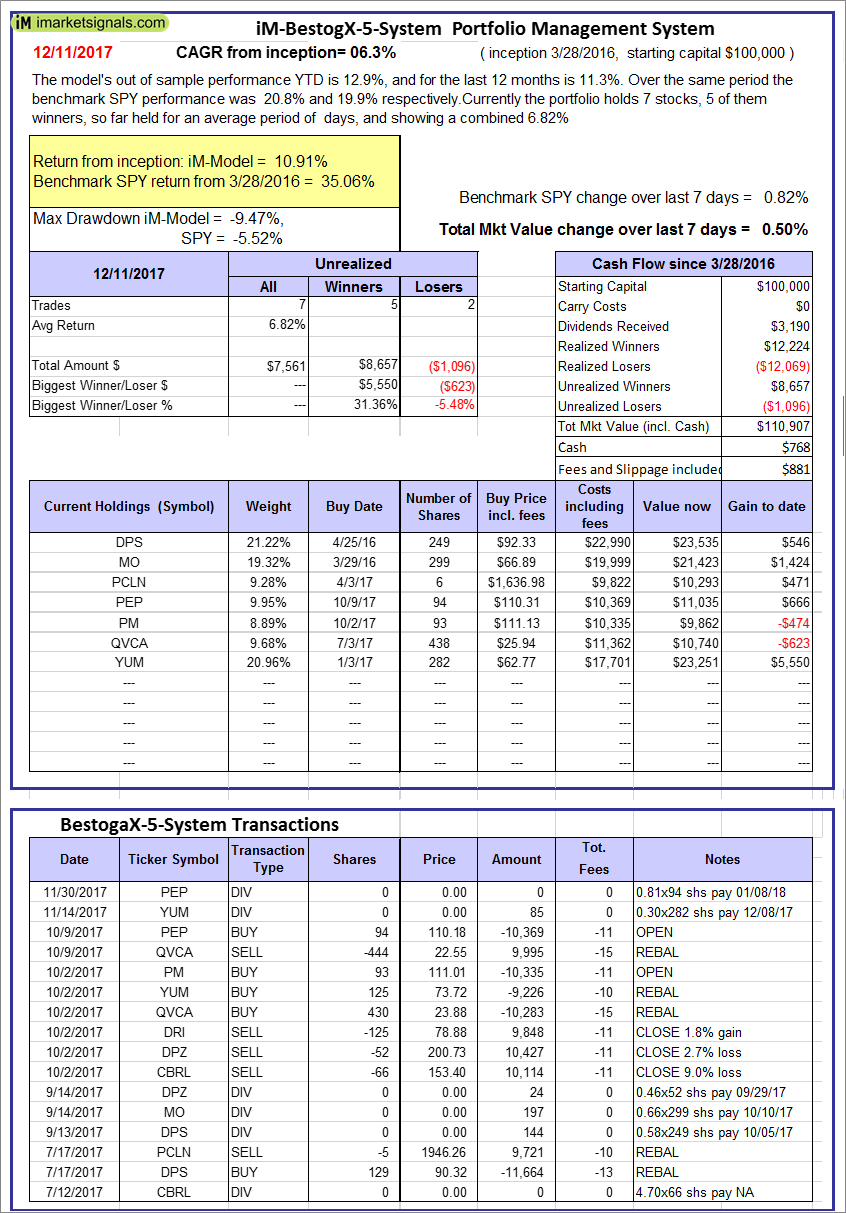 |
iM-BestogaX5-System: The model’s out of sample performance YTD is 12.9%, and for the last 12 months is 11.3%. Over the same period the benchmark SPY performance was 20.8% and 19.9% respectively. Over the previous week the market value of iM-Best8(S&P 500)Tax-Eff. gained 0.50% at a time when SPY gained 0.82%. A starting capital of $100,000 at inception on 3/28/2016 would have grown to $110,907 which includes $768 cash and excludes $881 spent on fees and slippage. |
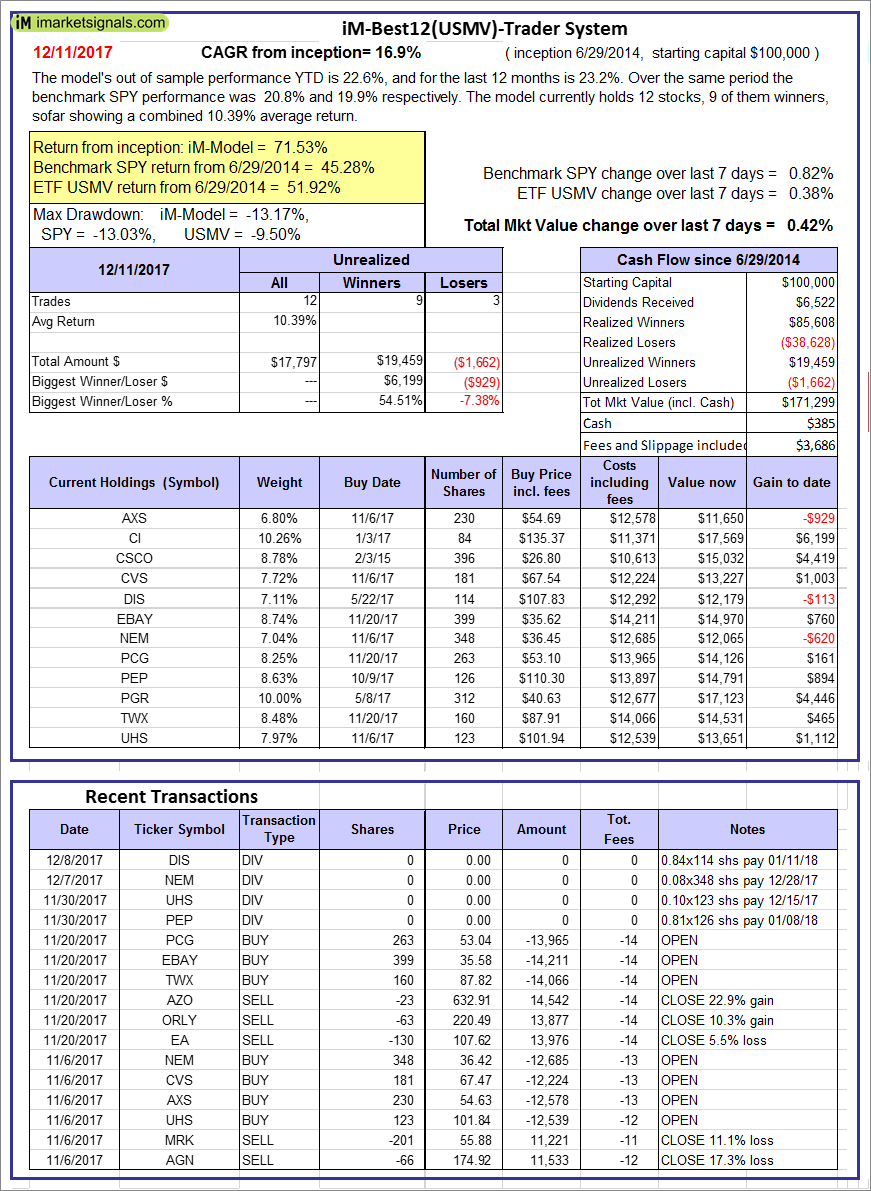 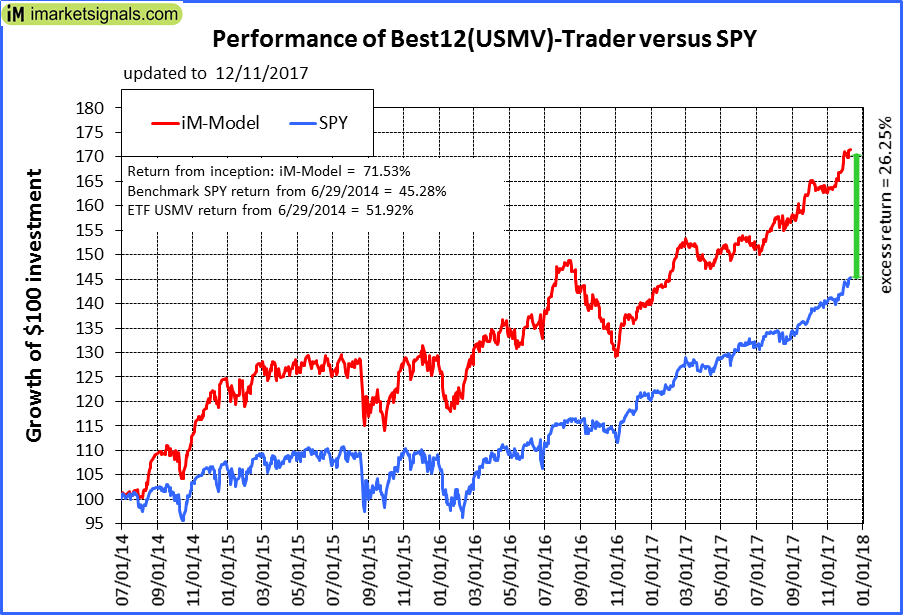 |
iM-Best12(USMV)-Trader: The model’s out of sample performance YTD is 22.6%, and for the last 12 months is 23.2%. Over the same period the benchmark SPY performance was 20.8% and 19.9% respectively. Since inception, on 6/30/2014, the model gained 71.53% while the benchmark SPY gained 45.28% and the ETF USMV gained 51.92% over the same period. Over the previous week the market value of iM-Best12(USMV)-Trader gained 0.42% at a time when SPY gained 0.82%. A starting capital of $100,000 at inception on 6/30/2014 would have grown to $171,299 which includes $385 cash and excludes $3,686 spent on fees and slippage. |
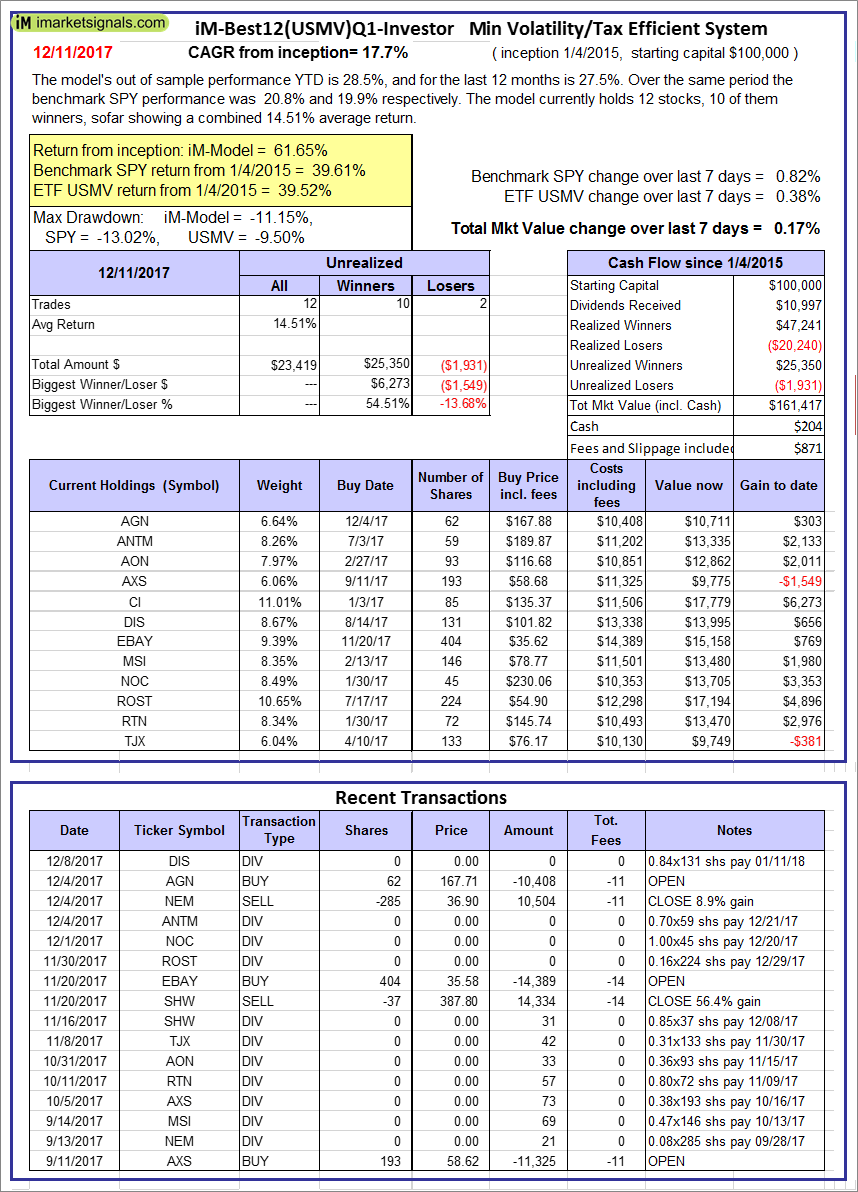  |
iM-Best12(USMV)Q1-Investor: The model’s out of sample performance YTD is 28.5%, and for the last 12 months is 27.5%. Over the same period the benchmark SPY performance was 20.8% and 19.9% respectively. Since inception, on 1/5/2015, the model gained 61.65% while the benchmark SPY gained 39.61% and the ETF USMV gained 39.52% over the same period. Over the previous week the market value of iM-Best12(USMV)Q1 gained 0.17% at a time when SPY gained 0.82%. A starting capital of $100,000 at inception on 1/5/2015 would have grown to $161,417 which includes $204 cash and excludes $871 spent on fees and slippage. |
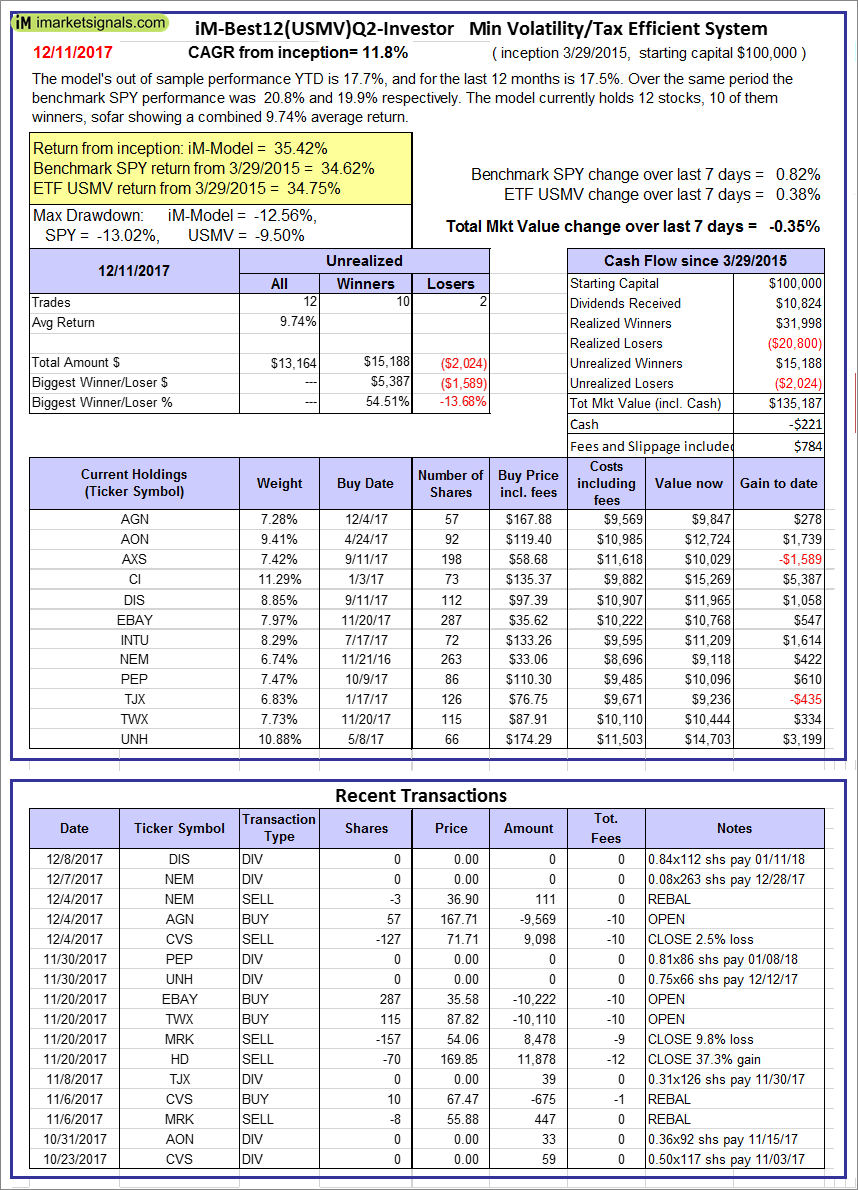 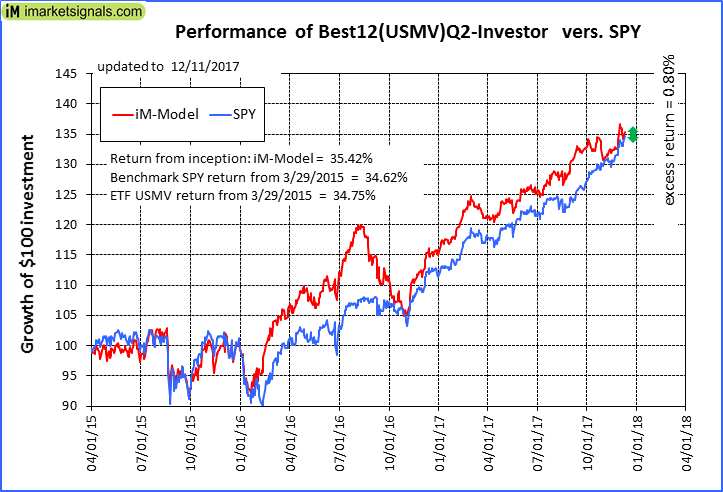 |
iM-Best12(USMV)Q2-Investor: The model’s out of sample performance YTD is 17.7%, and for the last 12 months is 17.5%. Over the same period the benchmark SPY performance was 20.8% and 19.9% respectively. Since inception, on 3/30/2015, the model gained 35.42% while the benchmark SPY gained 34.62% and the ETF USMV gained 34.75% over the same period. Over the previous week the market value of iM-Best12(USMV)Q2 gained -0.35% at a time when SPY gained 0.82%. A starting capital of $100,000 at inception on 3/30/2015 would have grown to $135,187 which includes -$221 cash and excludes $784 spent on fees and slippage. |
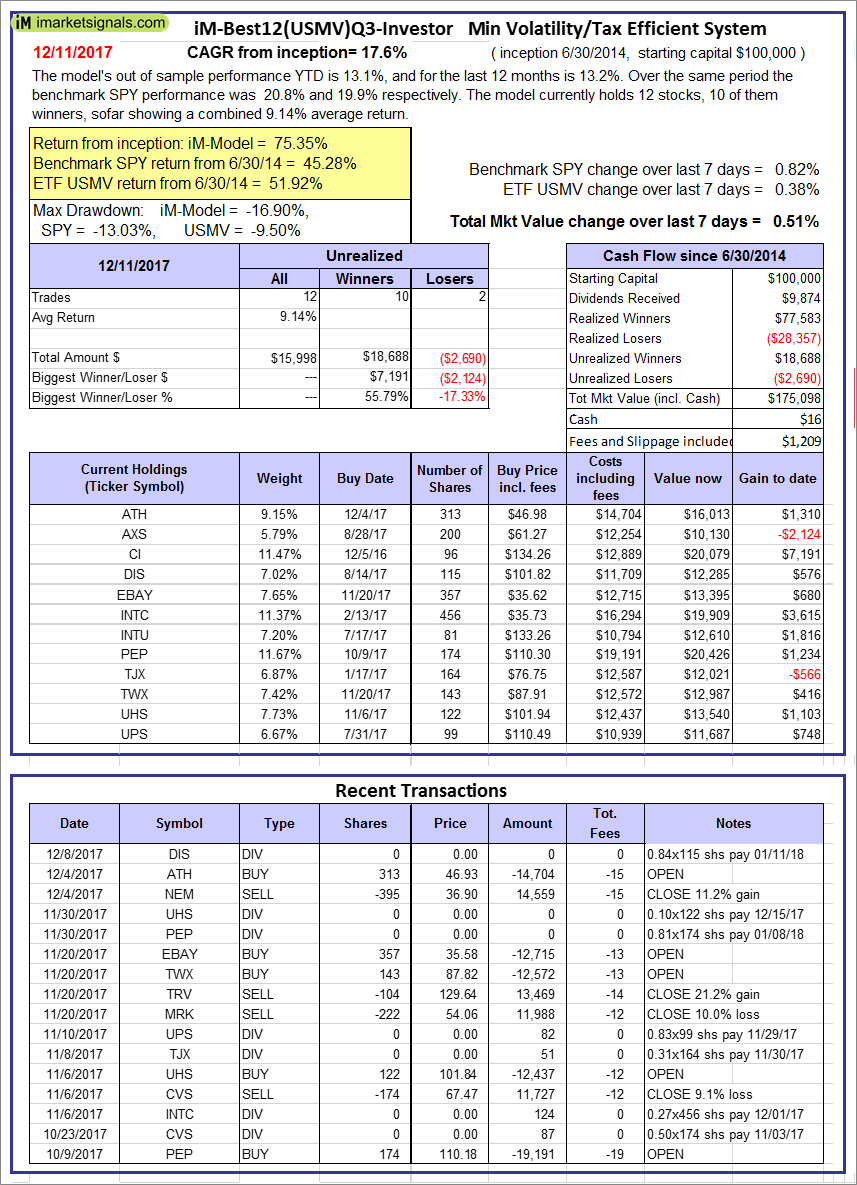 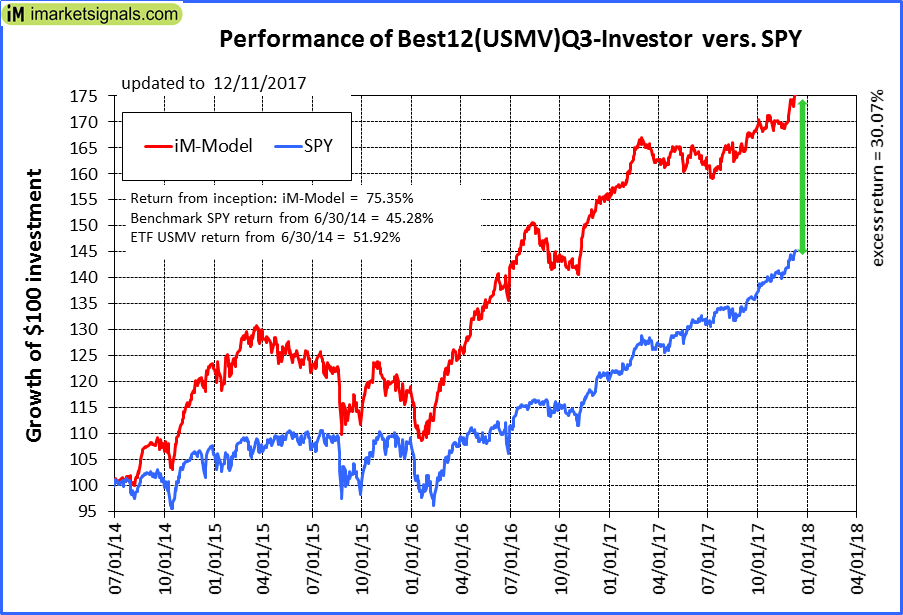 |
iM-Best12(USMV)Q3-Investor: The model’s out of sample performance YTD is 13.1%, and for the last 12 months is 13.2%. Over the same period the benchmark SPY performance was 20.8% and 19.9% respectively. Since inception, on 7/1/2014, the model gained 75.35% while the benchmark SPY gained 45.28% and the ETF USMV gained 51.92% over the same period. Over the previous week the market value of iM-Best12(USMV)Q3 gained 0.51% at a time when SPY gained 0.82%. A starting capital of $100,000 at inception on 7/1/2014 would have grown to $175,098 which includes $16 cash and excludes $1,209 spent on fees and slippage. |
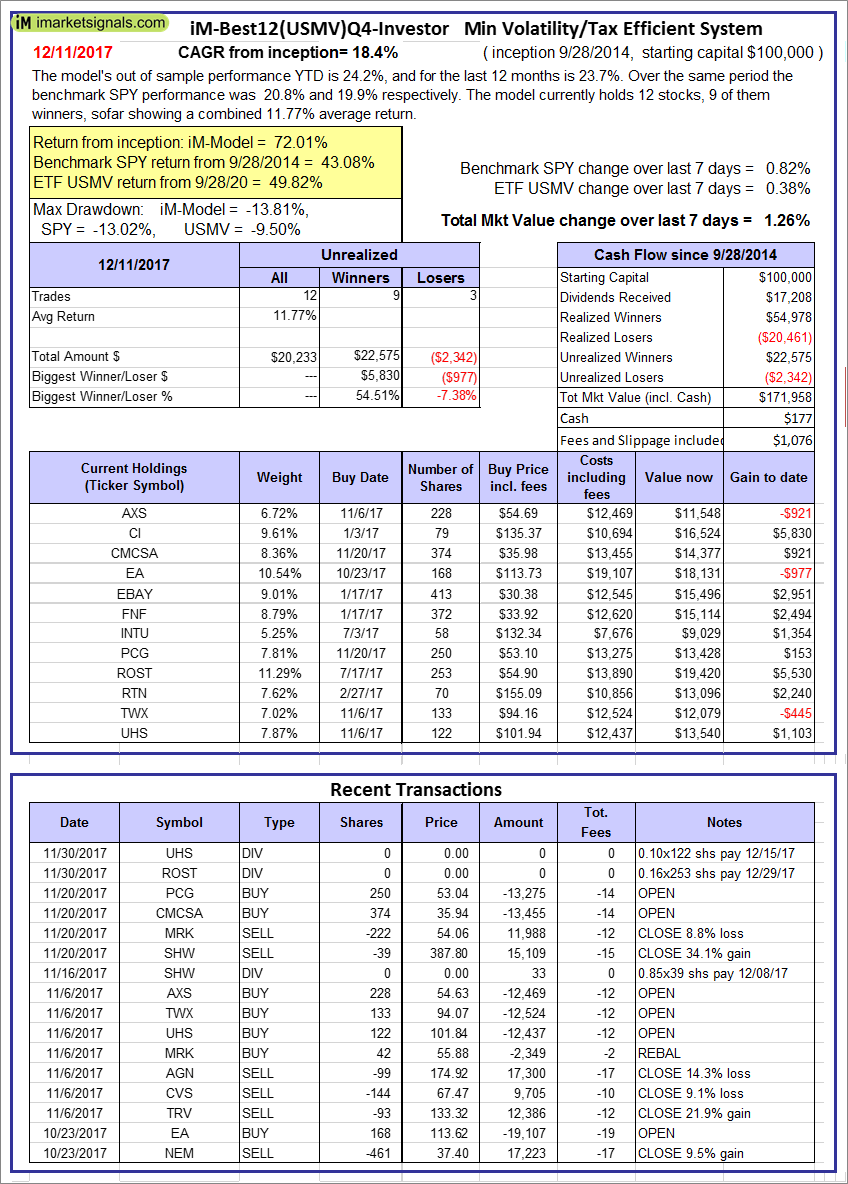  |
iM-Best12(USMV)Q4-Investor: Since inception, on 9/29/2014, the model gained 72.01% while the benchmark SPY gained 43.08% and the ETF USMV gained 49.82% over the same period. Over the previous week the market value of iM-Best12(USMV)Q4 gained 1.26% at a time when SPY gained 0.82%. A starting capital of $100,000 at inception on 9/29/2014 would have grown to $171,958 which includes $177 cash and excludes $1,076 spent on fees and slippage. |
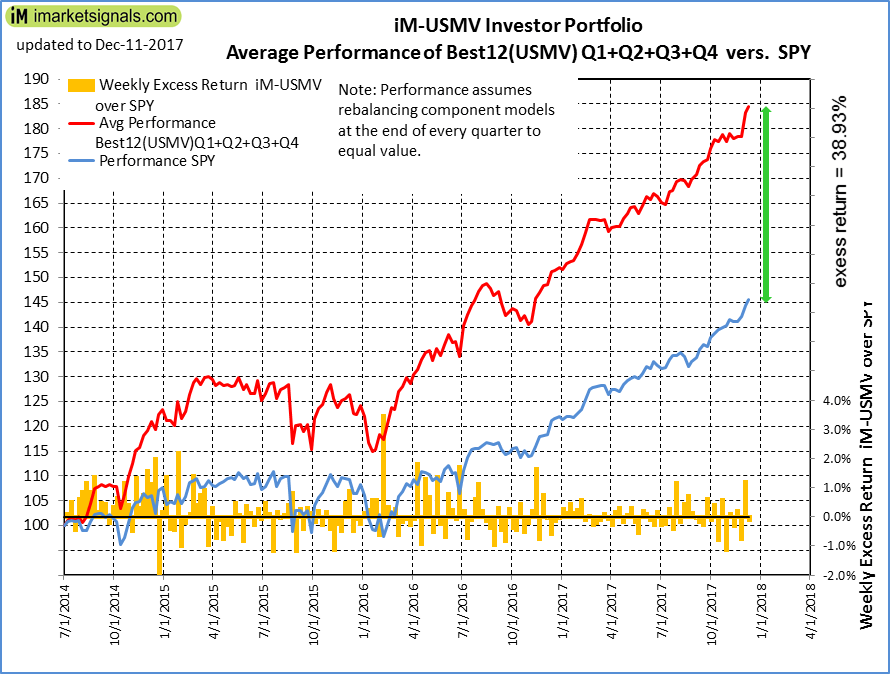 |
Average Performance of iM-Best12(USMV)Q1+Q2+Q3+Q4-Investor resulted in an excess return of 38.93% over SPY. (see iM-USMV Investor Portfolio) |
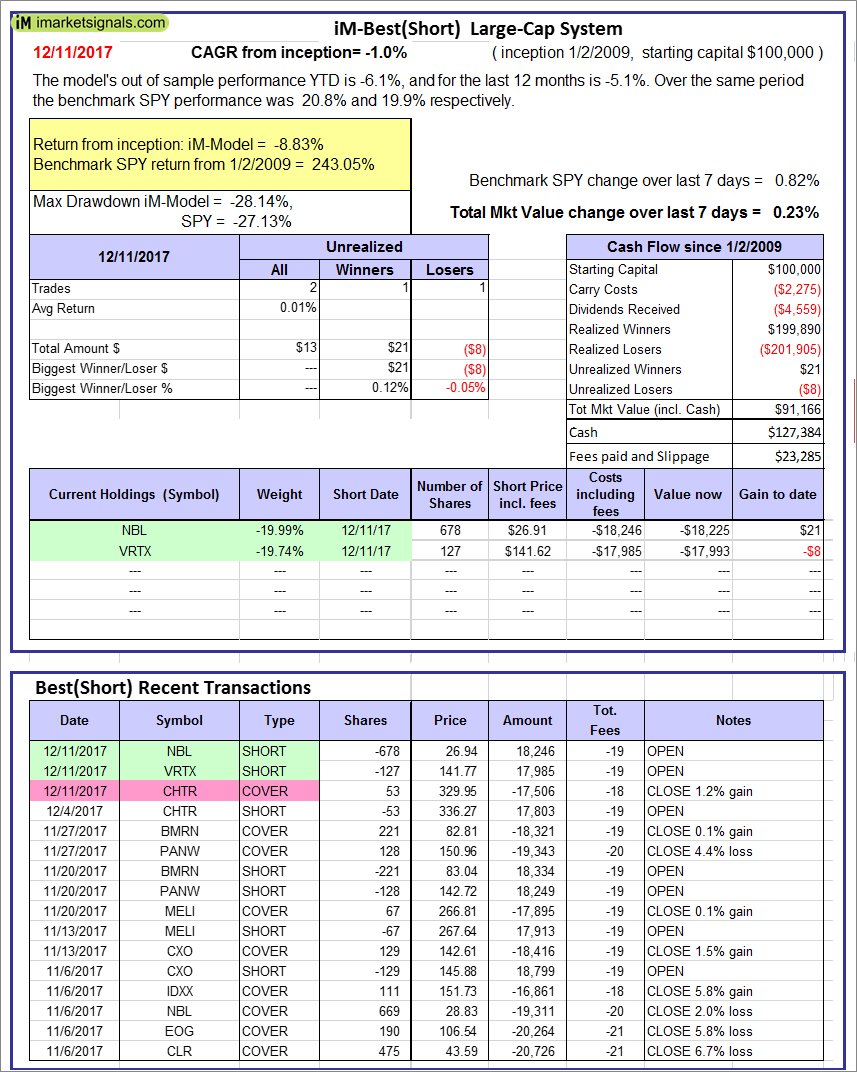 |
iM-Best(Short): The model’s out of sample performance YTD is -6.1%, and for the last 12 months is -5.1%. Over the same period the benchmark SPY performance was 20.8% and 19.9% respectively. Over the previous week the market value of iM-Best(Short) gained 0.23% at a time when SPY gained 0.82%. Over the period 1/2/2009 to 12/11/2017 the starting capital of $100,000 would have grown to $91,166 which includes $127,384 cash and excludes $23,285 spent on fees and slippage. |
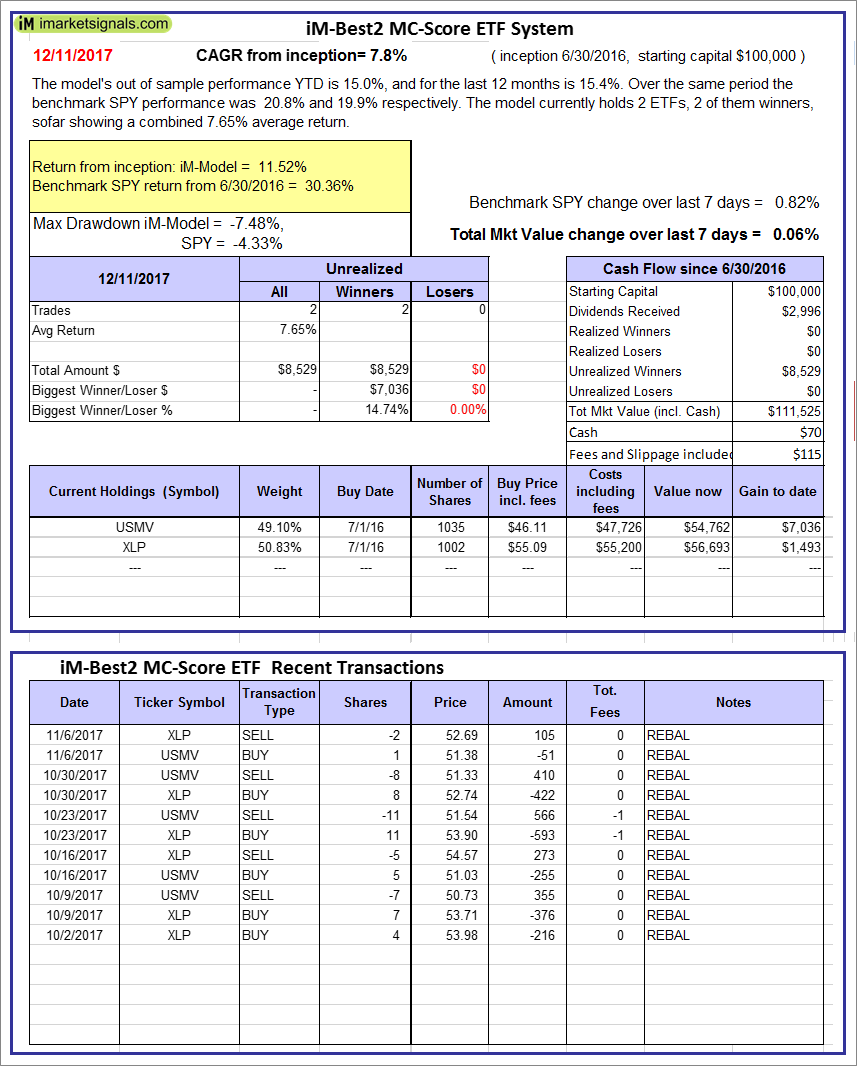 |
iM-Best2 MC-Score ETF System: The model’s out of sample performance YTD is 15.0%, and for the last 12 months is 15.4%. Over the same period the benchmark SPY performance was 20.8% and 19.9% respectively. Over the previous week the market value of the iM-Best2 MC-Score ETF System gained 0.06% at a time when SPY gained 0.82%. A starting capital of $100,000 at inception on 6/30/2016 would have grown to $111,525 which includes $70 cash and excludes $115 spent on fees and slippage. |
 |
iM-Best4 MC-Score Vanguard System: The model’s out of sample performance YTD is 12.2%, and for the last 12 months is 12.4%. Over the same period the benchmark SPY performance was 20.8% and 19.9% respectively. Over the previous week the market value of the iM-Best4 MC-Score Vanguard System gained -0.02% at a time when SPY gained 0.82%. A starting capital of $100,000 at inception on 6/30/2016 would have grown to $111,586 which includes $2,356 cash and excludes $00 spent on fees and slippage. |
 |
iM-Composite (SH-RSP) Timer: The model’s out of sample performance YTD is 17.3%, and for the last 12 months is 15.0%. Over the same period the benchmark SPY performance was 20.8% and 19.9% respectively. Over the previous week the market value of the iM-Composite (SH-RSP) Timer gained 0.33% at a time when SPY gained 0.82%. A starting capital of $100,000 at inception on 6/30/2016 would have grown to $128,852 which includes $1,593 cash and excludes $513 spent on fees and slippage. |
 |
iM-Composite (SPY-IEF) Timer: The model’s out of sample performance YTD is 23.0%, and for the last 12 months is 21.4%. Over the same period the benchmark SPY performance was 20.8% and 19.9% respectively. Over the previous week the market value of the iM-Composite (SPY-IEF) Timer gained 0.82% at a time when SPY gained 0.82%. A starting capital of $100,000 at inception on 6/30/2016 would have grown to $132,390 which includes $833 cash and excludes $1,390 spent on fees and slippage. |
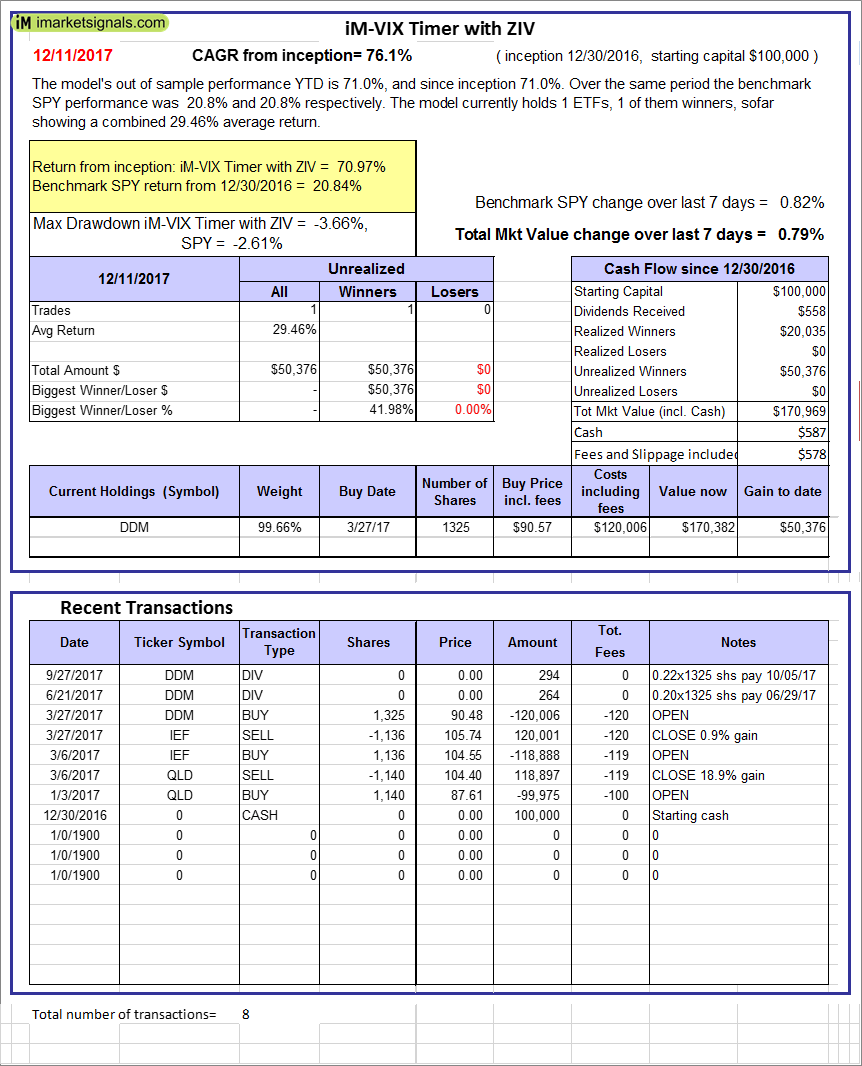 |
iM-VIX Timer with ZIV: The model’s out of sample performance YTD is 71.0%, and since inception 71.0%. Over the same period the benchmark SPY performance was 20.8% and 20.8% respectively. Over the previous week the market value of the iM-VIX Timer with ZIV gained 0.79% at a time when SPY gained 0.82%. A starting capital of $100,000 at inception on 6/30/2016 would have grown to $170,969 which includes $587 cash and excludes $578 spent on fees and slippage. |
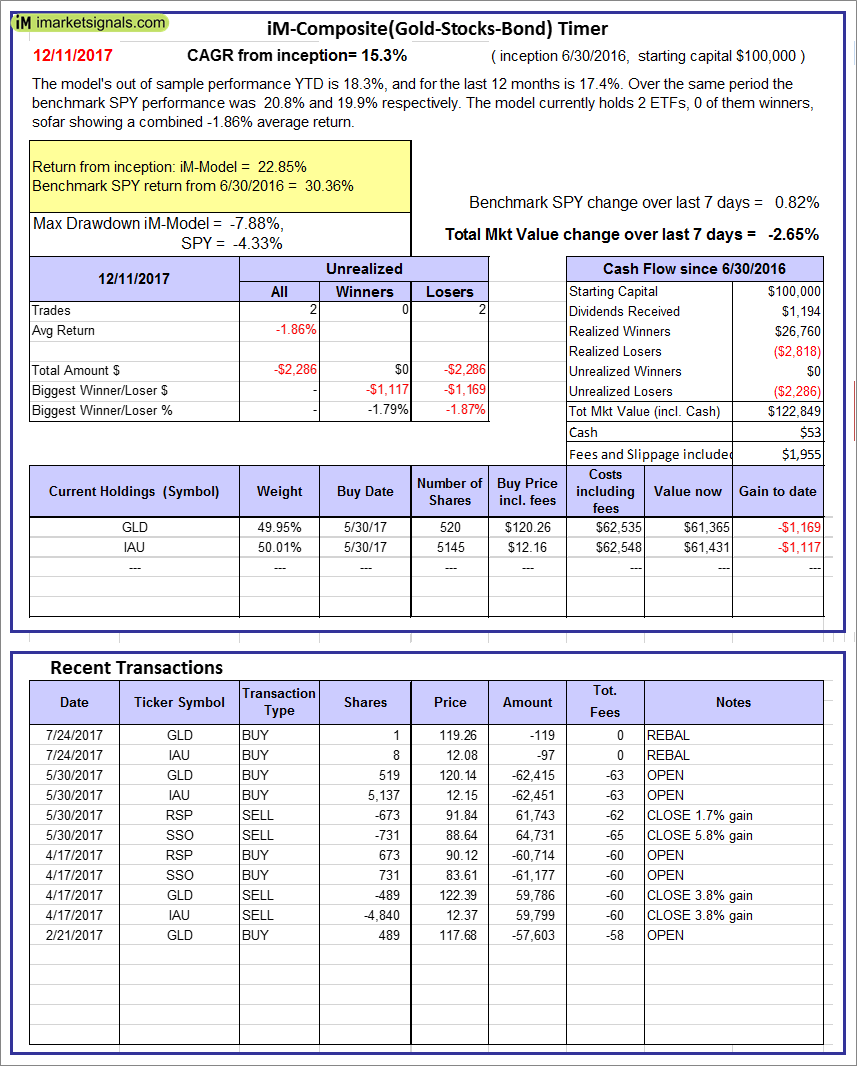 |
iM-Composite(Gold-Stocks-Bond) Timer: The model’s out of sample performance YTD is 18.3%, and for the last 12 months is 17.4%. Over the same period the benchmark SPY performance was 20.8% and 19.9% respectively. Over the previous week the market value of the iM-Composite(Gold-Stocks-Bond) Timer gained -2.65% at a time when SPY gained 0.82%. A starting capital of $100,000 at inception on 6/30/2016 would have grown to $122,849 which includes $53 cash and excludes $1,955 spent on fees and slippage. |
 |
iM-Low Turnover Composite Timer Combo: The model’s out of sample performance from inception is 4.9%. The benchmark SPY performance over the same period is 15.0%. Over the previous week the market value of the iM-Low Turnover Composite Timer Combo gained -0.69% at a time when SPY gained 0.82%. A starting capital of $100,000 at inception on 3/24/27 would have grown to $104,857 which includes $1,060 cash and excludes $69 spent on fees and slippage. |
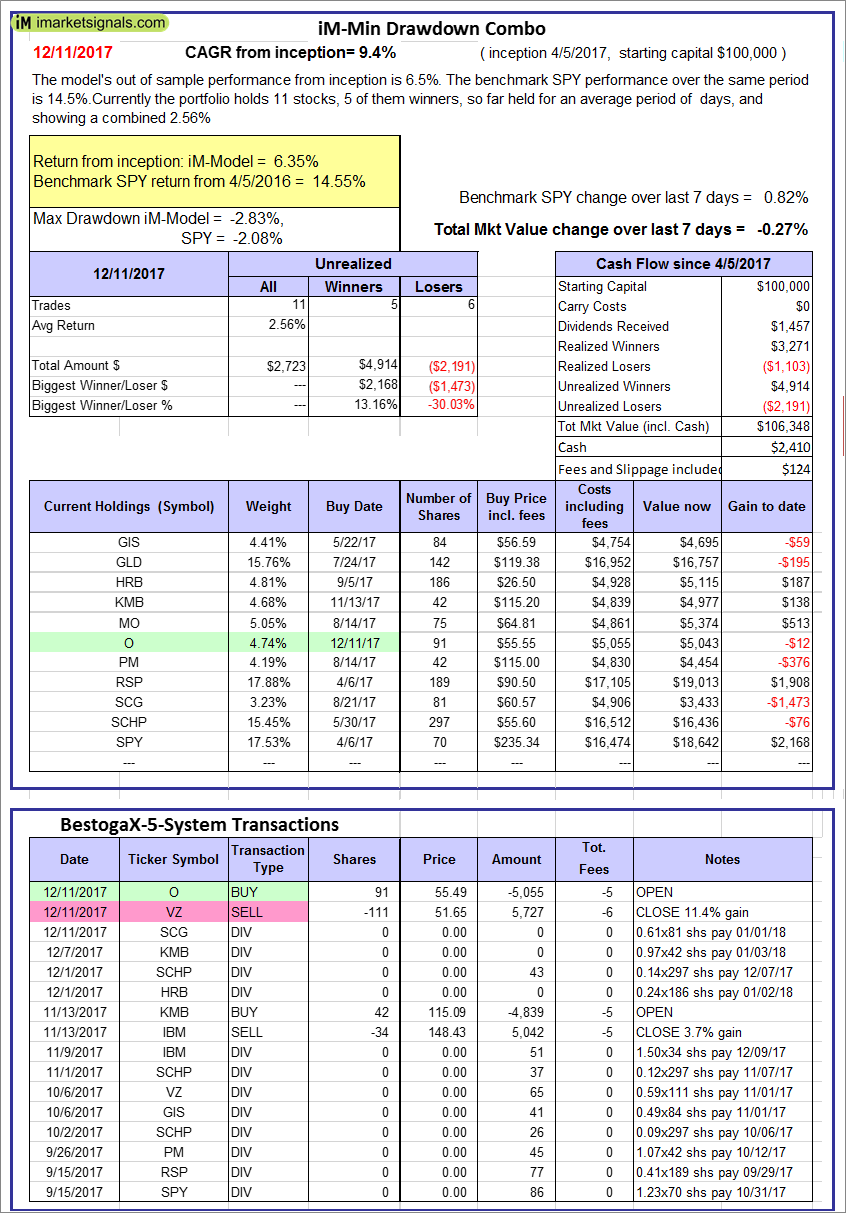 |
iM-Min Drawdown Combo: The model’s out of sample performance from inception is 6.5%. The benchmark SPY performance over the same period is 14.5%. Over the previous week the market value of the iM-Min Drawdown Combo gained -0.27% at a time when SPY gained 0.82%. A starting capital of $100,000 at inception on 4/5/2017 would have grown to $106,348 which includes $2,410 cash and excludes $124 spent on fees and slippage. |
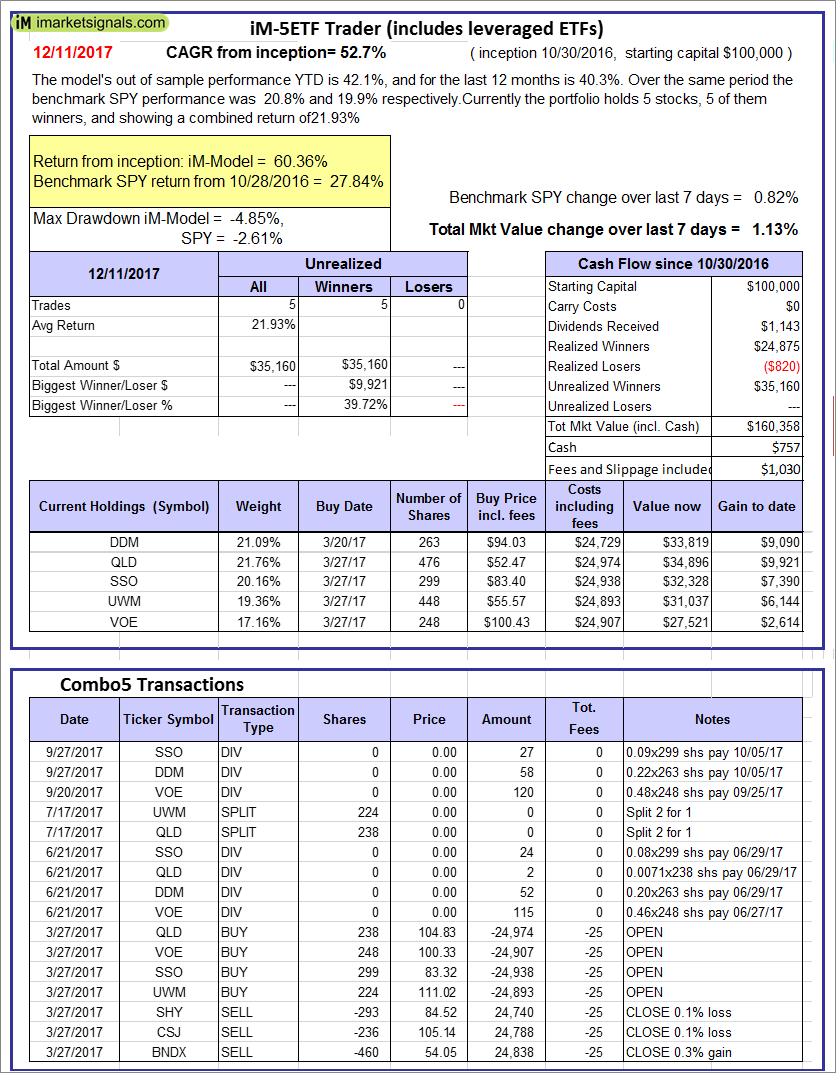 |
iM-5ETF Trader (includes leveraged ETFs): The model’s out of sample performance YTD is 42.1%, and for the last 12 months is 40.3%. Over the same period the benchmark SPY performance was 20.8% and 19.9% respectively. Over the previous week the market value of the iM-5ETF Trader (includes leveraged ETFs) gained 1.13% at a time when SPY gained 0.82%. A starting capital of $100,000 at inception on 10/30/2016 would have grown to $160,358 which includes $757 cash and excludes $1,030 spent on fees and slippage. |
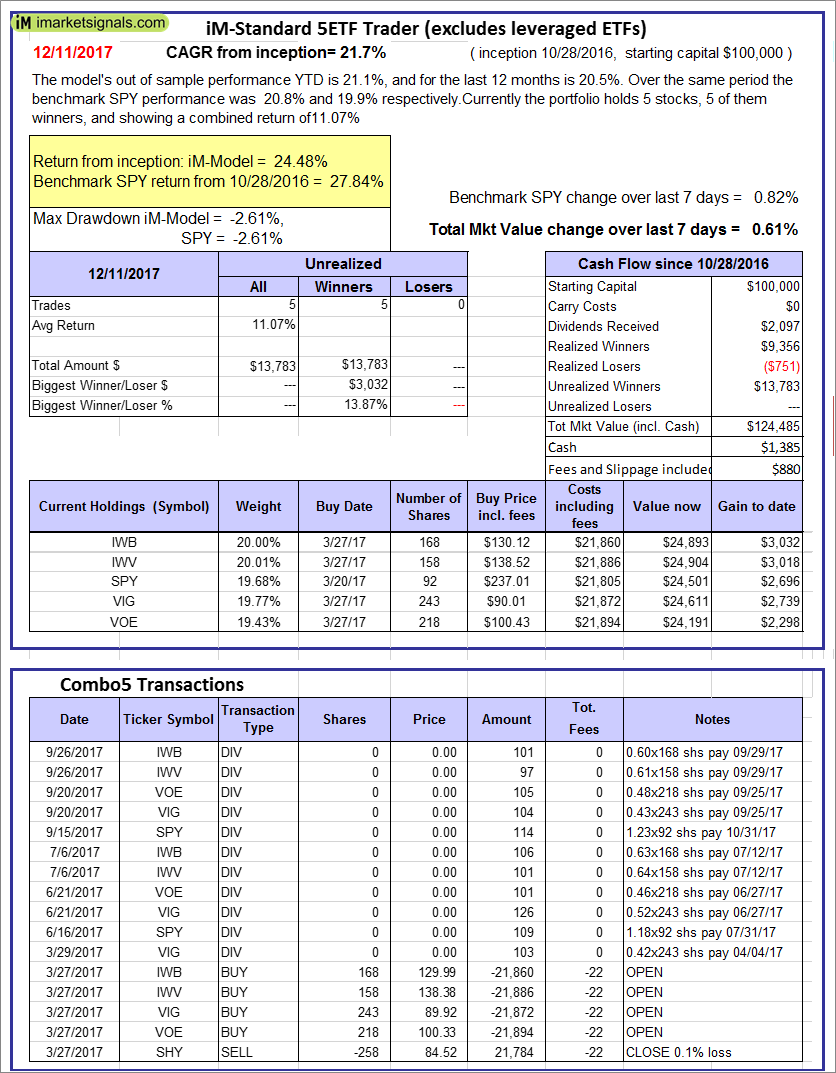 |
iM-Standard 5ETF Trader (excludes leveraged ETFs): The model’s out of sample performance YTD is 21.1%, and for the last 12 months is 20.5%. Over the same period the benchmark SPY performance was 20.8% and 19.9% respectively. Over the previous week the market value of the iM-Standard 5ETF Trader (excludes leveraged ETFs) gained 0.61% at a time when SPY gained 0.82%. A starting capital of $100,000 at inception on 10/30/2016 would have grown to $124,485 which includes $1,385 cash and excludes $880 spent on fees and slippage. |
Posted in pmp SPY-SH
iM-Best Reports – 11/27/2017
  |
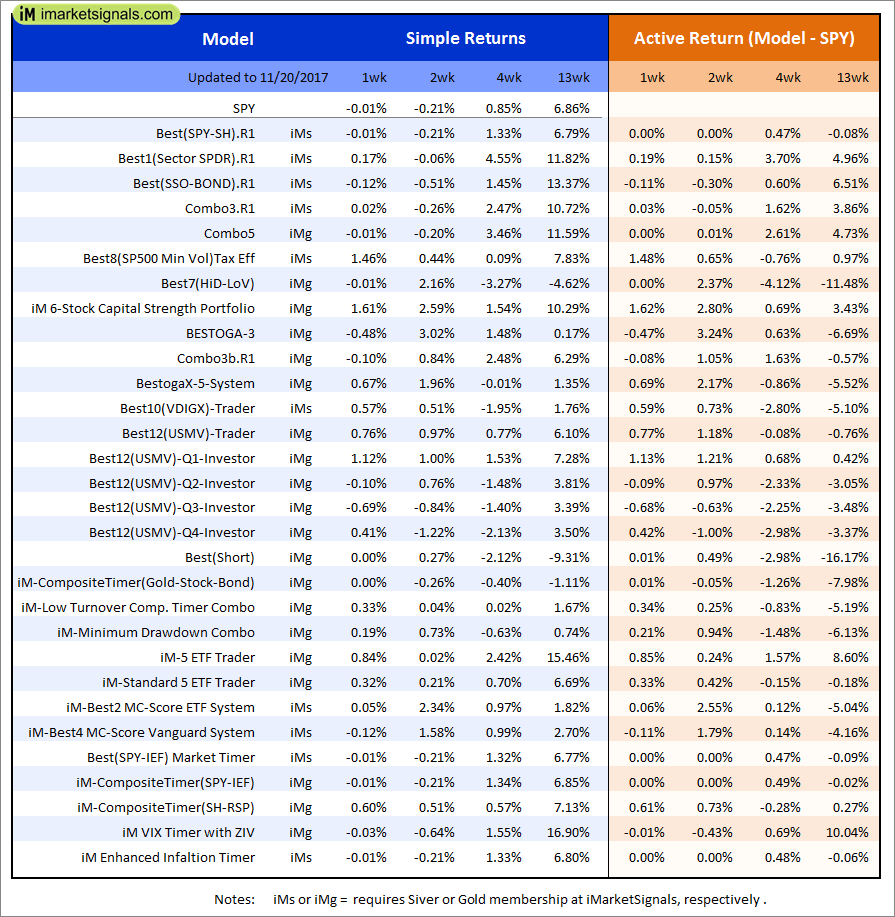
Out of sample performance summary of our models for the past 1, 2, 4 and 13 week periods. The active active return indicates how the models over- or underperformed the benchmark ETF SPY. Also the YTD, and the 1-, 3-, 5- and 10-year annualized returns are shown in the second table |
 |
iM-Best(SPY-SH).R1: The model’s out of sample performance YTD is 18.7%, and for the last 12 months is 19.7%. Over the same period the benchmark SPY performance was 18.1% and 19.8% respectively. Over the previous week the market value of Best(SPY-SH) gained 0.74% at a time when SPY gained 0.75%. A starting capital of $100,000 at inception on 1/2/2009 would have grown to $548,500 which includes $7,222 cash and excludes $15,358 spent on fees and slippage. |
 |
iM-Combo3.R1: The model’s out of sample performance YTD is 22.3%, and for the last 12 months is 24.3%. Over the same period the benchmark SPY performance was 18.1% and 19.8% respectively. Over the previous week the market value of iM-Combo3.R1 gained 1.24% at a time when SPY gained 0.75%. A starting capital of $100,000 at inception on 2/3/2014 would have grown to $153,638 which includes -$544 cash and excludes $3,437 spent on fees and slippage. |
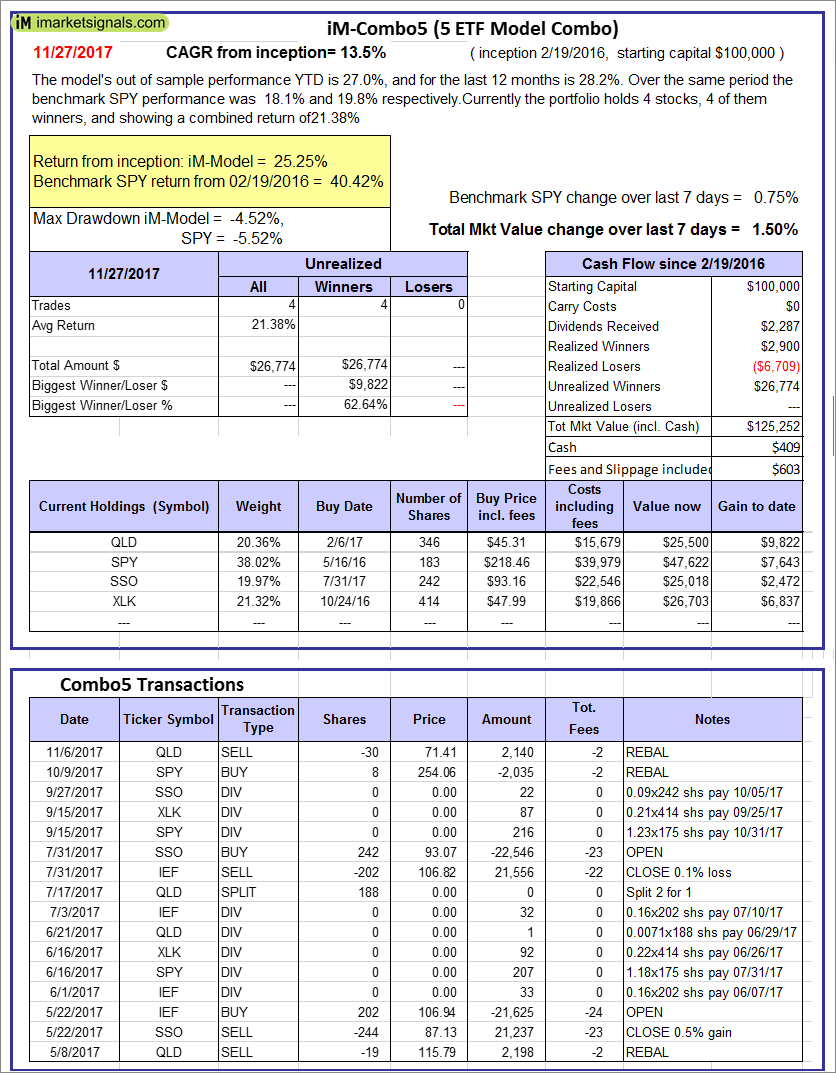 |
iM-Combo5: The model’s out of sample performance YTD is 27.0%, and for the last 12 months is 28.2%. Over the same period the benchmark SPY performance was 18.1% and 19.8% respectively. Over the previous week the market value of iM-Combo5 gained 1.50% at a time when SPY gained 0.75%. A starting capital of $100,000 at inception on 2/22/2016 would have grown to $125,252 which includes $409 cash and excludes $603 spent on fees and slippage. |
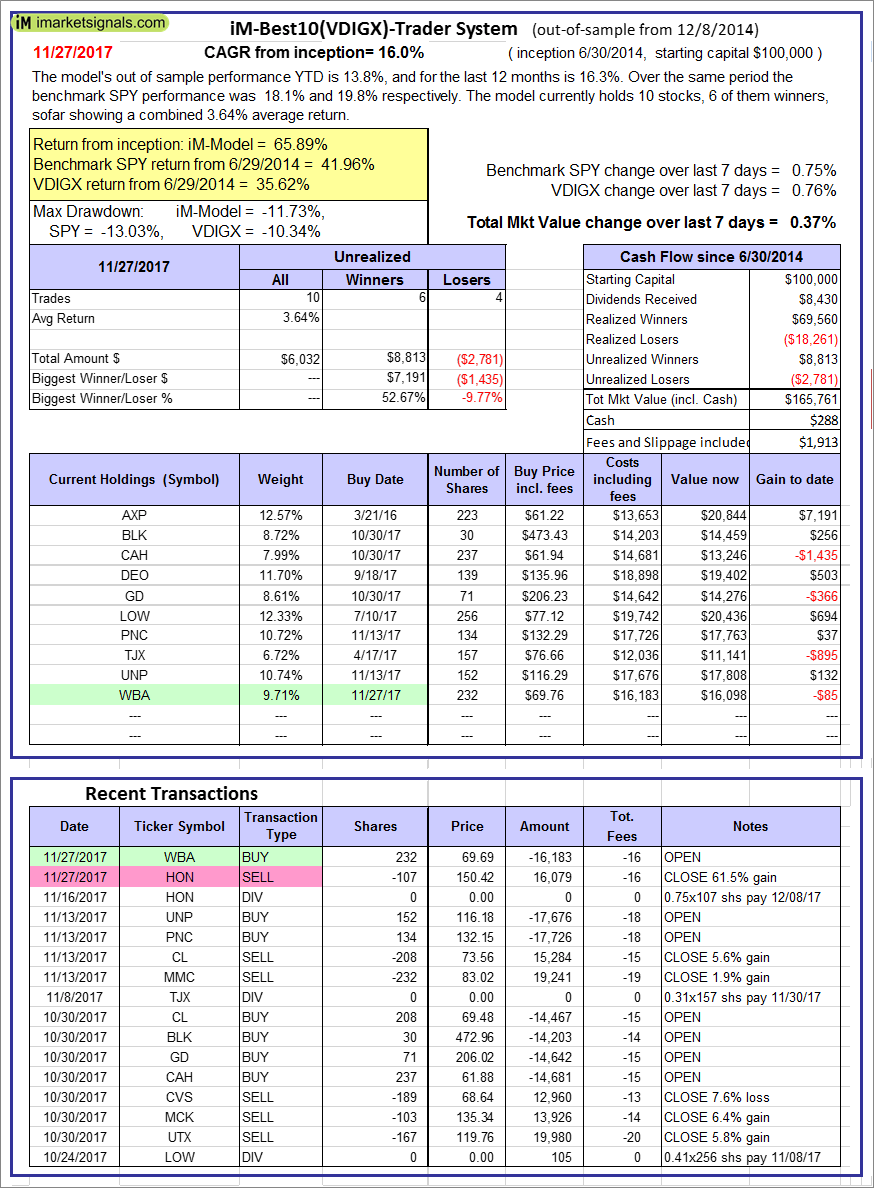 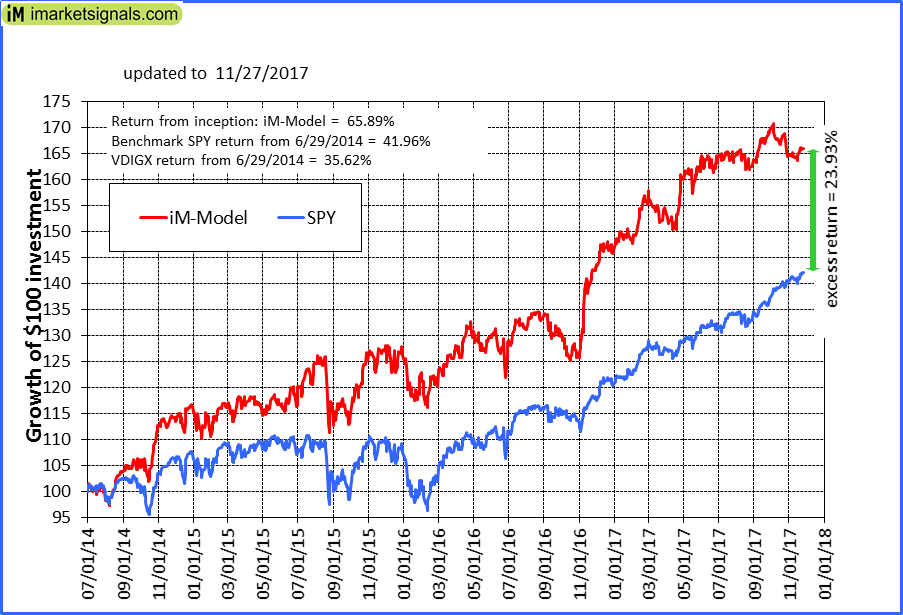 |
iM-Best10(VDIGX)-Trader: The model’s out of sample performance YTD is 13.8%, and for the last 12 months is 16.3%. Over the same period the benchmark SPY performance was 18.1% and 19.8% respectively. Since inception, on 7/1/2014, the model gained 65.89% while the benchmark SPY gained 41.96% and VDIGX gained 35.62% over the same period. Over the previous week the market value of iM-Best10(VDIGX) gained 0.37% at a time when SPY gained 0.75%. A starting capital of $100,000 at inception on 7/1/2014 would have grown to $165,761 which includes $288 cash and excludes $1,913 spent on fees and slippage. |
 |
iM-BESTOGA-3: The model’s out of sample performance YTD is 9.3%, and for the last 12 months is 10.6%. Over the same period the benchmark SPY performance was 18.1% and 19.8% respectively. Over the previous week the market value of iM-BESTOGA-3 gained 0.16% at a time when SPY gained 0.75%. A starting capital of $100,000 at inception on 2/3/2014 would have grown to $221,222 which includes $1,003 cash and excludes $1,818 spent on fees and slippage. |
 |
iM-Best7(HiD-LoV): The model’s out of sample performance YTD is 4.3%, and for the last 12 months is 4.0%. Over the same period the benchmark SPY performance was 18.1% and 19.8% respectively. Over the previous week the market value of iM-BESTOGA-3 gained 0.21% at a time when SPY gained 0.75%. A starting capital of $100,000 at inception on 6/30/2016 would have grown to $107,020 which includes -$58 cash and excludes $1,254 spent on fees and slippage. |
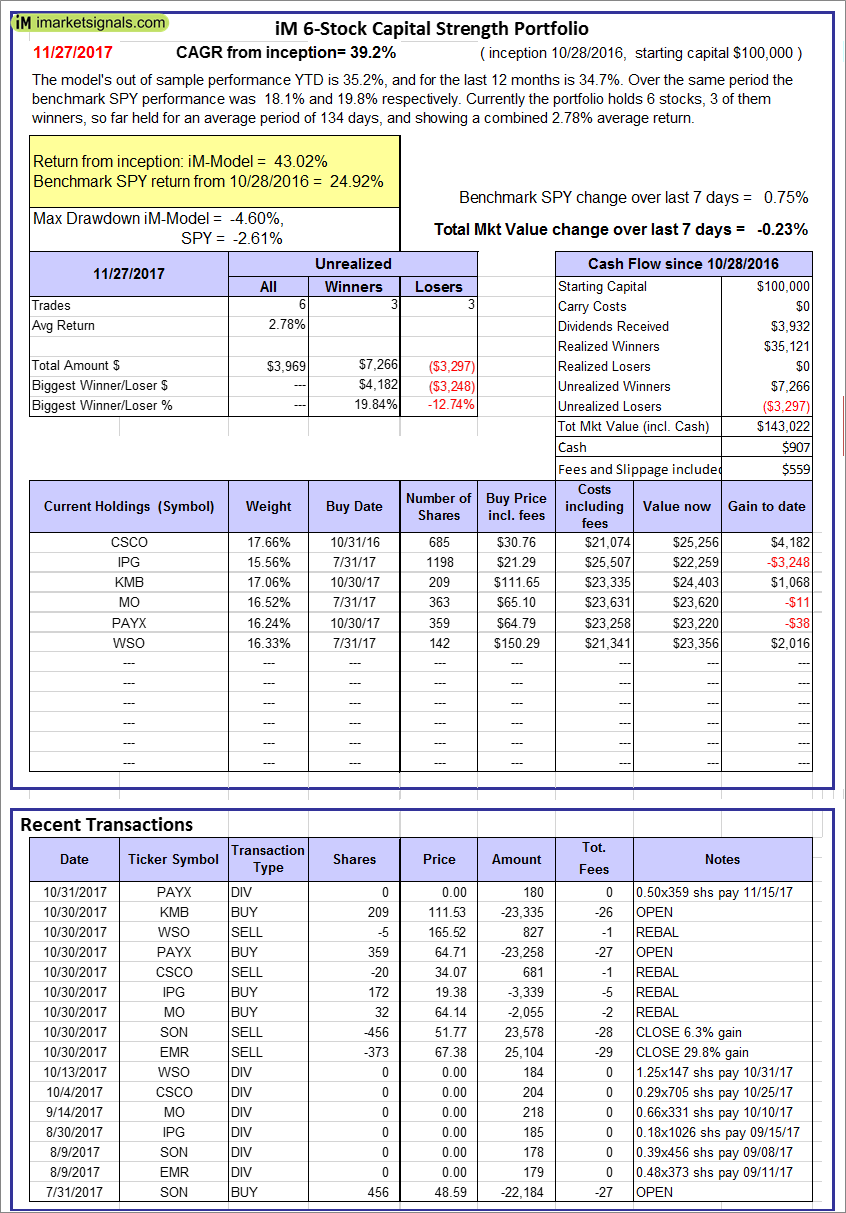 |
iM 6-Stock Capital Strength Portfolio: The model’s out of sample performance YTD is 35.2%, and for the last 12 months is 34.7%. Over the same period the benchmark SPY performance was 18.1% and 19.8% respectively. Over the previous week the market value of the iM 6-Stock Capital Strength Portfolio gained -0.23% at a time when SPY gained 0.75%. A starting capital of $100,000 at inception on 10/28/2016 would have grown to $143,022 which includes $907 cash and excludes $559 spent on fees and slippage. |
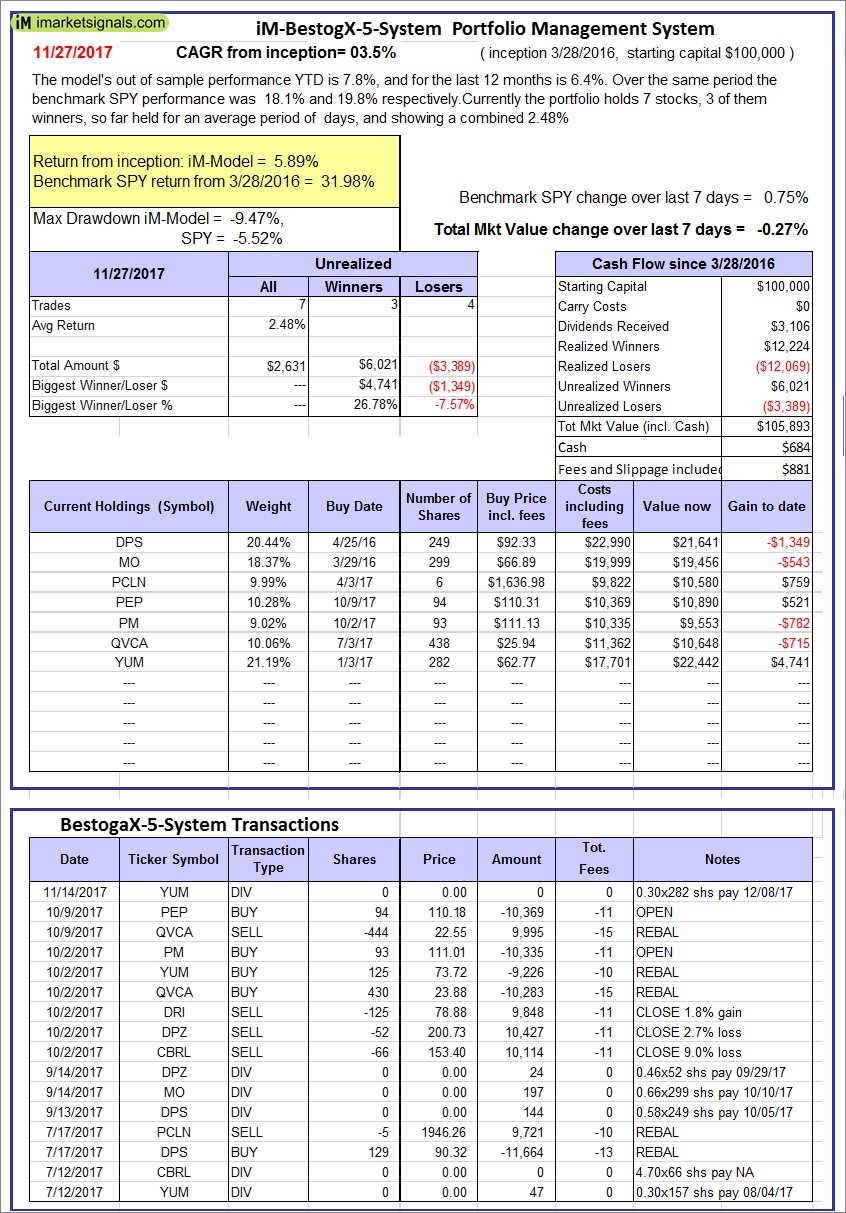 |
iM-BestogaX5-System: The model’s out of sample performance YTD is 7.8%, and for the last 12 months is 6.4%. Over the same period the benchmark SPY performance was 18.1% and 19.8% respectively. Over the previous week the market value of iM-Best8(S&P 500)Tax-Eff. gained -0.27% at a time when SPY gained 0.75%. A starting capital of $100,000 at inception on 3/28/2016 would have grown to $105,893 which includes $684 cash and excludes $881 spent on fees and slippage. |
 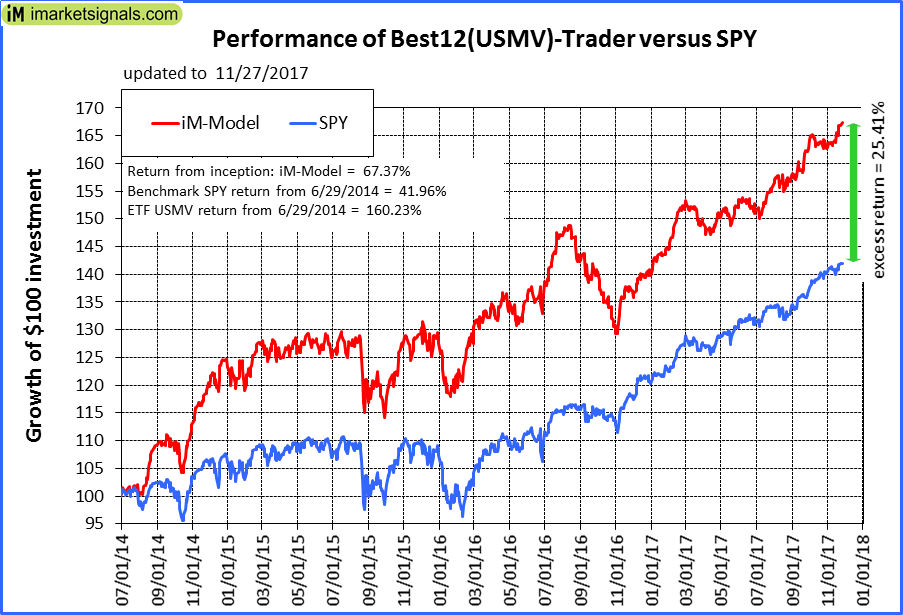 |
iM-Best12(USMV)-Trader: The model’s out of sample performance YTD is 19.7%, and for the last 12 months is 21.5%. Over the same period the benchmark SPY performance was 18.1% and 19.8% respectively. Since inception, on 6/30/2014, the model gained 67.37% while the benchmark SPY gained 41.96% and the ETF USMV gained 160.23% over the same period. Over the previous week the market value of iM-Best12(USMV)-Trader gained 1.37% at a time when SPY gained 0.75%. A starting capital of $100,000 at inception on 6/30/2014 would have grown to $167,367 which includes $385 cash and excludes $3,686 spent on fees and slippage. |
  |
iM-Best12(USMV)Q1-Investor: The model’s out of sample performance YTD is 25.4%, and for the last 12 months is 26.5%. Over the same period the benchmark SPY performance was 18.1% and 19.8% respectively. Since inception, on 1/5/2015, the model gained 57.77% while the benchmark SPY gained 36.42% and the ETF USMV gained 36.41% over the same period. Over the previous week the market value of iM-Best12(USMV)Q1 gained 0.29% at a time when SPY gained 0.75%. A starting capital of $100,000 at inception on 1/5/2015 would have grown to $157,696 which includes $35 cash and excludes $849 spent on fees and slippage. |
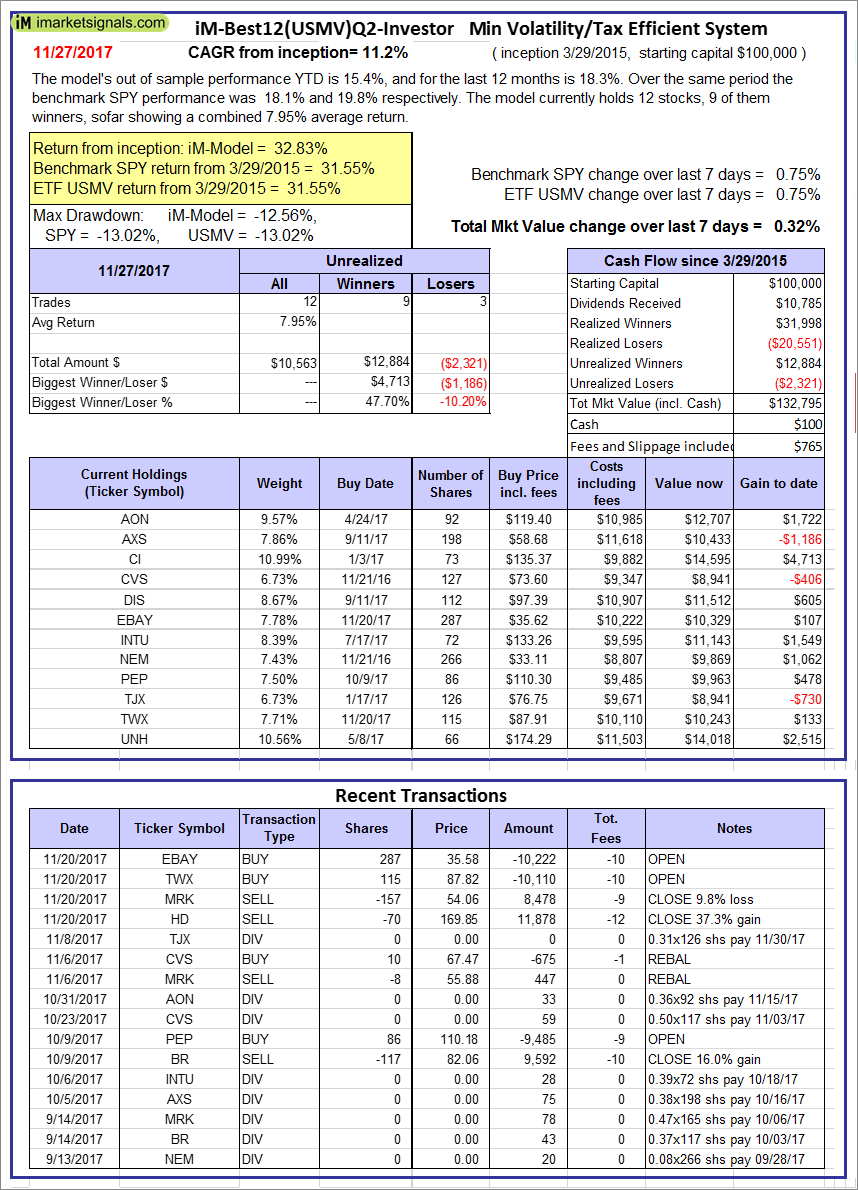  |
iM-Best12(USMV)Q2-Investor: The model’s out of sample performance YTD is 15.4%, and for the last 12 months is 18.3%. Over the same period the benchmark SPY performance was 18.1% and 19.8% respectively. Since inception, on 3/30/2015, the model gained 32.83% while the benchmark SPY gained 31.55% and the ETF USMV gained 31.55% over the same period. Over the previous week the market value of iM-Best12(USMV)Q2 gained 0.32% at a time when SPY gained 0.75%. A starting capital of $100,000 at inception on 3/30/2015 would have grown to $132,795 which includes $100 cash and excludes $765 spent on fees and slippage. |
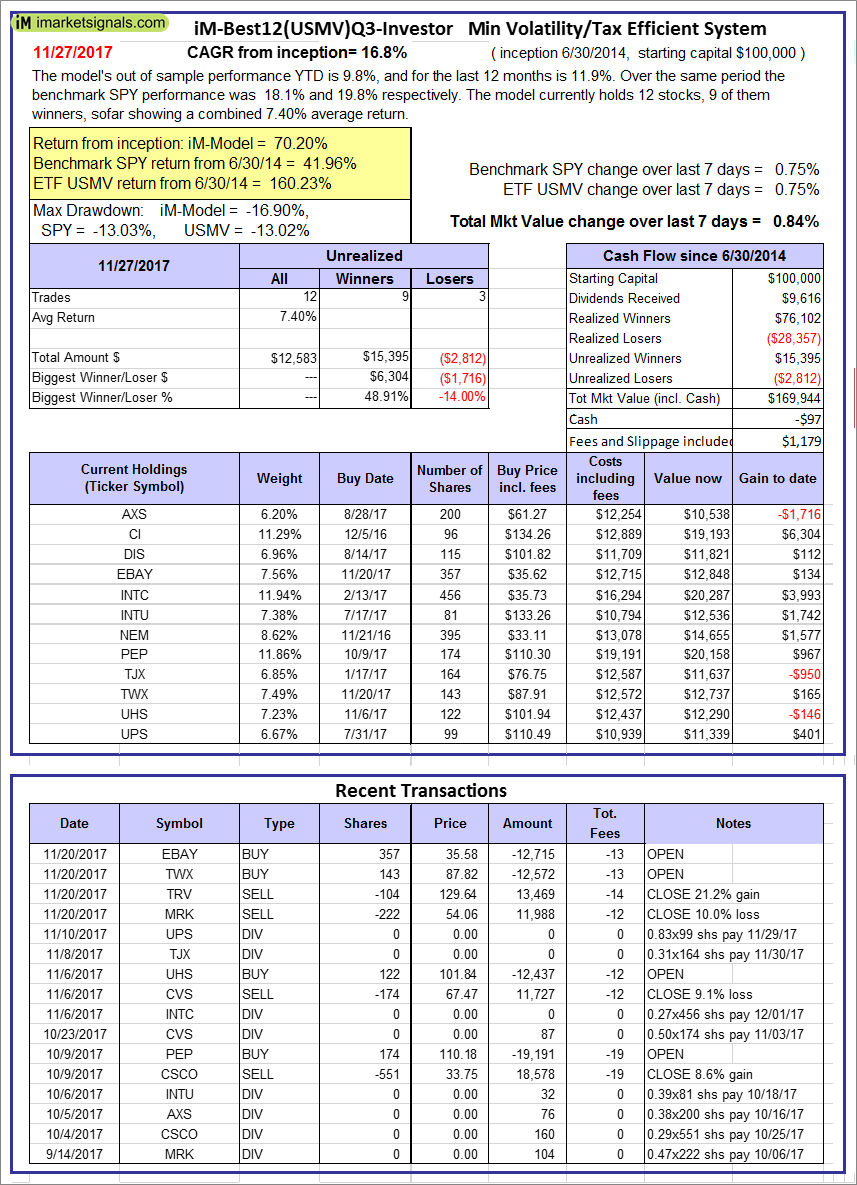 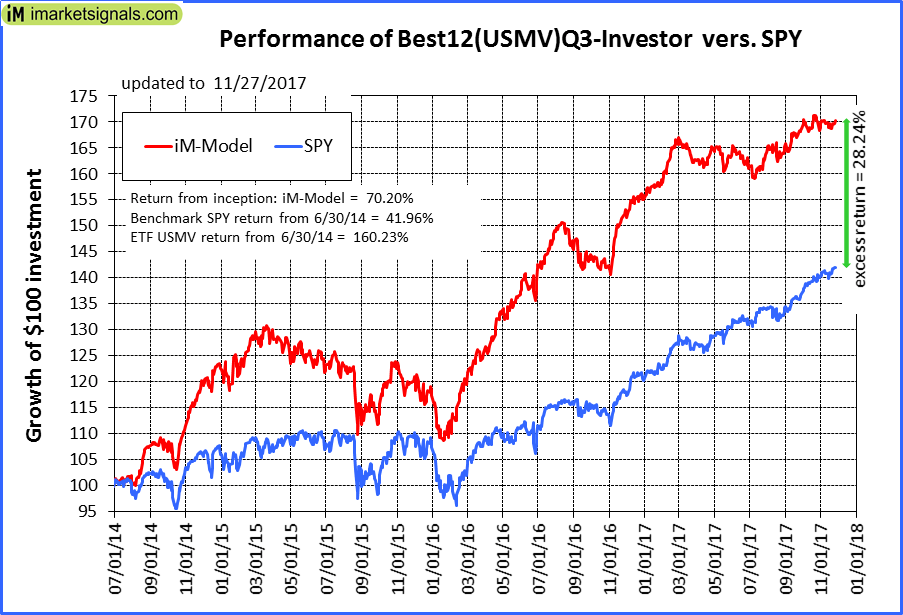 |
iM-Best12(USMV)Q3-Investor: The model’s out of sample performance YTD is 9.8%, and for the last 12 months is 11.9%. Over the same period the benchmark SPY performance was 18.1% and 19.8% respectively. Since inception, on 7/1/2014, the model gained 70.20% while the benchmark SPY gained 41.96% and the ETF USMV gained 160.23% over the same period. Over the previous week the market value of iM-Best12(USMV)Q3 gained 0.84% at a time when SPY gained 0.75%. A starting capital of $100,000 at inception on 7/1/2014 would have grown to $169,944 which includes -$97 cash and excludes $1,179 spent on fees and slippage. |
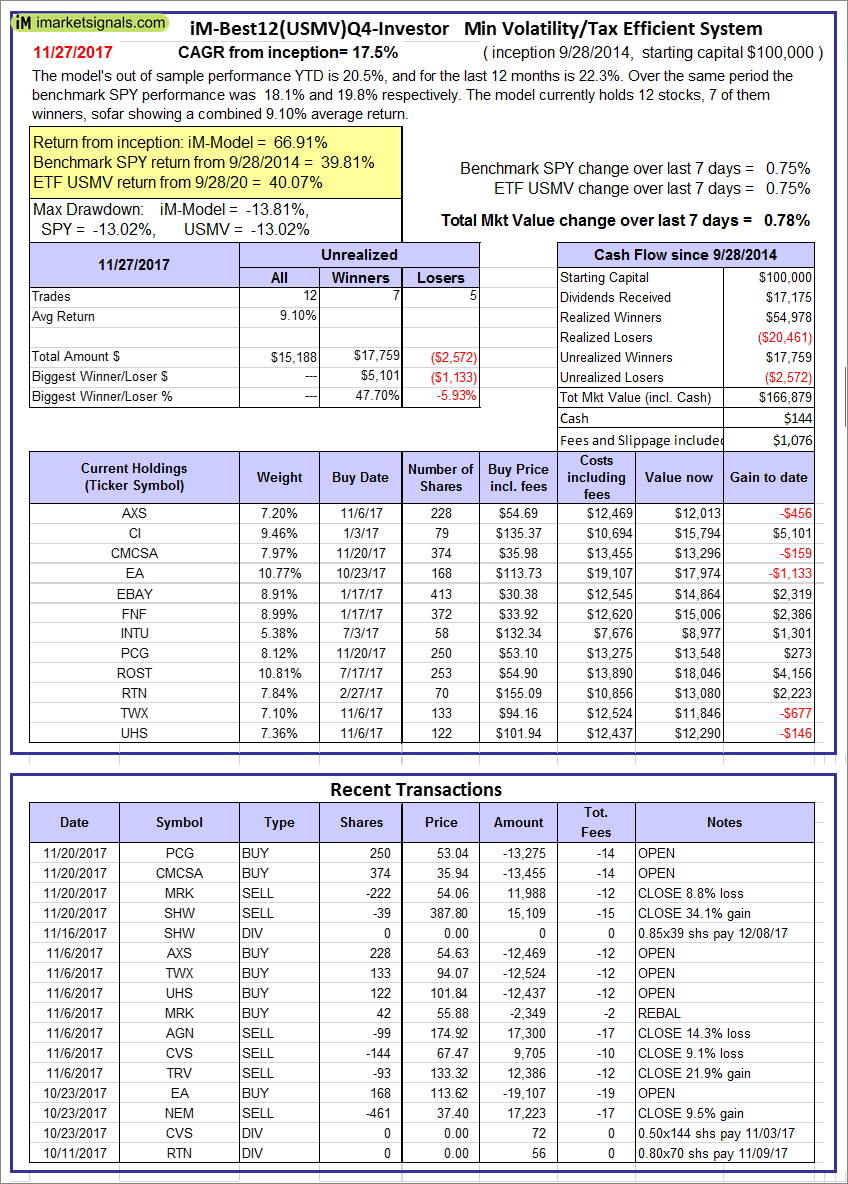 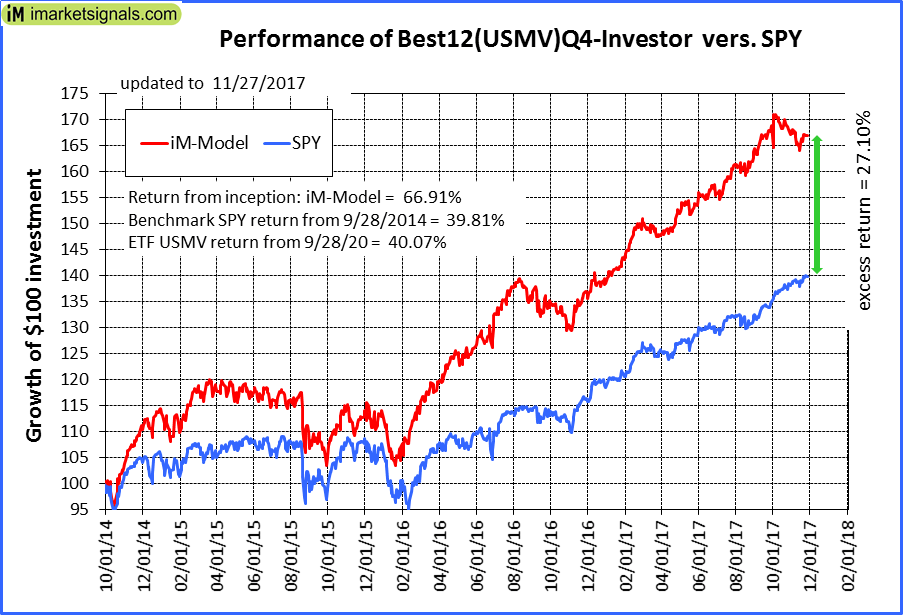 |
iM-Best12(USMV)Q4-Investor: Since inception, on 9/29/2014, the model gained 66.91% while the benchmark SPY gained 39.81% and the ETF USMV gained 40.07% over the same period. Over the previous week the market value of iM-Best12(USMV)Q4 gained 0.78% at a time when SPY gained 0.75%. A starting capital of $100,000 at inception on 9/29/2014 would have grown to $166,879 which includes $144 cash and excludes $1,076 spent on fees and slippage. |
 |
Average Performance of iM-Best12(USMV)Q1+Q2+Q3+Q4-Investor resulted in an excess return of 36.19% over SPY. (see iM-USMV Investor Portfolio) |
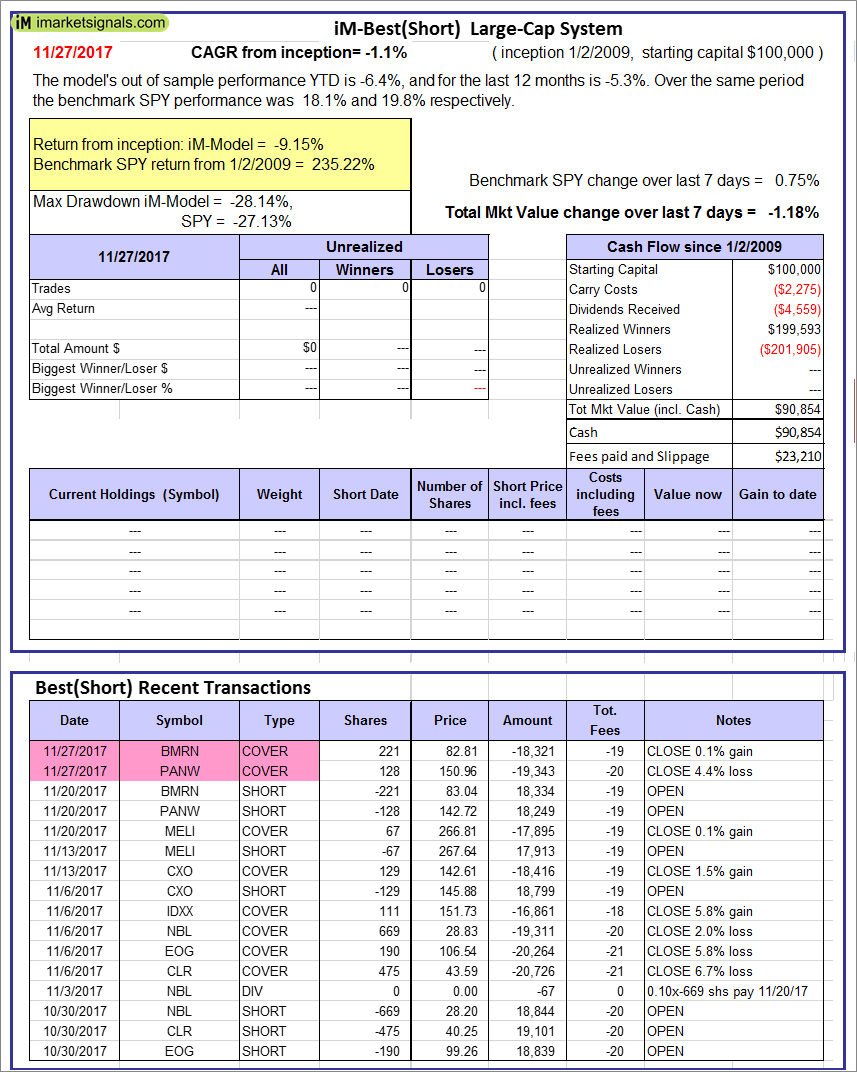 |
iM-Best(Short): The model’s out of sample performance YTD is -6.4%, and for the last 12 months is -5.3%. Over the same period the benchmark SPY performance was 18.1% and 19.8% respectively. Over the previous week the market value of iM-Best(Short) gained -1.18% at a time when SPY gained 0.75%. Over the period 1/2/2009 to 11/27/2017 the starting capital of $100,000 would have grown to $90,854 which includes $90,854 cash and excludes $23,210 spent on fees and slippage. |
 |
iM-Best2 MC-Score ETF System: The model’s out of sample performance YTD is 12.3%, and for the last 12 months is 14.2%. Over the same period the benchmark SPY performance was 18.1% and 19.8% respectively. Over the previous week the market value of the iM-Best2 MC-Score ETF System gained 0.46% at a time when SPY gained 0.75%. A starting capital of $100,000 at inception on 6/30/2016 would have grown to $108,872 which includes $70 cash and excludes $115 spent on fees and slippage. |
 |
iM-Best4 MC-Score Vanguard System: The model’s out of sample performance YTD is 10.5%, and for the last 12 months is 13.6%. Over the same period the benchmark SPY performance was 18.1% and 19.8% respectively. Over the previous week the market value of the iM-Best4 MC-Score Vanguard System gained 0.37% at a time when SPY gained 0.75%. A starting capital of $100,000 at inception on 6/30/2016 would have grown to $109,995 which includes $2,356 cash and excludes $00 spent on fees and slippage. |
 |
iM-Composite (SH-RSP) Timer: The model’s out of sample performance YTD is 14.2%, and for the last 12 months is 14.8%. Over the same period the benchmark SPY performance was 18.1% and 19.8% respectively. Over the previous week the market value of the iM-Composite (SH-RSP) Timer gained 0.27% at a time when SPY gained 0.75%. A starting capital of $100,000 at inception on 6/30/2016 would have grown to $125,423 which includes $1,593 cash and excludes $513 spent on fees and slippage. |
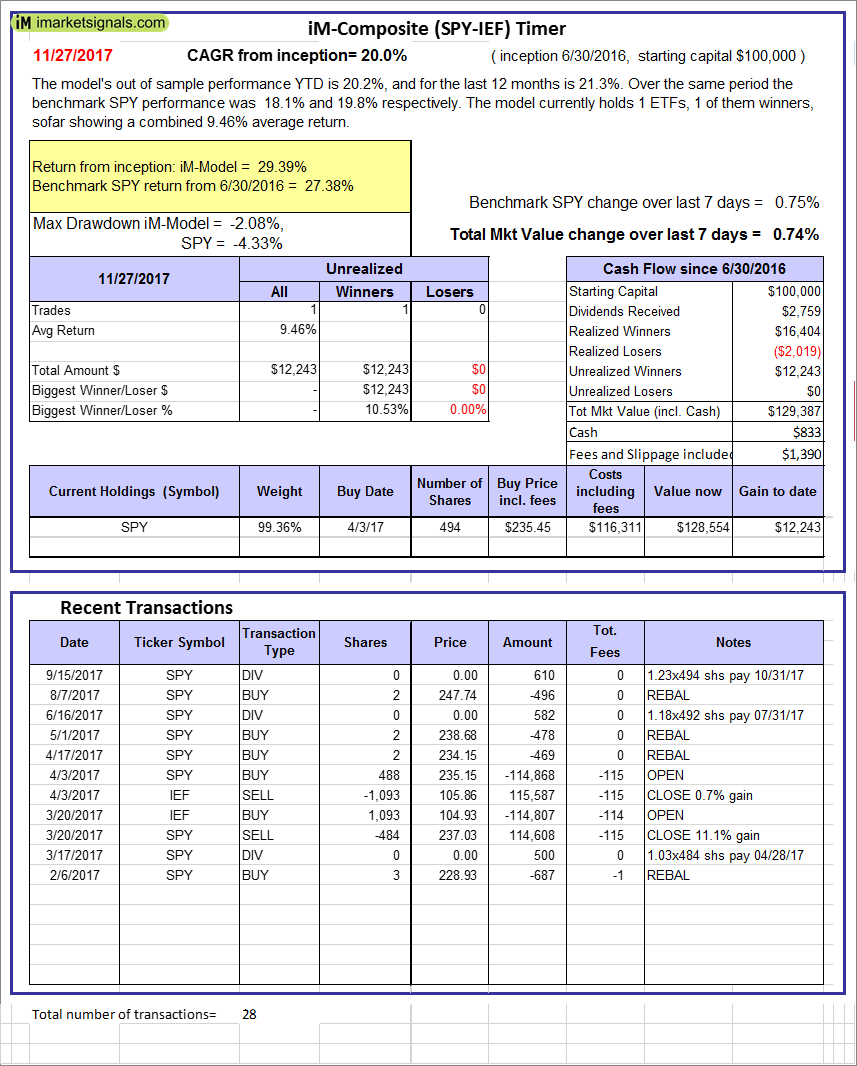 |
iM-Composite (SPY-IEF) Timer: The model’s out of sample performance YTD is 20.2%, and for the last 12 months is 21.3%. Over the same period the benchmark SPY performance was 18.1% and 19.8% respectively. Over the previous week the market value of the iM-Composite (SPY-IEF) Timer gained 0.74% at a time when SPY gained 0.75%. A starting capital of $100,000 at inception on 6/30/2016 would have grown to $129,387 which includes $833 cash and excludes $1,390 spent on fees and slippage. |
 |
iM-VIX Timer with ZIV: The model’s out of sample performance YTD is 59.6%, and since inception 59.6%. Over the same period the benchmark SPY performance was 18.1% and 18.1% respectively. Over the previous week the market value of the iM-VIX Timer with ZIV gained 1.35% at a time when SPY gained 0.75%. A starting capital of $100,000 at inception on 6/30/2016 would have grown to $159,640 which includes $587 cash and excludes $578 spent on fees and slippage. |
 |
iM-Composite(Gold-Stocks-Bond) Timer: The model’s out of sample performance YTD is 23.1%, and for the last 12 months is 20.5%. Over the same period the benchmark SPY performance was 18.1% and 19.8% respectively. Over the previous week the market value of the iM-Composite(Gold-Stocks-Bond) Timer gained 1.28% at a time when SPY gained 0.75%. A starting capital of $100,000 at inception on 6/30/2016 would have grown to $127,928 which includes $53 cash and excludes $1,955 spent on fees and slippage. |
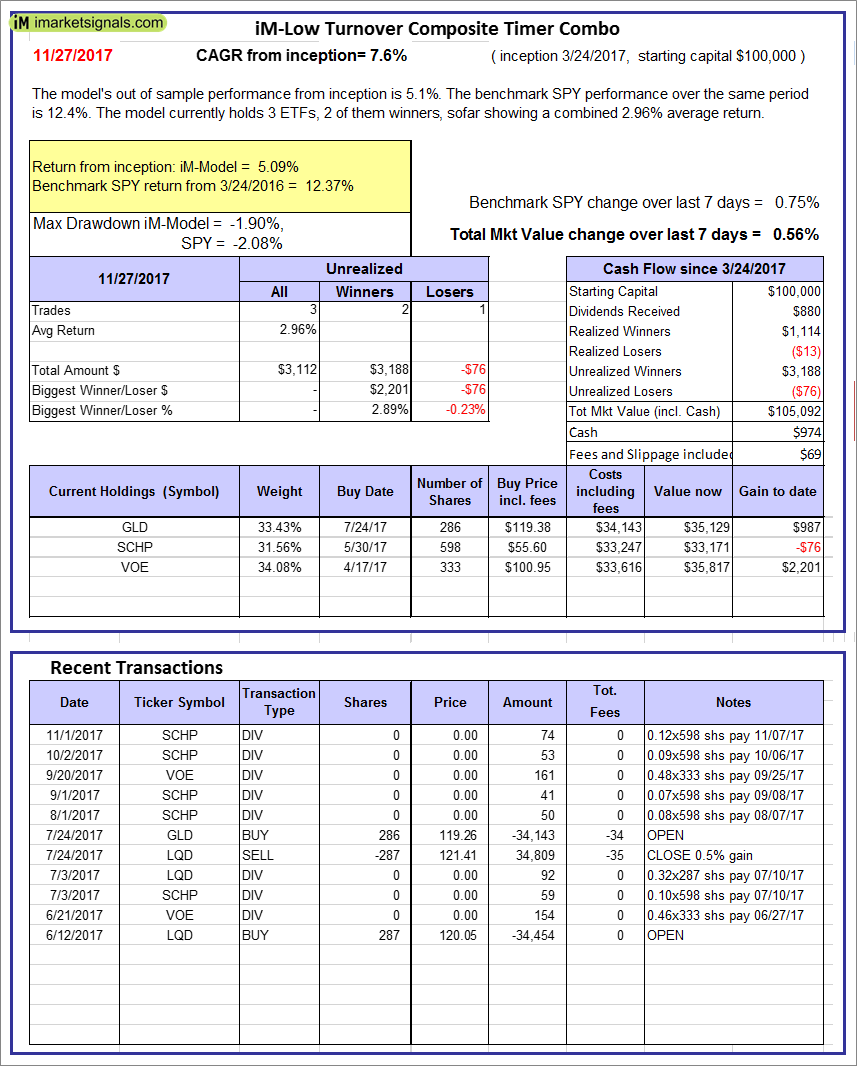 |
iM-Low Turnover Composite Timer Combo: The model’s out of sample performance from inception is 5.1%. The benchmark SPY performance over the same period is 12.4%. Over the previous week the market value of the iM-Low Turnover Composite Timer Combo gained 0.56% at a time when SPY gained 0.75%. A starting capital of $100,000 at inception on 3/24/27 would have grown to $105,092 which includes $974 cash and excludes $69 spent on fees and slippage. |
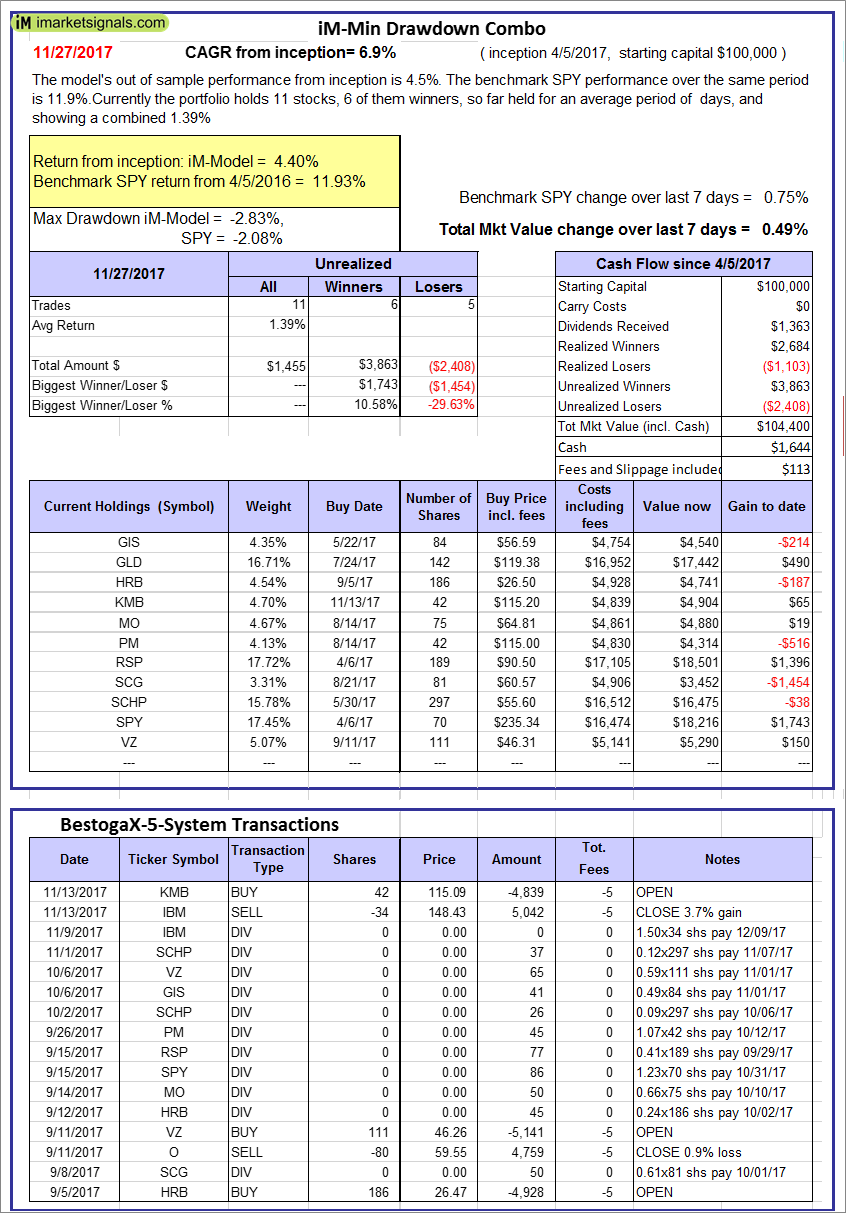 |
iM-Min Drawdown Combo: The model’s out of sample performance from inception is 4.5%. The benchmark SPY performance over the same period is 11.9%. Over the previous week the market value of the iM-Min Drawdown Combo gained 0.49% at a time when SPY gained 0.75%. A starting capital of $100,000 at inception on 4/5/2017 would have grown to $104,400 which includes $1,644 cash and excludes $113 spent on fees and slippage. |
 |
iM-5ETF Trader (includes leveraged ETFs): The model’s out of sample performance YTD is 38.0%, and for the last 12 months is 42.4%. Over the same period the benchmark SPY performance was 18.1% and 19.8% respectively. Over the previous week the market value of the iM-5ETF Trader (includes leveraged ETFs) gained 1.53% at a time when SPY gained 0.75%. A starting capital of $100,000 at inception on 10/30/2016 would have grown to $155,736 which includes $757 cash and excludes $1,030 spent on fees and slippage. |
 |
iM-Standard 5ETF Trader (excludes leveraged ETFs): The model’s out of sample performance YTD is 18.1%, and for the last 12 months is 19.2%. Over the same period the benchmark SPY performance was 18.1% and 19.8% respectively. Over the previous week the market value of the iM-Standard 5ETF Trader (excludes leveraged ETFs) gained 0.61% at a time when SPY gained 0.75%. A starting capital of $100,000 at inception on 10/30/2016 would have grown to $121,417 which includes $1,385 cash and excludes $880 spent on fees and slippage. |
Posted in pmp SPY-SH
iM-Best Reports – 11/20/2017
  |
Out of sample performance summary of our models for the past 1, 2, 4 and 13 week periods. The active active return indicates how the models over- or underperformed the benchmark ETF SPY. Also the YTD, and the 1-, 3-, 5- and 10-year annualized returns are shown in the second table |
 |
iM-Best(SPY-SH).R1: The model’s out of sample performance YTD is 17.8%, and for the last 12 months is 20.5%. Over the same period the benchmark SPY performance was 17.2% and 20.6% respectively. Over the previous week the market value of Best(SPY-SH) gained -0.01% at a time when SPY gained -0.01%. A starting capital of $100,000 at inception on 1/2/2009 would have grown to $544,486 which includes $7,222 cash and excludes $15,358 spent on fees and slippage. |
 |
iM-Combo3.R1: The model’s out of sample performance YTD is 20.8%, and for the last 12 months is 25.0%. Over the same period the benchmark SPY performance was 17.2% and 20.6% respectively. Over the previous week the market value of iM-Combo3.R1 gained 0.02% at a time when SPY gained -0.01%. A starting capital of $100,000 at inception on 2/3/2014 would have grown to $151,757 which includes -$544 cash and excludes $3,437 spent on fees and slippage. |
 |
iM-Combo5: The model’s out of sample performance YTD is 25.1%, and for the last 12 months is 27.6%. Over the same period the benchmark SPY performance was 17.2% and 20.6% respectively. Over the previous week the market value of iM-Combo5 gained -0.01% at a time when SPY gained -0.01%. A starting capital of $100,000 at inception on 2/22/2016 would have grown to $123,395 which includes $409 cash and excludes $603 spent on fees and slippage. |
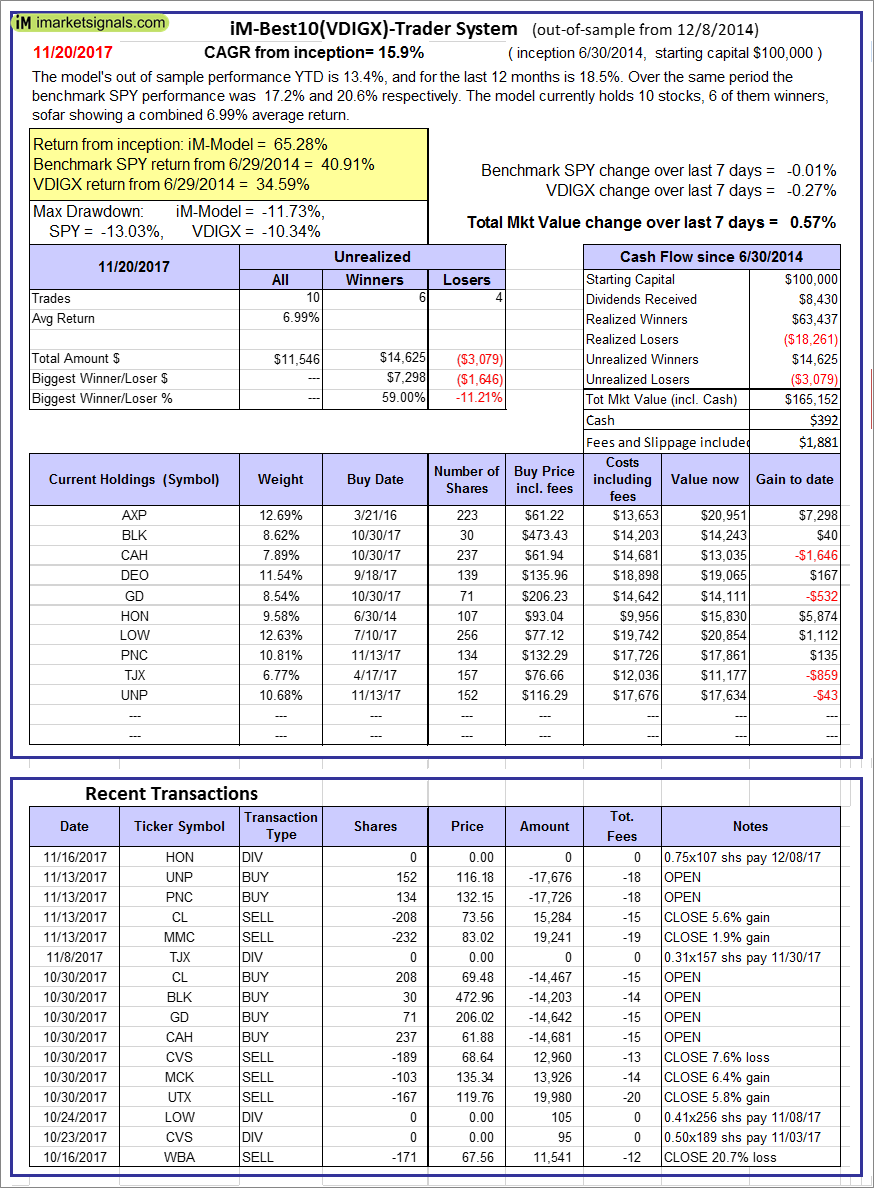  |
iM-Best10(VDIGX)-Trader: The model’s out of sample performance YTD is 13.4%, and for the last 12 months is 18.5%. Over the same period the benchmark SPY performance was 17.2% and 20.6% respectively. Since inception, on 7/1/2014, the model gained 65.28% while the benchmark SPY gained 40.91% and VDIGX gained 34.59% over the same period. Over the previous week the market value of iM-Best10(VDIGX) gained 0.57% at a time when SPY gained -0.01%. A starting capital of $100,000 at inception on 7/1/2014 would have grown to $165,152 which includes $392 cash and excludes $1,881 spent on fees and slippage. |
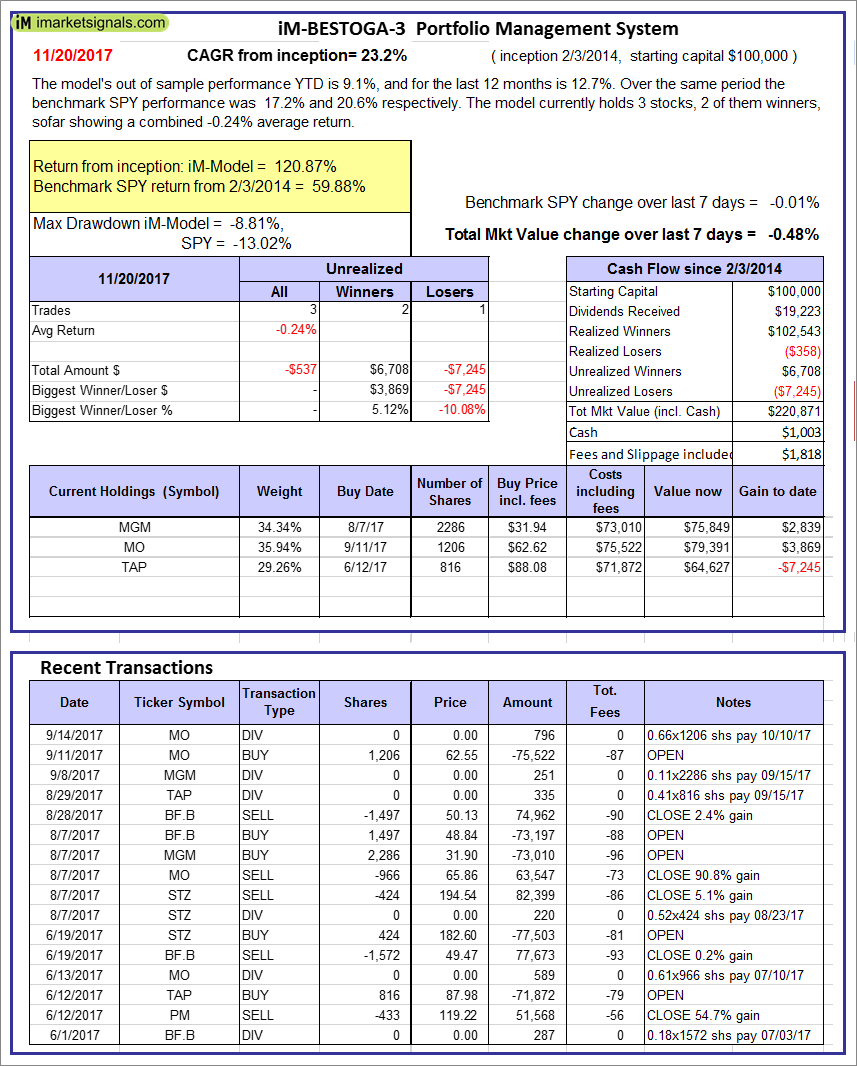 |
iM-BESTOGA-3: The model’s out of sample performance YTD is 9.1%, and for the last 12 months is 12.7%. Over the same period the benchmark SPY performance was 17.2% and 20.6% respectively. Over the previous week the market value of iM-BESTOGA-3 gained -0.48% at a time when SPY gained -0.01%. A starting capital of $100,000 at inception on 2/3/2014 would have grown to $220,871 which includes $1,003 cash and excludes $1,818 spent on fees and slippage. |
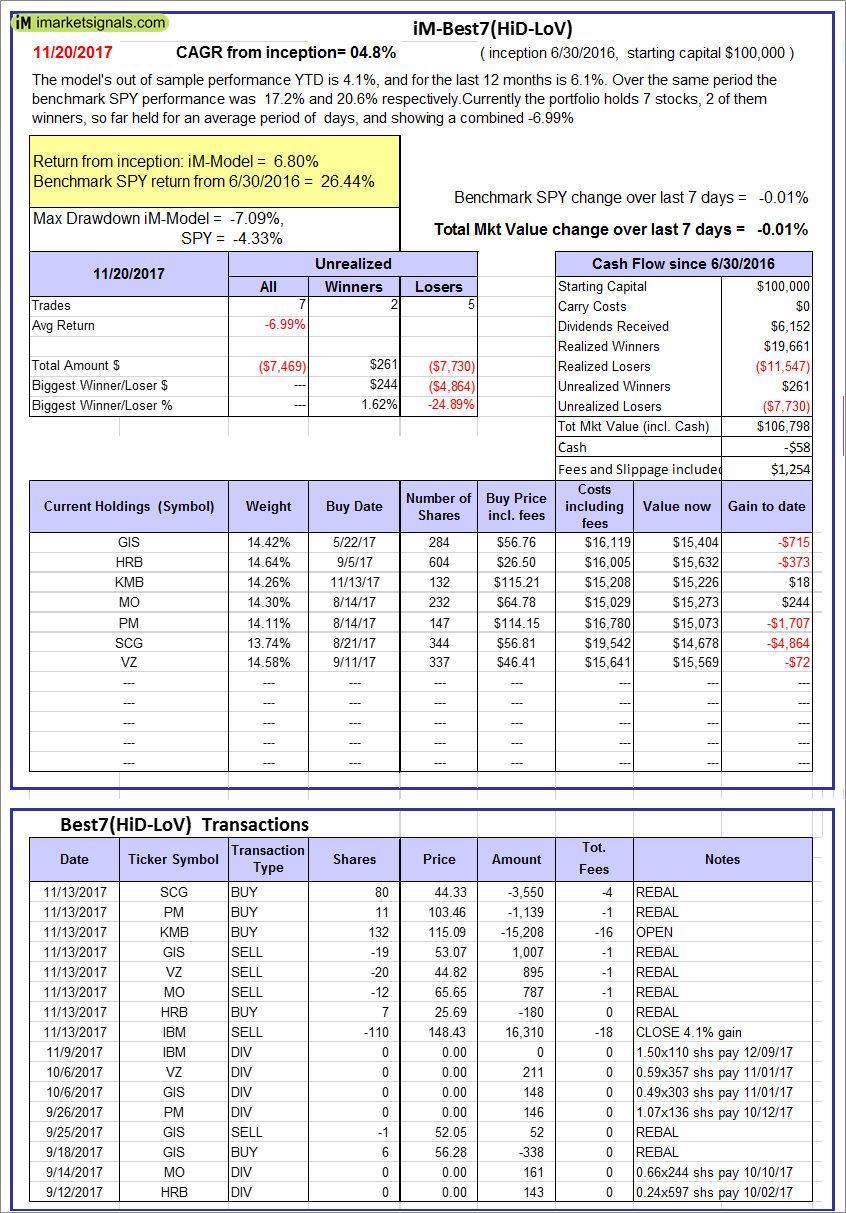 |
iM-Best7(HiD-LoV): The model’s out of sample performance YTD is 4.1%, and for the last 12 months is 6.1%. Over the same period the benchmark SPY performance was 17.2% and 20.6% respectively. Over the previous week the market value of iM-BESTOGA-3 gained -0.01% at a time when SPY gained -0.01%. A starting capital of $100,000 at inception on 6/30/2016 would have grown to $106,798 which includes -$58 cash and excludes $1,254 spent on fees and slippage. |
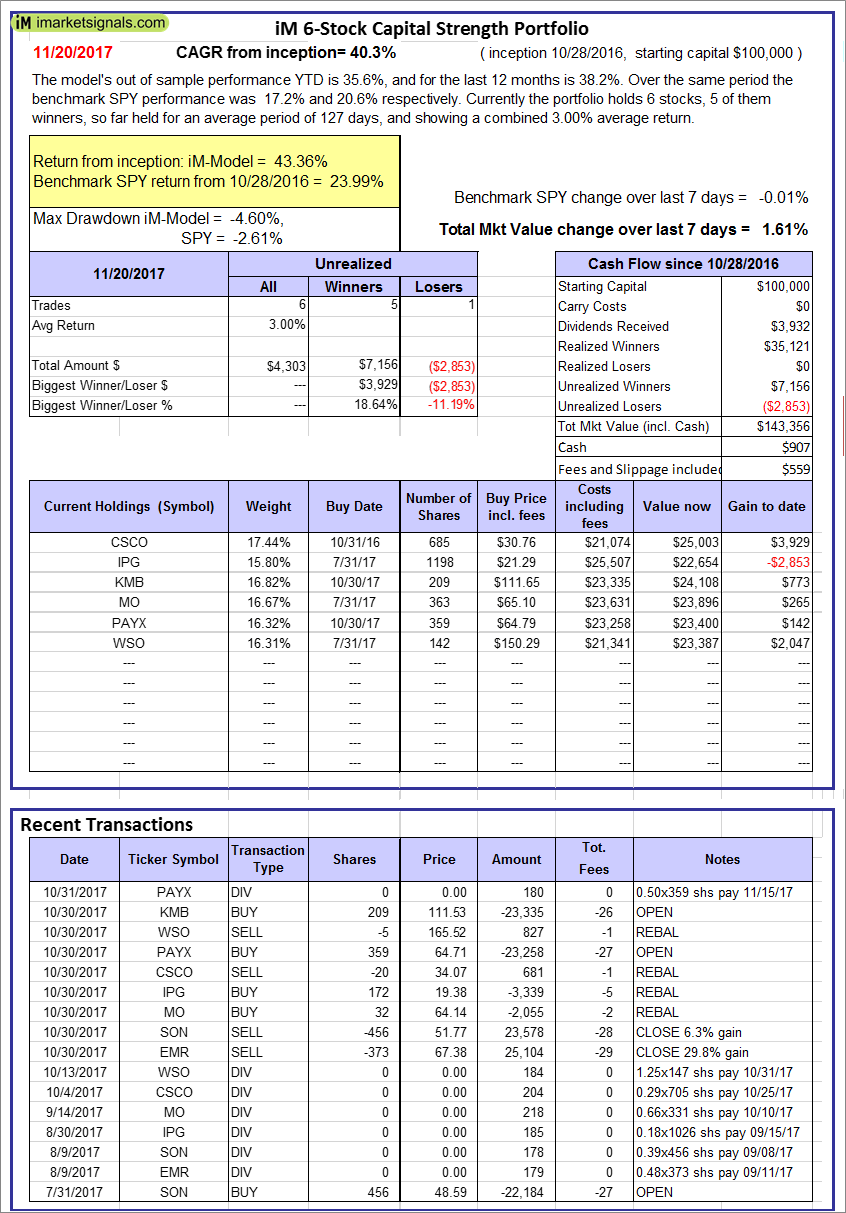 |
iM 6-Stock Capital Strength Portfolio: The model’s out of sample performance YTD is 35.6%, and for the last 12 months is 38.2%. Over the same period the benchmark SPY performance was 17.2% and 20.6% respectively. Over the previous week the market value of the iM 6-Stock Capital Strength Portfolio gained 1.61% at a time when SPY gained -0.01%. A starting capital of $100,000 at inception on 10/28/2016 would have grown to $143,356 which includes $907 cash and excludes $559 spent on fees and slippage. |
 |
iM-BestogaX5-System: The model’s out of sample performance YTD is 8.1%, and for the last 12 months is 9.6%. Over the same period the benchmark SPY performance was 17.2% and 20.6% respectively. Over the previous week the market value of iM-Best8(S&P 500)Tax-Eff. gained 0.67% at a time when SPY gained -0.01%. A starting capital of $100,000 at inception on 3/28/2016 would have grown to $106,179 which includes $684 cash and excludes $881 spent on fees and slippage. |
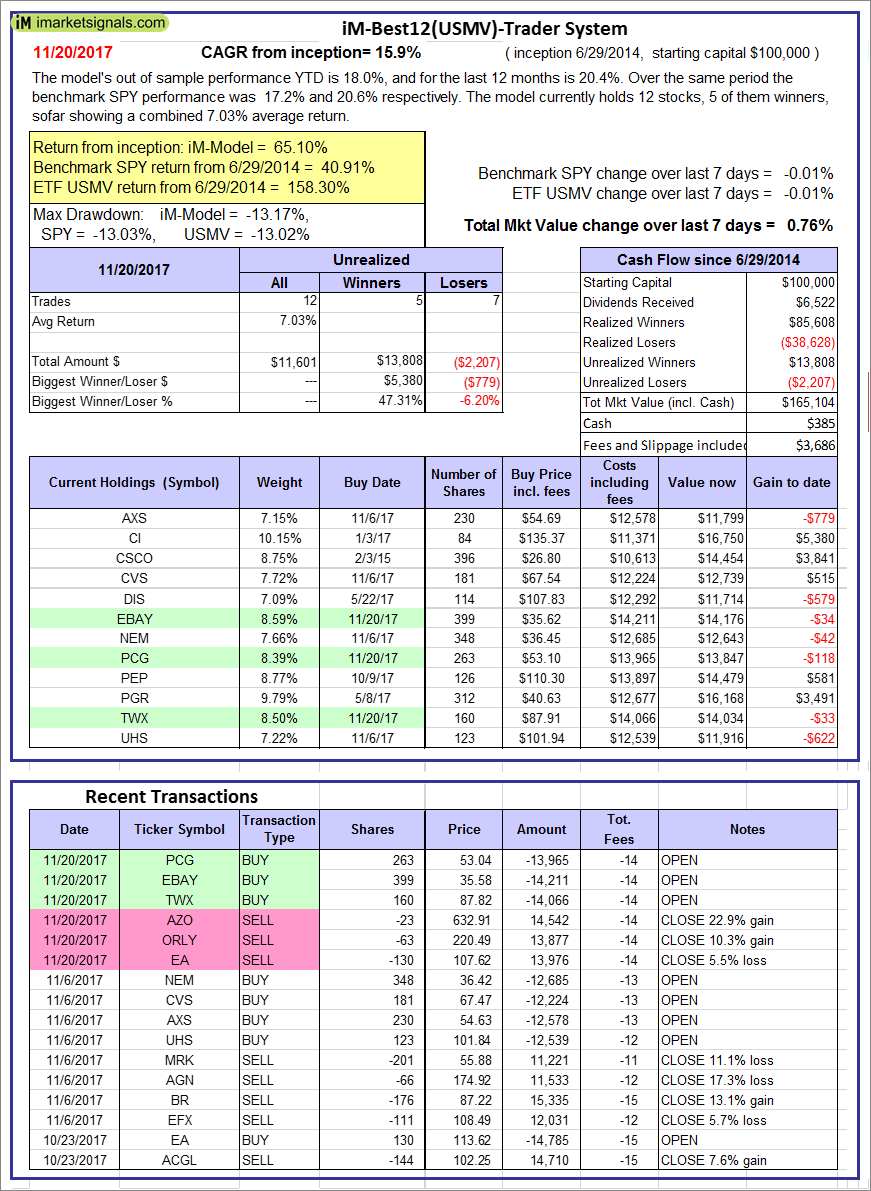  |
iM-Best12(USMV)-Trader: The model’s out of sample performance YTD is 18.0%, and for the last 12 months is 20.4%. Over the same period the benchmark SPY performance was 17.2% and 20.6% respectively. Since inception, on 6/30/2014, the model gained 65.10% while the benchmark SPY gained 40.91% and the ETF USMV gained 158.30% over the same period. Over the previous week the market value of iM-Best12(USMV)-Trader gained 0.76% at a time when SPY gained -0.01%. A starting capital of $100,000 at inception on 6/30/2014 would have grown to $165,104 which includes $385 cash and excludes $3,686 spent on fees and slippage. |
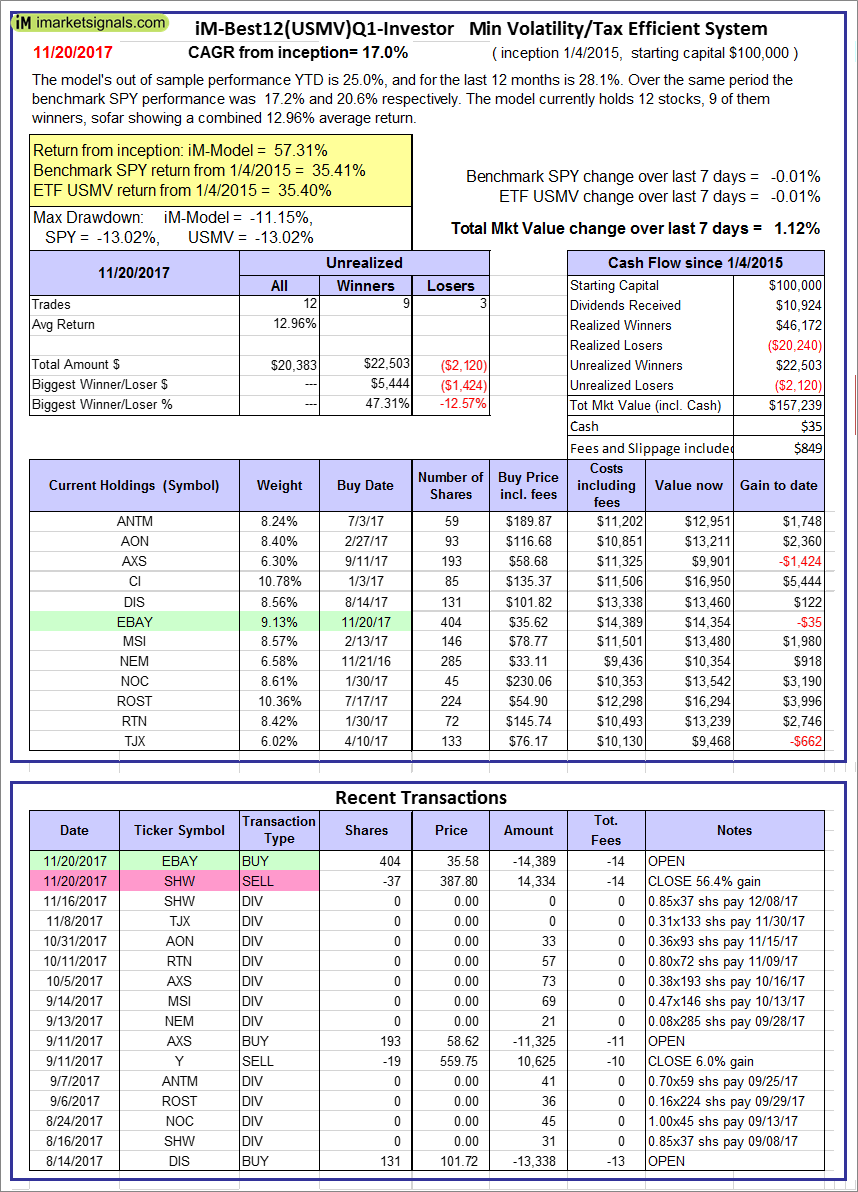 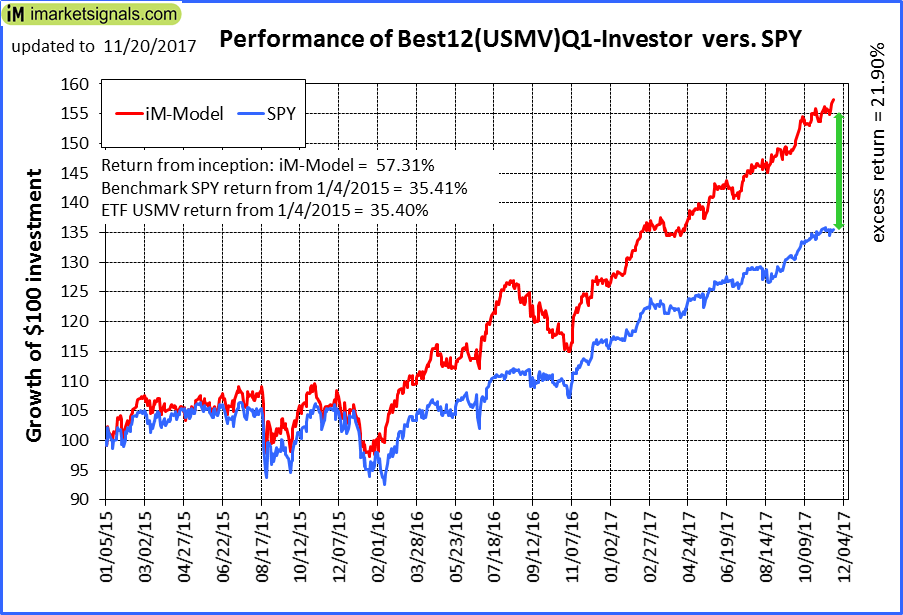 |
iM-Best12(USMV)Q1-Investor: The model’s out of sample performance YTD is 25.0%, and for the last 12 months is 28.1%. Over the same period the benchmark SPY performance was 17.2% and 20.6% respectively. Since inception, on 1/5/2015, the model gained 57.31% while the benchmark SPY gained 35.41% and the ETF USMV gained 35.40% over the same period. Over the previous week the market value of iM-Best12(USMV)Q1 gained 1.12% at a time when SPY gained -0.01%. A starting capital of $100,000 at inception on 1/5/2015 would have grown to $157,239 which includes $35 cash and excludes $849 spent on fees and slippage. |
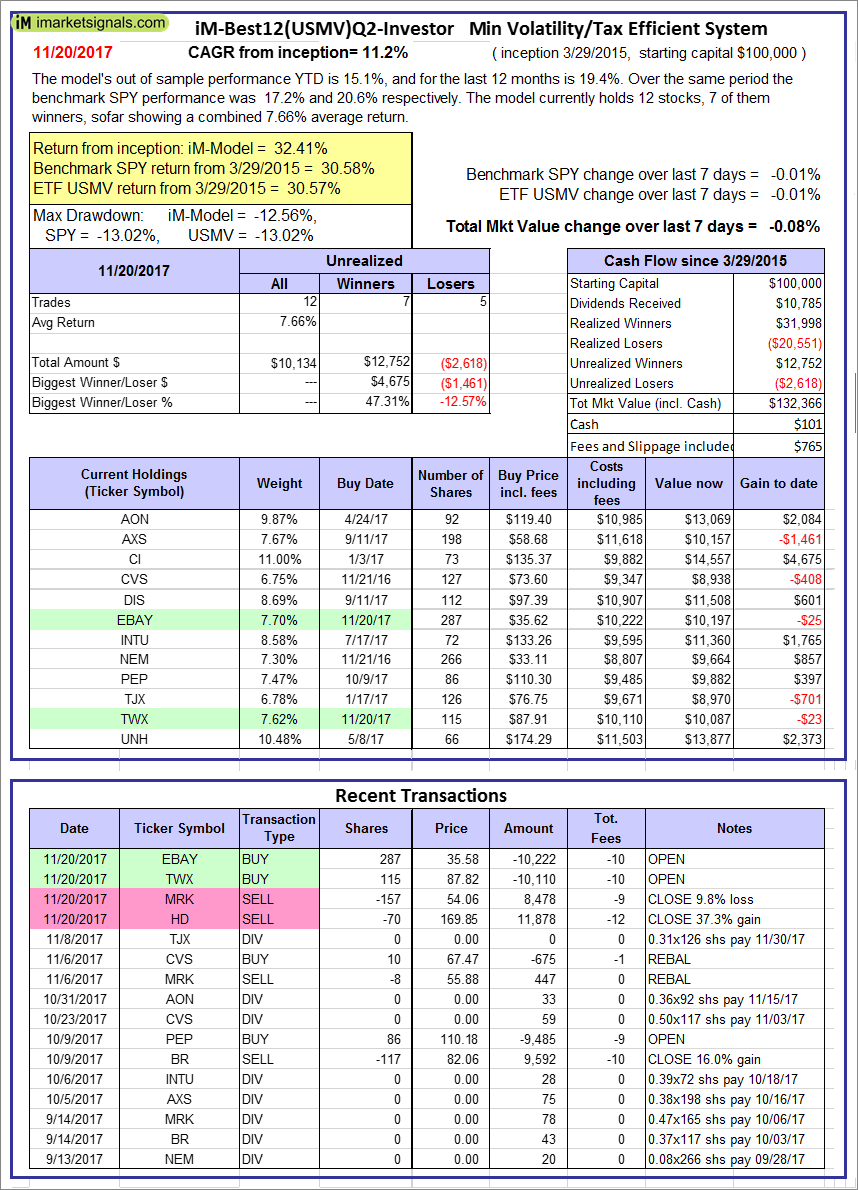 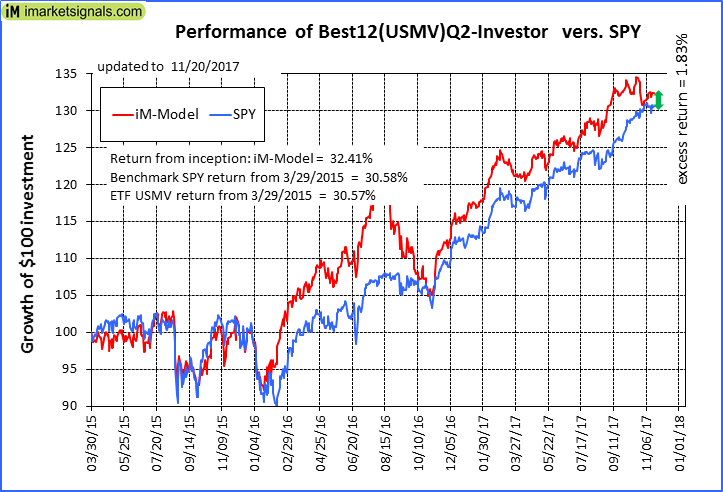 |
iM-Best12(USMV)Q2-Investor: The model’s out of sample performance YTD is 15.1%, and for the last 12 months is 19.4%. Over the same period the benchmark SPY performance was 17.2% and 20.6% respectively. Since inception, on 3/30/2015, the model gained 32.41% while the benchmark SPY gained 30.58% and the ETF USMV gained 30.57% over the same period. Over the previous week the market value of iM-Best12(USMV)Q2 gained -0.08% at a time when SPY gained -0.01%. A starting capital of $100,000 at inception on 3/30/2015 would have grown to $132,366 which includes $101 cash and excludes $765 spent on fees and slippage. |
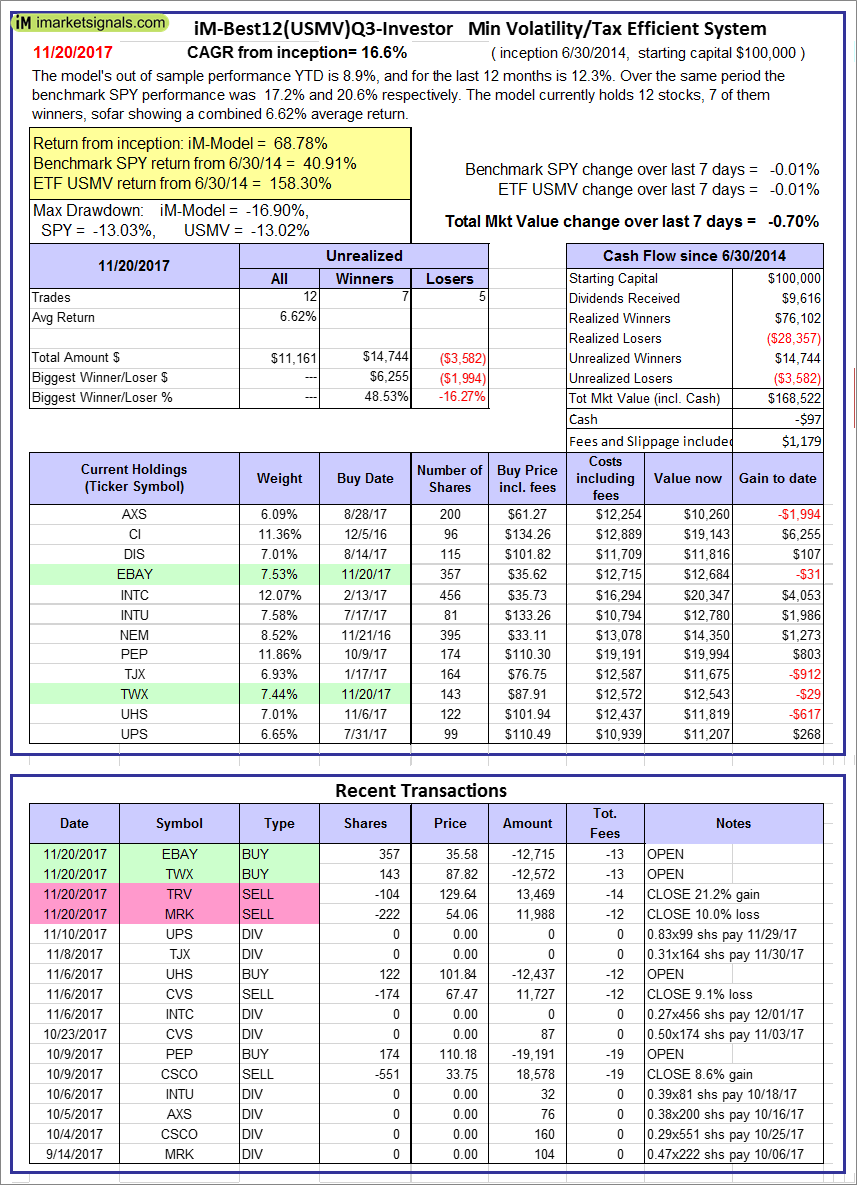 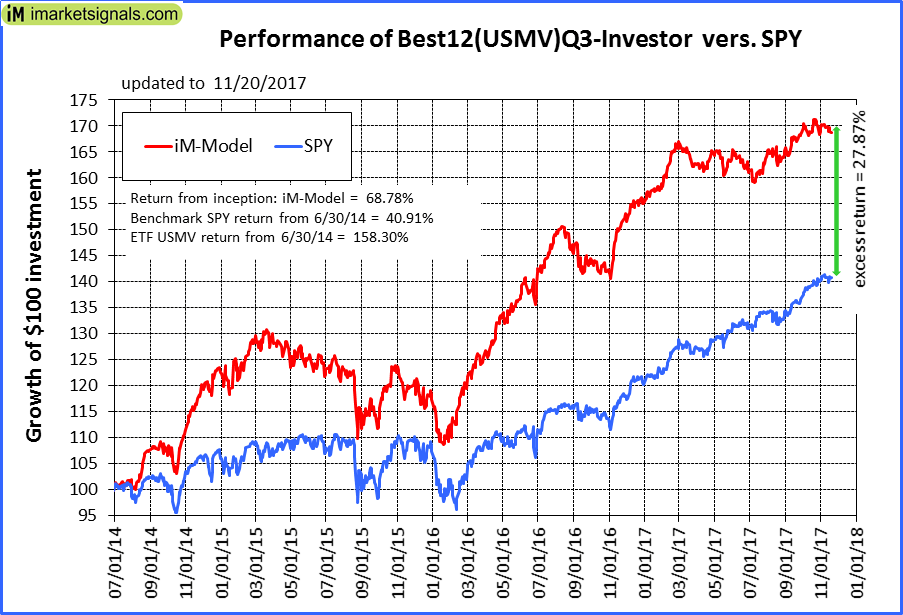 |
iM-Best12(USMV)Q3-Investor: The model’s out of sample performance YTD is 8.9%, and for the last 12 months is 12.3%. Over the same period the benchmark SPY performance was 17.2% and 20.6% respectively. Since inception, on 7/1/2014, the model gained 68.78% while the benchmark SPY gained 40.91% and the ETF USMV gained 158.30% over the same period. Over the previous week the market value of iM-Best12(USMV)Q3 gained -0.70% at a time when SPY gained -0.01%. A starting capital of $100,000 at inception on 7/1/2014 would have grown to $168,522 which includes -$97 cash and excludes $1,179 spent on fees and slippage. |
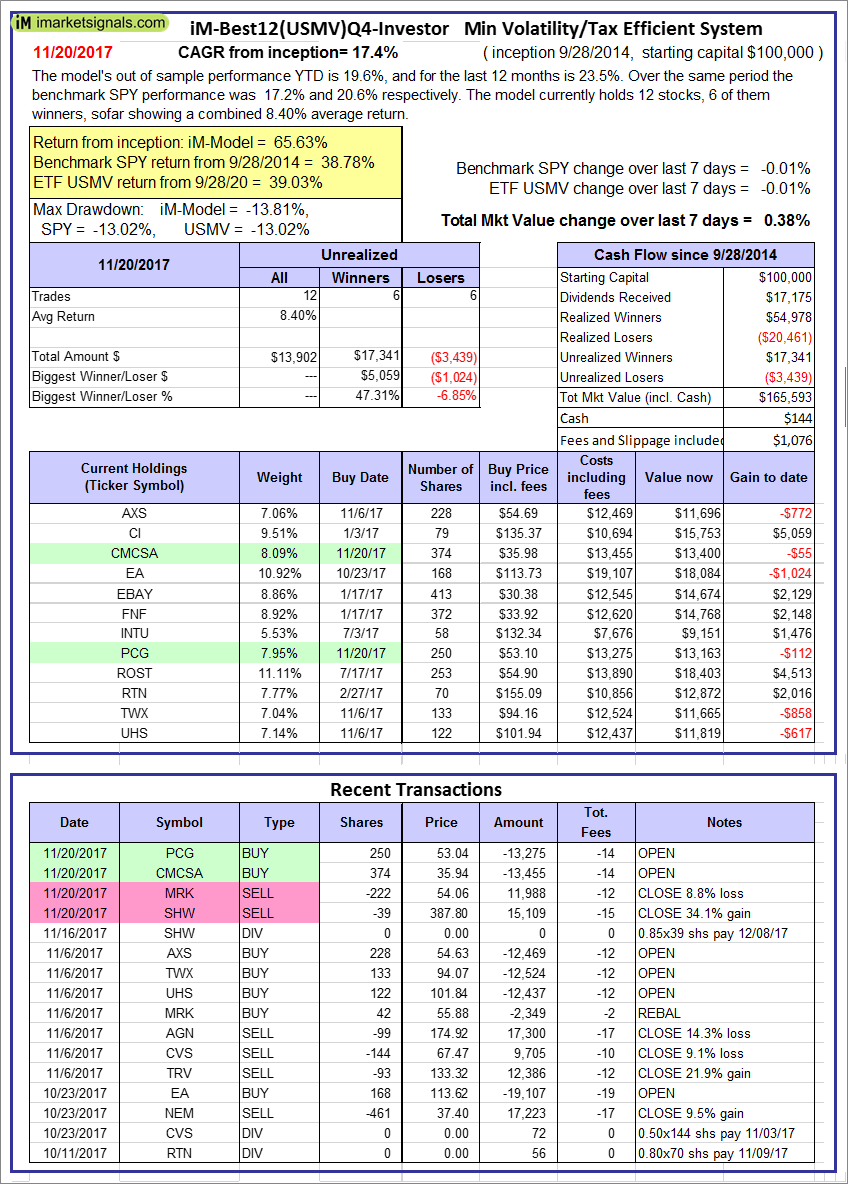  |
iM-Best12(USMV)Q4-Investor: Since inception, on 9/29/2014, the model gained 65.63% while the benchmark SPY gained 38.78% and the ETF USMV gained 39.03% over the same period. Over the previous week the market value of iM-Best12(USMV)Q4 gained 0.38% at a time when SPY gained -0.01%. A starting capital of $100,000 at inception on 9/29/2014 would have grown to $165,593 which includes $144 cash and excludes $1,076 spent on fees and slippage. |
 |
Average Performance of iM-Best12(USMV)Q1+Q2+Q3+Q4-Investor resulted in an excess return of 37.27% over SPY. (see iM-USMV Investor Portfolio) |
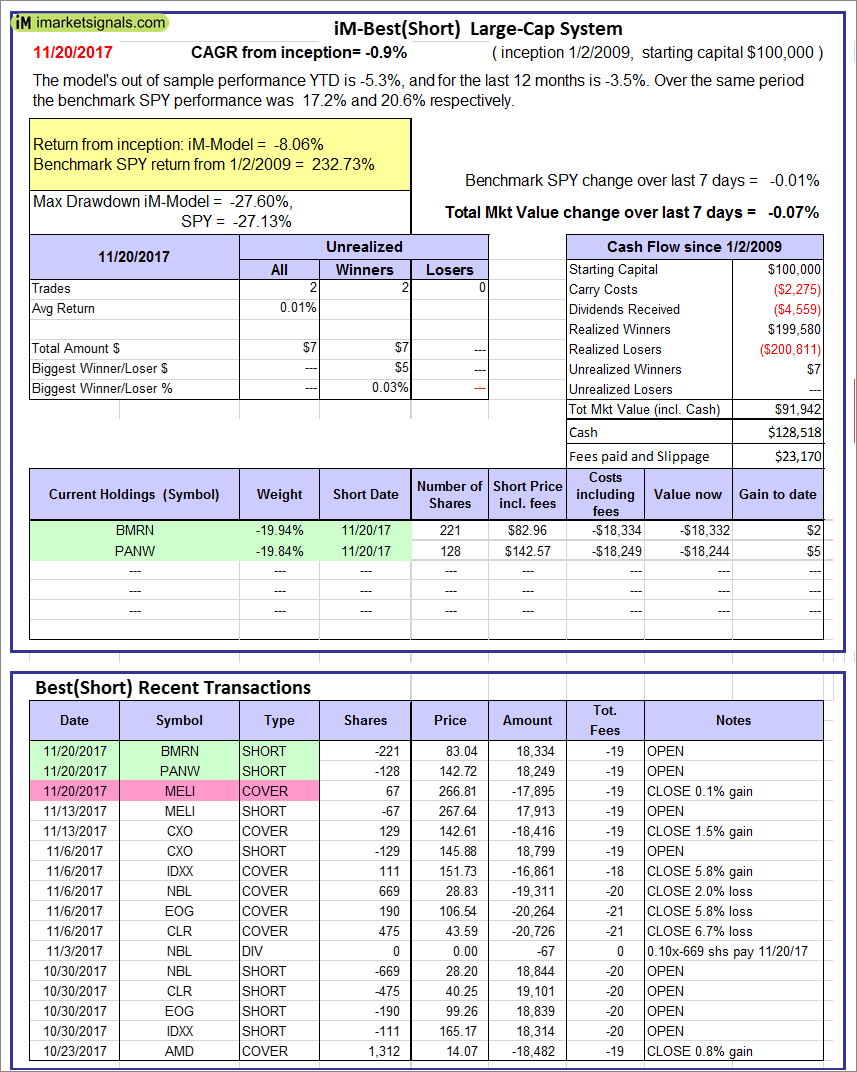 |
iM-Best(Short): The model’s out of sample performance YTD is -5.3%, and for the last 12 months is -3.5%. Over the same period the benchmark SPY performance was 17.2% and 20.6% respectively. Over the previous week the market value of iM-Best(Short) gained -0.07% at a time when SPY gained -0.01%. Over the period 1/2/2009 to 11/20/2017 the starting capital of $100,000 would have grown to $91,942 which includes $128,518 cash and excludes $23,170 spent on fees and slippage. |
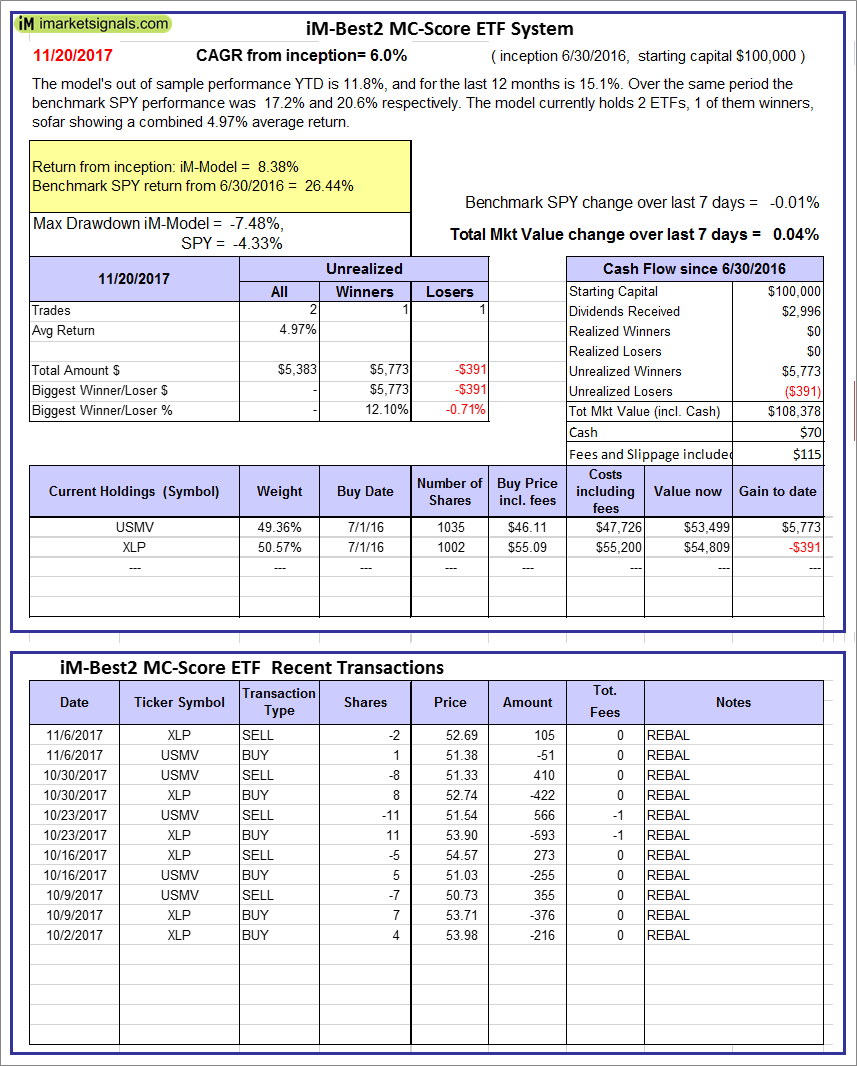 |
iM-Best2 MC-Score ETF System: The model’s out of sample performance YTD is 11.8%, and for the last 12 months is 15.1%. Over the same period the benchmark SPY performance was 17.2% and 20.6% respectively. Over the previous week the market value of the iM-Best2 MC-Score ETF System gained 0.04% at a time when SPY gained -0.01%. A starting capital of $100,000 at inception on 6/30/2016 would have grown to $108,378 which includes $70 cash and excludes $115 spent on fees and slippage. |
 |
iM-Best4 MC-Score Vanguard System: The model’s out of sample performance YTD is 10.1%, and for the last 12 months is 15.1%. Over the same period the benchmark SPY performance was 17.2% and 20.6% respectively. Over the previous week the market value of the iM-Best4 MC-Score Vanguard System gained -0.12% at a time when SPY gained -0.01%. A starting capital of $100,000 at inception on 6/30/2016 would have grown to $109,594 which includes $2,356 cash and excludes $00 spent on fees and slippage. |
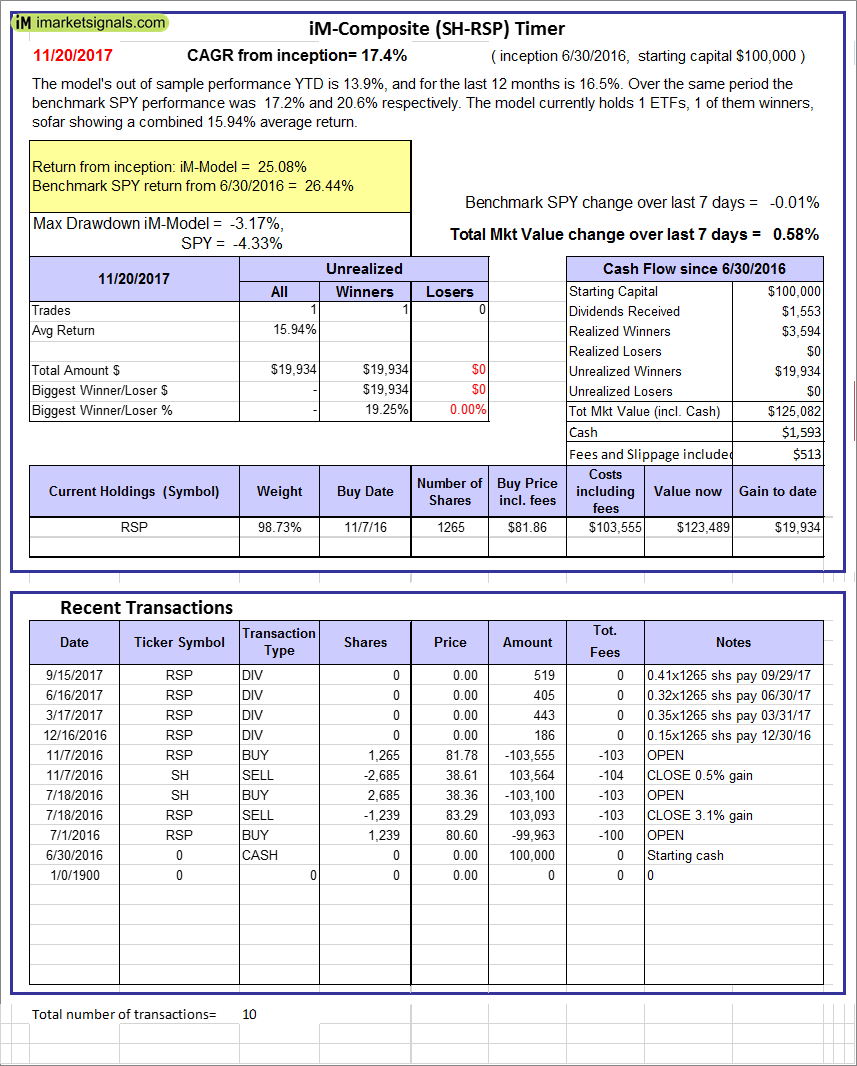 |
iM-Composite (SH-RSP) Timer: The model’s out of sample performance YTD is 13.9%, and for the last 12 months is 16.5%. Over the same period the benchmark SPY performance was 17.2% and 20.6% respectively. Over the previous week the market value of the iM-Composite (SH-RSP) Timer gained 0.58% at a time when SPY gained -0.01%. A starting capital of $100,000 at inception on 6/30/2016 would have grown to $125,082 which includes $1,593 cash and excludes $513 spent on fees and slippage. |
 |
iM-Composite (SPY-IEF) Timer: The model’s out of sample performance YTD is 19.3%, and for the last 12 months is 22.1%. Over the same period the benchmark SPY performance was 17.2% and 20.6% respectively. Over the previous week the market value of the iM-Composite (SPY-IEF) Timer gained -0.01% at a time when SPY gained -0.01%. A starting capital of $100,000 at inception on 6/30/2016 would have grown to $128,433 which includes $833 cash and excludes $1,390 spent on fees and slippage. |
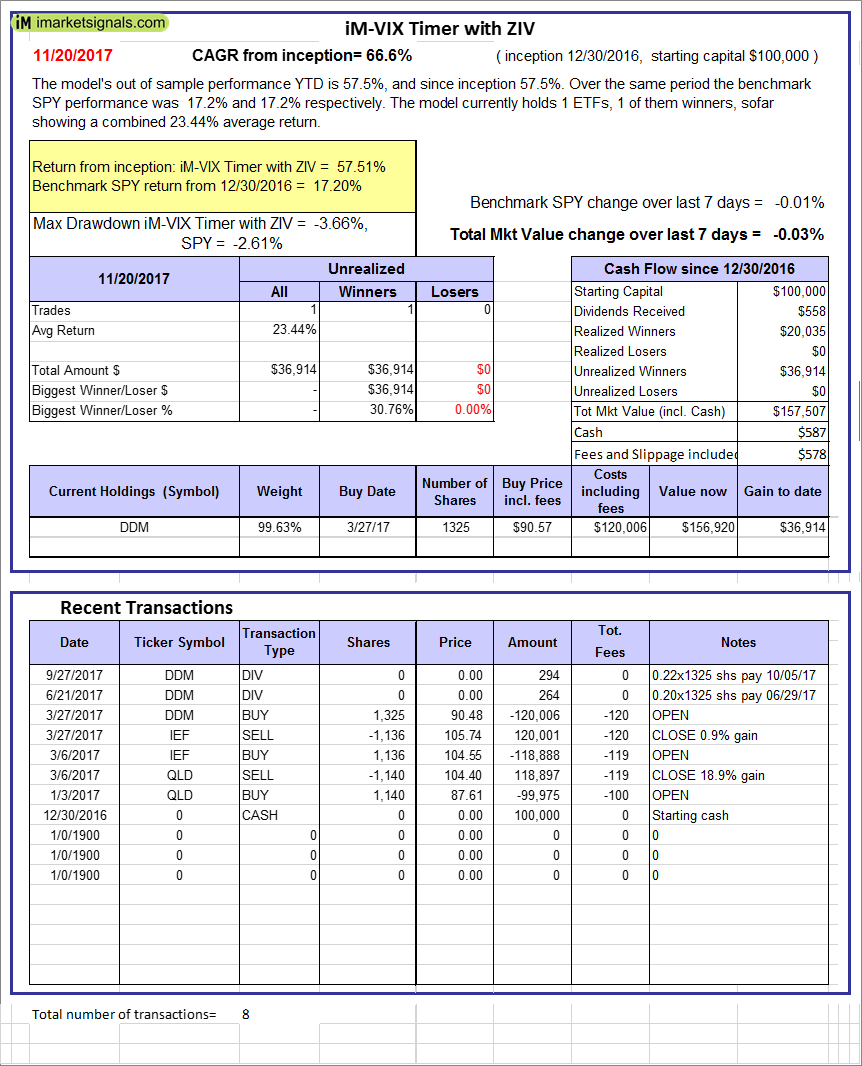 |
iM-VIX Timer with ZIV: The model’s out of sample performance YTD is 57.5%, and since inception 57.5%. Over the same period the benchmark SPY performance was 17.2% and 17.2% respectively. Over the previous week the market value of the iM-VIX Timer with ZIV gained -0.03% at a time when SPY gained -0.01%. A starting capital of $100,000 at inception on 6/30/2016 would have grown to $157,507 which includes $587 cash and excludes $578 spent on fees and slippage. |
 |
iM-Composite(Gold-Stocks-Bond) Timer: The model’s out of sample performance YTD is 21.6%, and for the last 12 months is 21.6%. Over the same period the benchmark SPY performance was 17.2% and 20.6% respectively. Over the previous week the market value of the iM-Composite(Gold-Stocks-Bond) Timer gained 0.00% at a time when SPY gained -0.01%. A starting capital of $100,000 at inception on 6/30/2016 would have grown to $126,315 which includes $53 cash and excludes $1,955 spent on fees and slippage. |
 |
iM-Low Turnover Composite Timer Combo: The model’s out of sample performance from inception is 4.5%. The benchmark SPY performance over the same period is 11.5%. Over the previous week the market value of the iM-Low Turnover Composite Timer Combo gained 0.33% at a time when SPY gained -0.01%. A starting capital of $100,000 at inception on 3/24/27 would have grown to $104,510 which includes $974 cash and excludes $69 spent on fees and slippage. |
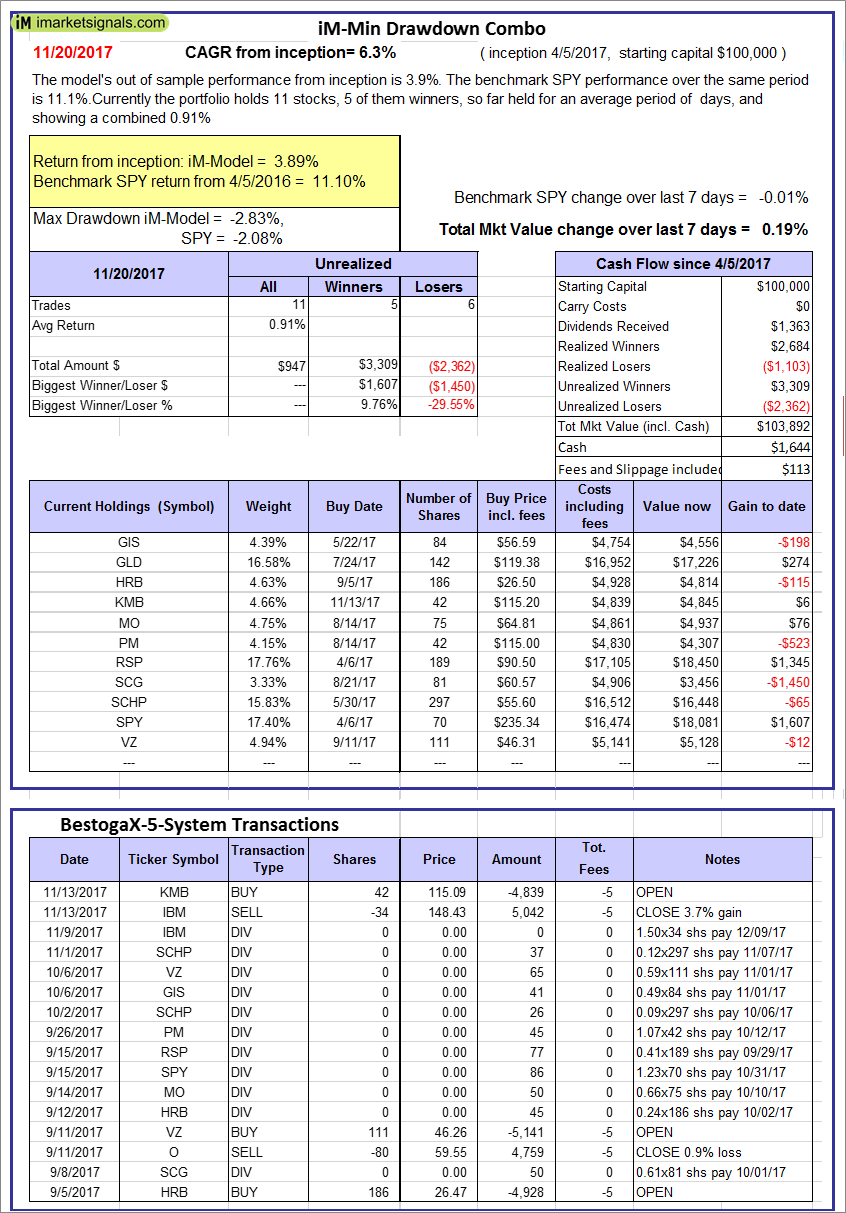 |
iM-Min Drawdown Combo: The model’s out of sample performance from inception is 3.9%. The benchmark SPY performance over the same period is 11.1%. Over the previous week the market value of the iM-Min Drawdown Combo gained 0.19% at a time when SPY gained -0.01%. A starting capital of $100,000 at inception on 4/5/2017 would have grown to $103,892 which includes $1,644 cash and excludes $113 spent on fees and slippage. |
 |
iM-5ETF Trader (includes leveraged ETFs): The model’s out of sample performance YTD is 35.9%, and for the last 12 months is 44.5%. Over the same period the benchmark SPY performance was 17.2% and 20.6% respectively. Over the previous week the market value of the iM-5ETF Trader (includes leveraged ETFs) gained 0.84% at a time when SPY gained -0.01%. A starting capital of $100,000 at inception on 10/30/2016 would have grown to $153,382 which includes $757 cash and excludes $1,030 spent on fees and slippage. |
 |
iM-Standard 5ETF Trader (excludes leveraged ETFs): The model’s out of sample performance YTD is 17.4%, and for the last 12 months is 20.0%. Over the same period the benchmark SPY performance was 17.2% and 20.6% respectively. Over the previous week the market value of the iM-Standard 5ETF Trader (excludes leveraged ETFs) gained 0.32% at a time when SPY gained -0.01%. A starting capital of $100,000 at inception on 10/30/2016 would have grown to $120,682 which includes $1,385 cash and excludes $880 spent on fees and slippage. |
Posted in pmp SPY-SH
iM-Best Reports – 11/13/2017
  |
Out of sample performance summary of our models for the past 1, 2, 4 and 13 week periods. The active active return indicates how the models over- or underperformed the benchmark ETF SPY. Also the YTD, and the 1-, 3-, 5- and 10-year annualized returns are shown in the second table |
 |
iM-Best(SPY-SH).R1: The model’s out of sample performance YTD is 17.8%, and for the last 12 months is 21.7%. Over the same period the benchmark SPY performance was 17.2% and 21.8% respectively. Over the previous week the market value of Best(SPY-SH) gained -0.20% at a time when SPY gained -0.20%. A starting capital of $100,000 at inception on 1/2/2009 would have grown to $544,548 which includes $7,222 cash and excludes $15,358 spent on fees and slippage. |
 |
iM-Combo3.R1: The model’s out of sample performance YTD is 20.8%, and for the last 12 months is 26.5%. Over the same period the benchmark SPY performance was 17.2% and 21.8% respectively. Over the previous week the market value of iM-Combo3.R1 gained -0.28% at a time when SPY gained -0.20%. A starting capital of $100,000 at inception on 2/3/2014 would have grown to $151,733 which includes -$544 cash and excludes $3,437 spent on fees and slippage. |
 |
iM-Combo5: The model’s out of sample performance YTD is 25.1%, and for the last 12 months is 27.8%. Over the same period the benchmark SPY performance was 17.2% and 21.8% respectively. Over the previous week the market value of iM-Combo5 gained -0.19% at a time when SPY gained -0.20%. A starting capital of $100,000 at inception on 2/22/2016 would have grown to $123,409 which includes $409 cash and excludes $603 spent on fees and slippage. |
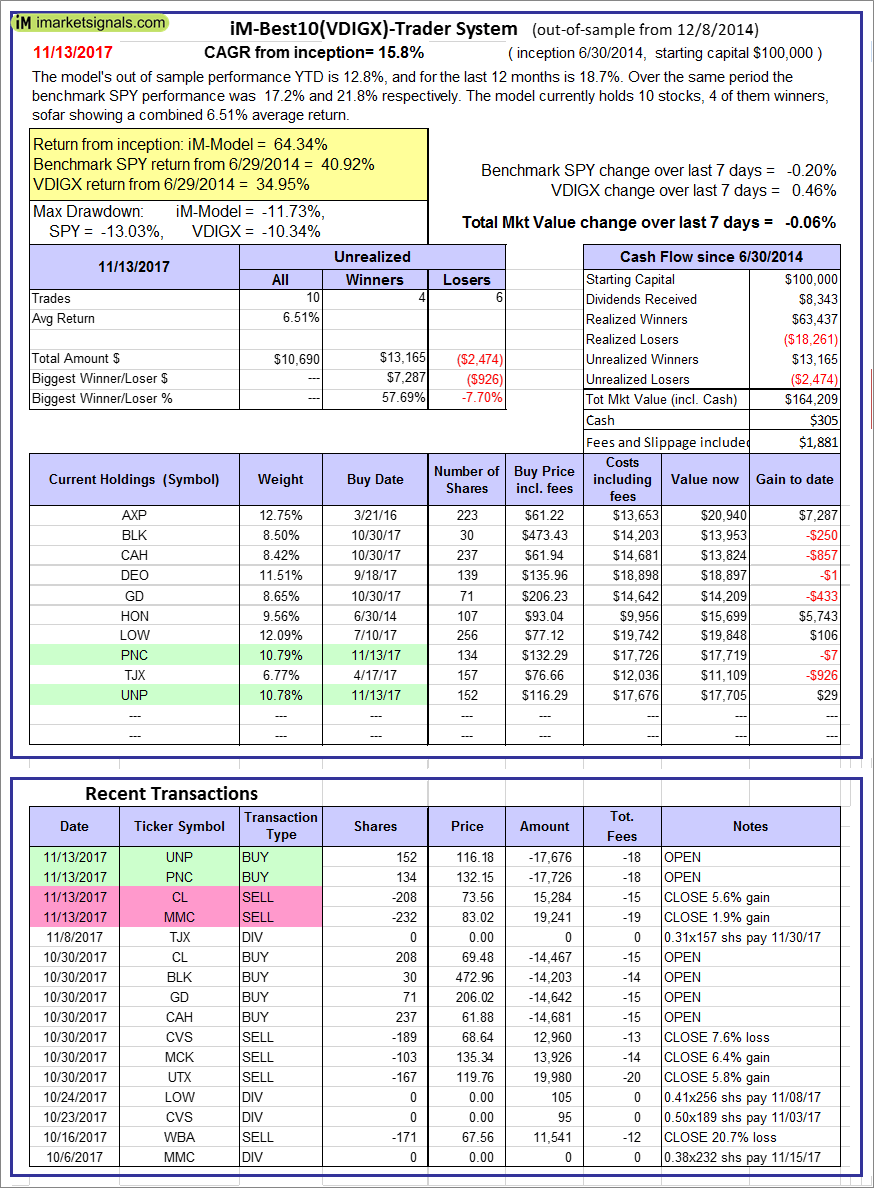  |
iM-Best10(VDIGX)-Trader: The model’s out of sample performance YTD is 12.8%, and for the last 12 months is 18.7%. Over the same period the benchmark SPY performance was 17.2% and 21.8% respectively. Since inception, on 7/1/2014, the model gained 64.34% while the benchmark SPY gained 40.92% and VDIGX gained 34.95% over the same period. Over the previous week the market value of iM-Best10(VDIGX) gained -0.06% at a time when SPY gained -0.20%. A starting capital of $100,000 at inception on 7/1/2014 would have grown to $164,209 which includes $305 cash and excludes $1,881 spent on fees and slippage. |
 |
iM-BESTOGA-3: The model’s out of sample performance YTD is 9.7%, and for the last 12 months is 12.9%. Over the same period the benchmark SPY performance was 17.2% and 21.8% respectively. Over the previous week the market value of iM-BESTOGA-3 gained 3.53% at a time when SPY gained -0.20%. A starting capital of $100,000 at inception on 2/3/2014 would have grown to $221,947 which includes $1,003 cash and excludes $1,818 spent on fees and slippage. |
 |
iM-Best7(HiD-LoV): The model’s out of sample performance YTD is 4.1%, and for the last 12 months is 8.3%. Over the same period the benchmark SPY performance was 17.2% and 21.8% respectively. Over the previous week the market value of iM-BESTOGA-3 gained 2.17% at a time when SPY gained -0.20%. A starting capital of $100,000 at inception on 6/30/2016 would have grown to $106,808 which includes -$58 cash and excludes $1,254 spent on fees and slippage. |
 |
iM 6-Stock Capital Strength Portfolio: The model’s out of sample performance YTD is 33.6%, and for the last 12 months is 38.4%. Over the same period the benchmark SPY performance was 17.2% and 21.8% respectively. Over the previous week the market value of the iM 6-Stock Capital Strength Portfolio gained 0.97% at a time when SPY gained -0.20%. A starting capital of $100,000 at inception on 10/28/2016 would have grown to $141,084 which includes $728 cash and excludes $559 spent on fees and slippage. |
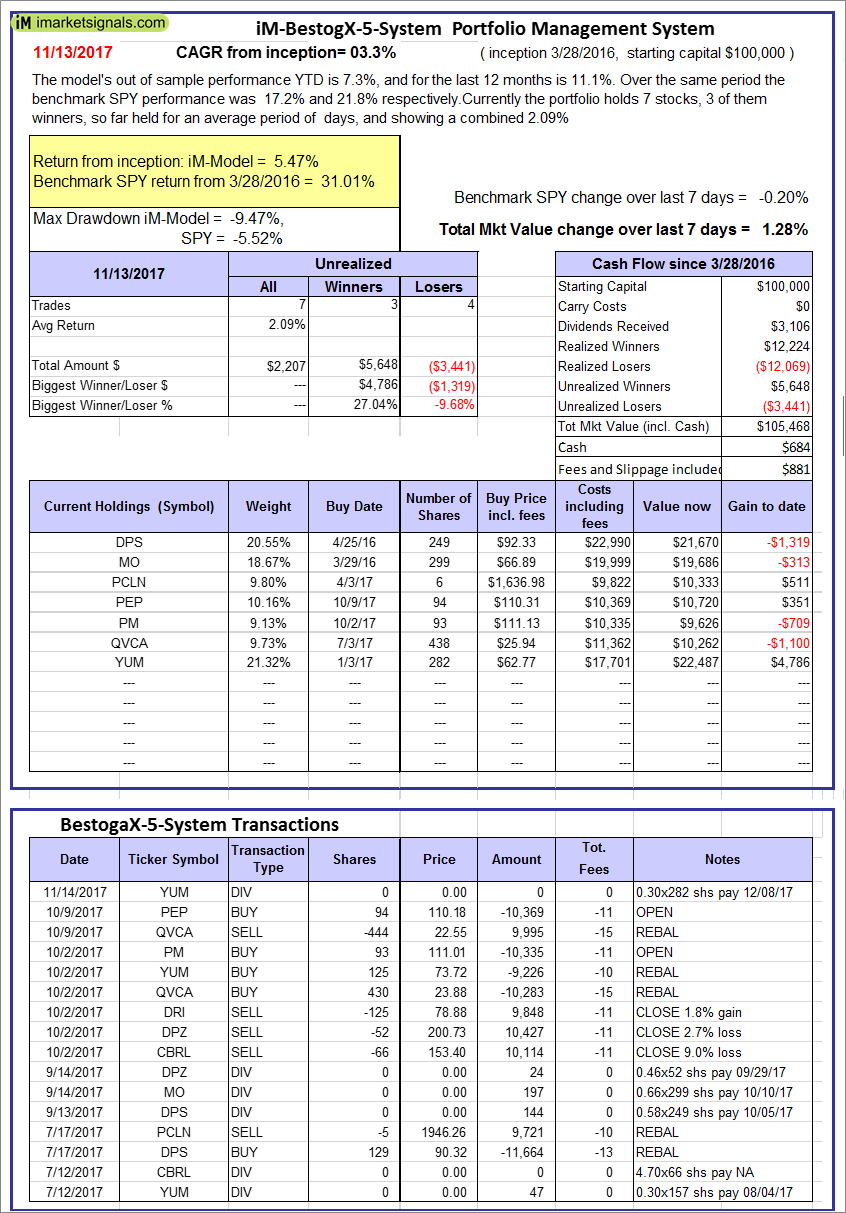 |
iM-BestogaX5-System: The model’s out of sample performance YTD is 7.3%, and for the last 12 months is 11.1%. Over the same period the benchmark SPY performance was 17.2% and 21.8% respectively. Over the previous week the market value of iM-Best8(S&P 500)Tax-Eff. gained 1.28% at a time when SPY gained -0.20%. A starting capital of $100,000 at inception on 3/28/2016 would have grown to $105,468 which includes $684 cash and excludes $881 spent on fees and slippage. |
  |
iM-Best12(USMV)-Trader: The model’s out of sample performance YTD is 17.2%, and for the last 12 months is 20.6%. Over the same period the benchmark SPY performance was 17.2% and 21.8% respectively. Since inception, on 6/30/2014, the model gained 63.86% while the benchmark SPY gained 40.92% and the ETF USMV gained 158.33% over the same period. Over the previous week the market value of iM-Best12(USMV)-Trader gained 0.21% at a time when SPY gained -0.20%. A starting capital of $100,000 at inception on 6/30/2014 would have grown to $163,859 which includes $231 cash and excludes $3,601 spent on fees and slippage. |
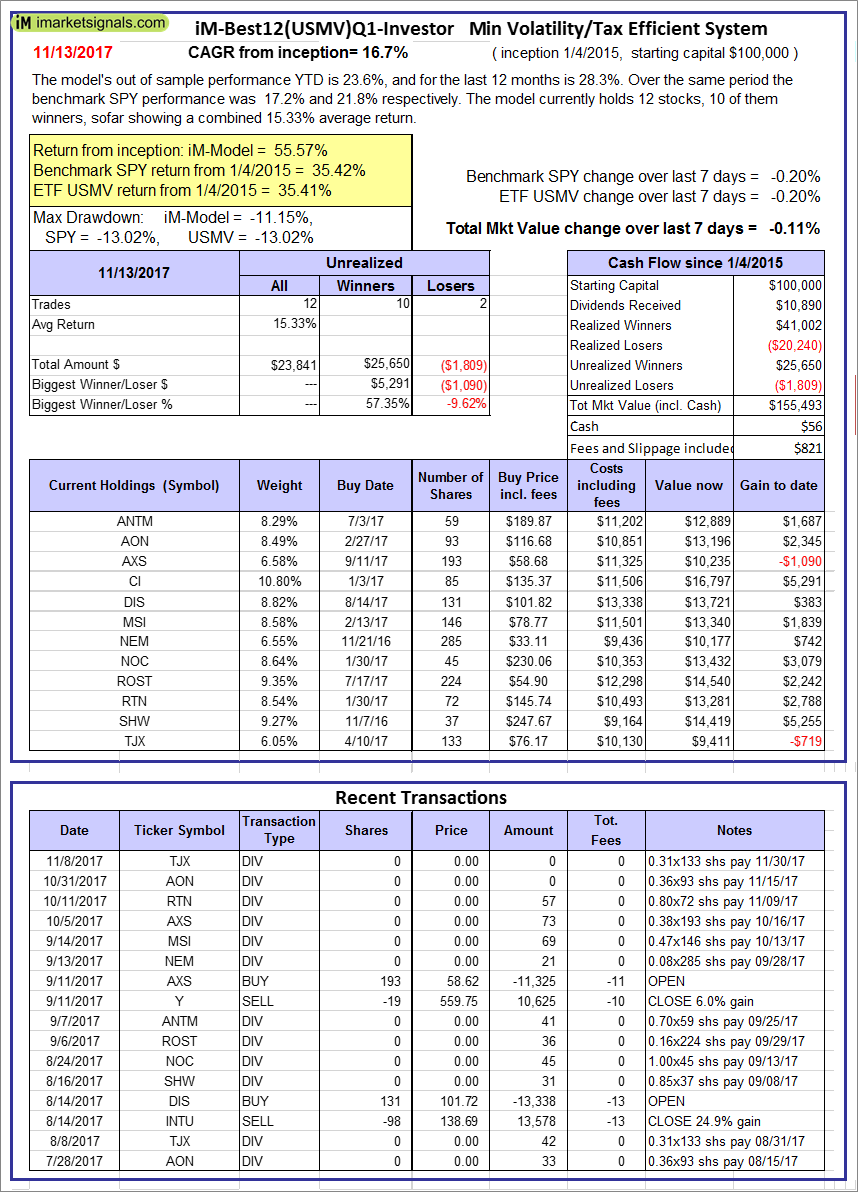 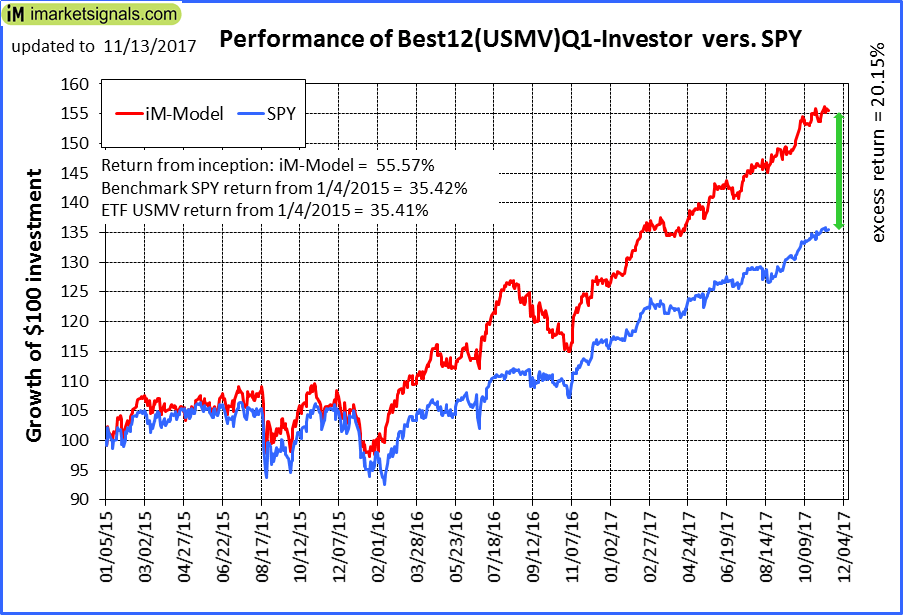 |
iM-Best12(USMV)Q1-Investor: The model’s out of sample performance YTD is 23.6%, and for the last 12 months is 28.3%. Over the same period the benchmark SPY performance was 17.2% and 21.8% respectively. Since inception, on 1/5/2015, the model gained 55.57% while the benchmark SPY gained 35.42% and the ETF USMV gained 35.41% over the same period. Over the previous week the market value of iM-Best12(USMV)Q1 gained -0.11% at a time when SPY gained -0.20%. A starting capital of $100,000 at inception on 1/5/2015 would have grown to $155,493 which includes $56 cash and excludes $821 spent on fees and slippage. |
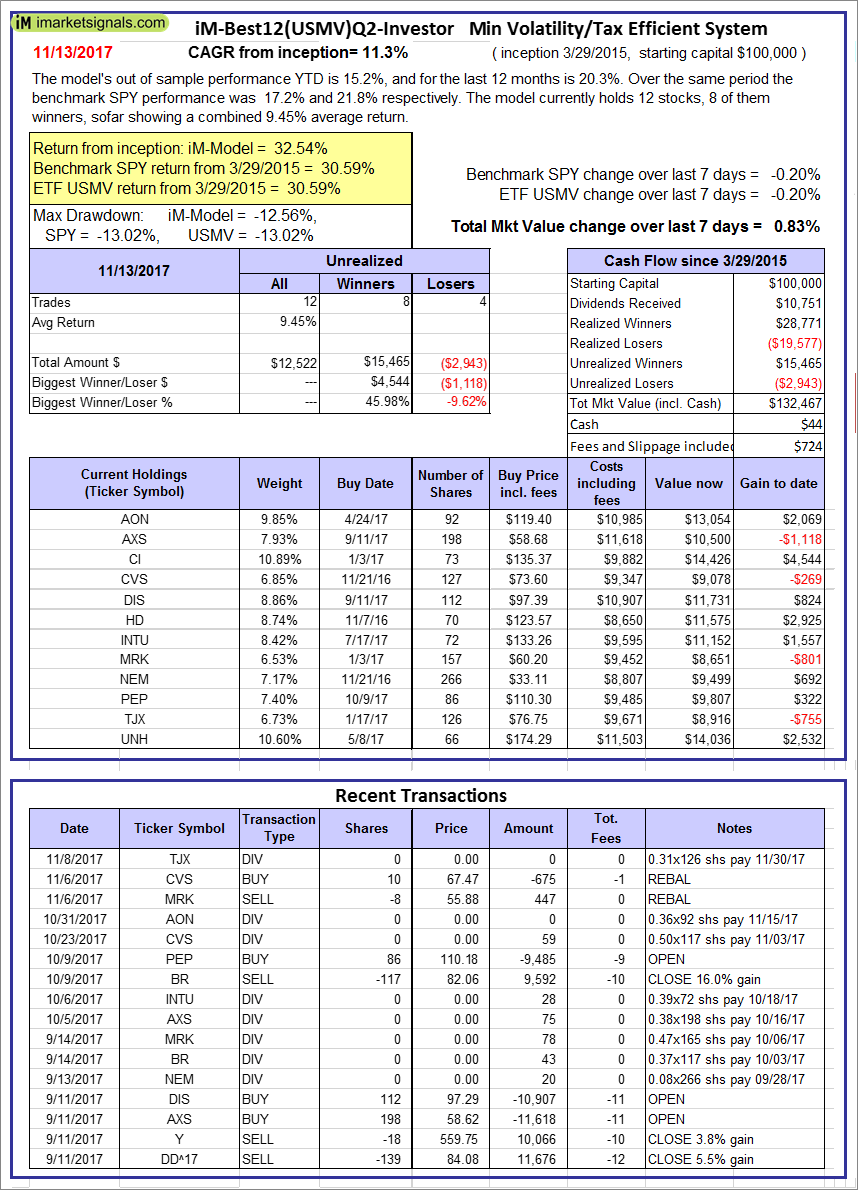  |
iM-Best12(USMV)Q2-Investor: The model’s out of sample performance YTD is 15.2%, and for the last 12 months is 20.3%. Over the same period the benchmark SPY performance was 17.2% and 21.8% respectively. Since inception, on 3/30/2015, the model gained 32.54% while the benchmark SPY gained 30.59% and the ETF USMV gained 30.59% over the same period. Over the previous week the market value of iM-Best12(USMV)Q2 gained 0.83% at a time when SPY gained -0.20%. A starting capital of $100,000 at inception on 3/30/2015 would have grown to $132,467 which includes $44 cash and excludes $724 spent on fees and slippage. |
  |
iM-Best12(USMV)Q3-Investor: The model’s out of sample performance YTD is 9.6%, and for the last 12 months is 14.9%. Over the same period the benchmark SPY performance was 17.2% and 21.8% respectively. Since inception, on 7/1/2014, the model gained 69.96% while the benchmark SPY gained 40.92% and the ETF USMV gained 158.33% over the same period. Over the previous week the market value of iM-Best12(USMV)Q3 gained -0.23% at a time when SPY gained -0.20%. A starting capital of $100,000 at inception on 7/1/2014 would have grown to $169,705 which includes -$268 cash and excludes $1,128 spent on fees and slippage. |
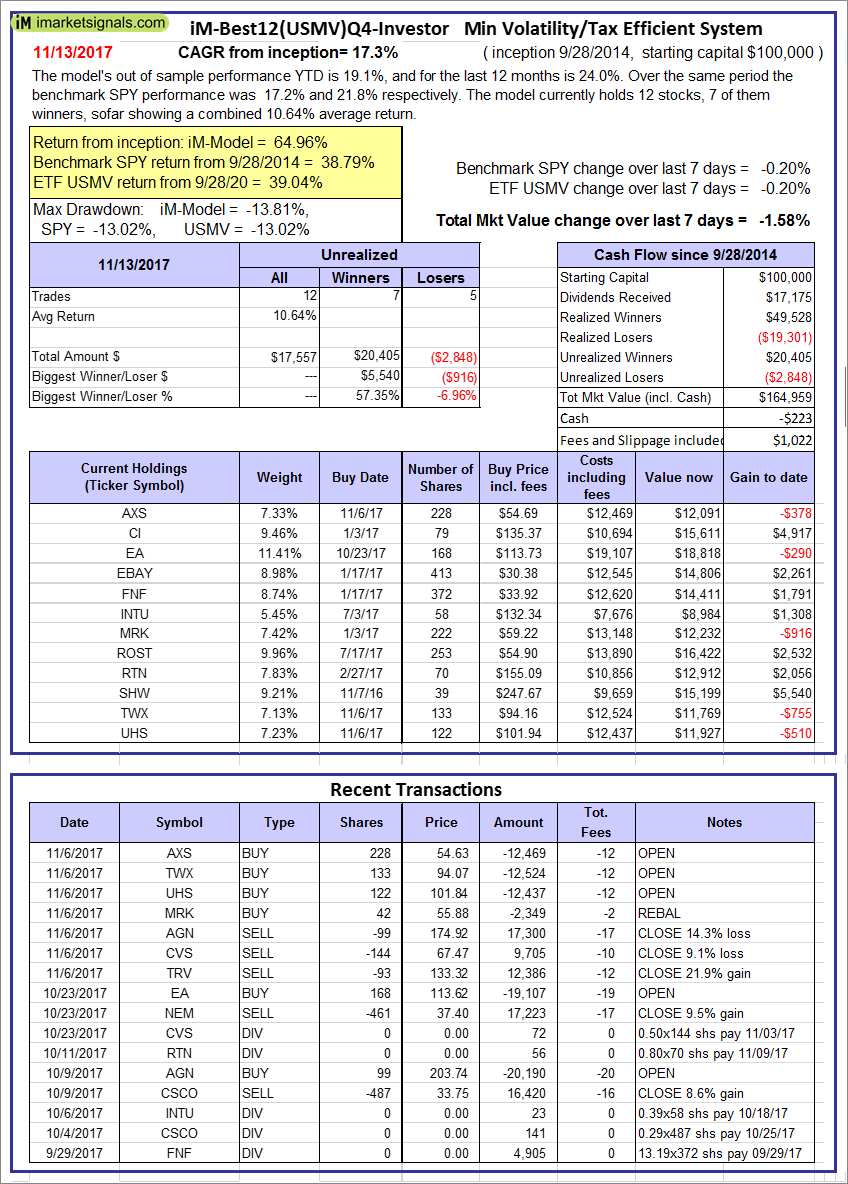  |
iM-Best12(USMV)Q4-Investor: Since inception, on 9/29/2014, the model gained 64.96% while the benchmark SPY gained 38.79% and the ETF USMV gained 39.04% over the same period. Over the previous week the market value of iM-Best12(USMV)Q4 gained -1.58% at a time when SPY gained -0.20%. A starting capital of $100,000 at inception on 9/29/2014 would have grown to $164,959 which includes -$223 cash and excludes $1,022 spent on fees and slippage. |
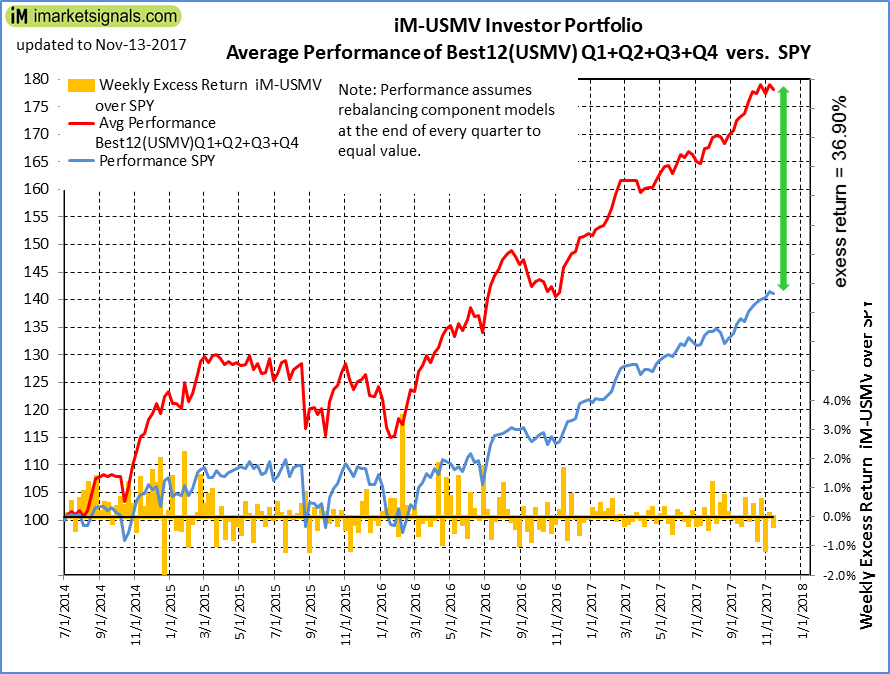 |
Average Performance of iM-Best12(USMV)Q1+Q2+Q3+Q4-Investor resulted in an excess return of 36.90% over SPY. (see iM-USMV Investor Portfolio) |
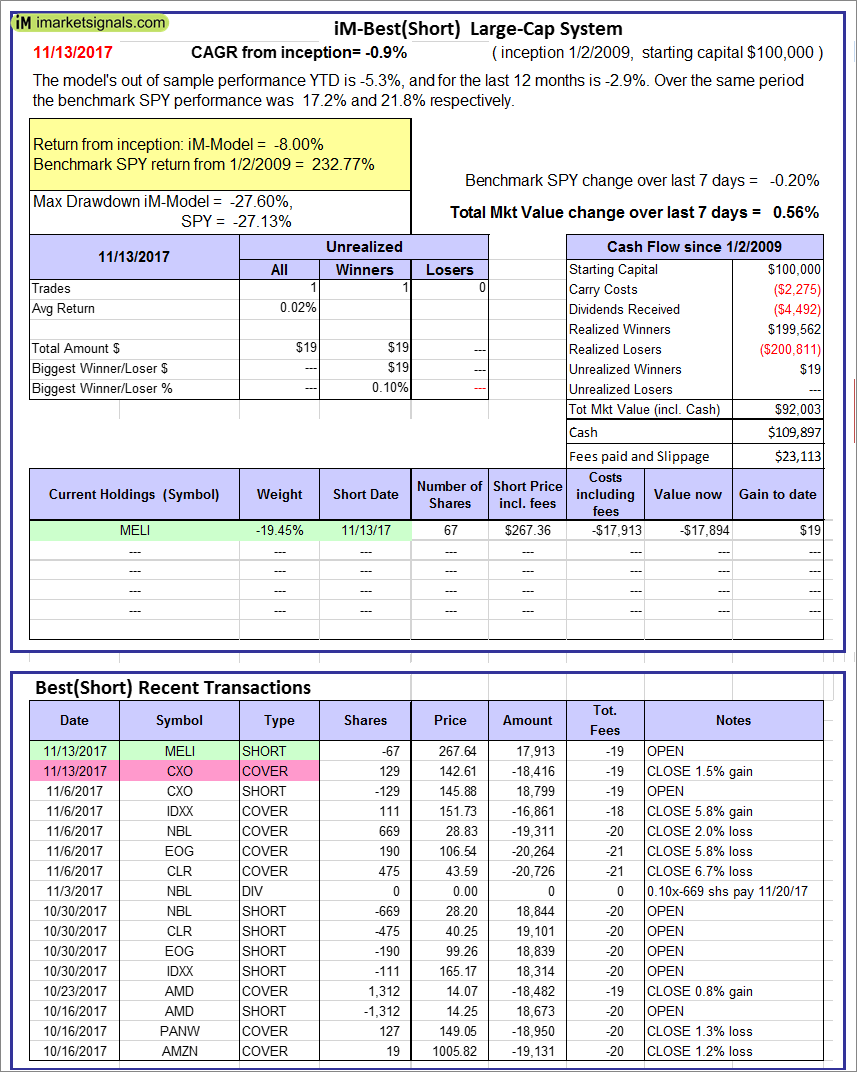 |
iM-Best(Short): The model’s out of sample performance YTD is -5.3%, and for the last 12 months is -2.9%. Over the same period the benchmark SPY performance was 17.2% and 21.8% respectively. Over the previous week the market value of iM-Best(Short) gained 0.56% at a time when SPY gained -0.20%. Over the period 1/2/2009 to 11/13/2017 the starting capital of $100,000 would have grown to $92,003 which includes $109,897 cash and excludes $23,113 spent on fees and slippage. |
 |
iM-Best2 MC-Score ETF System: The model’s out of sample performance YTD is 11.7%, and for the last 12 months is 15.3%. Over the same period the benchmark SPY performance was 17.2% and 21.8% respectively. Over the previous week the market value of the iM-Best2 MC-Score ETF System gained 2.29% at a time when SPY gained -0.20%. A starting capital of $100,000 at inception on 6/30/2016 would have grown to $108,330 which includes $70 cash and excludes $115 spent on fees and slippage. |
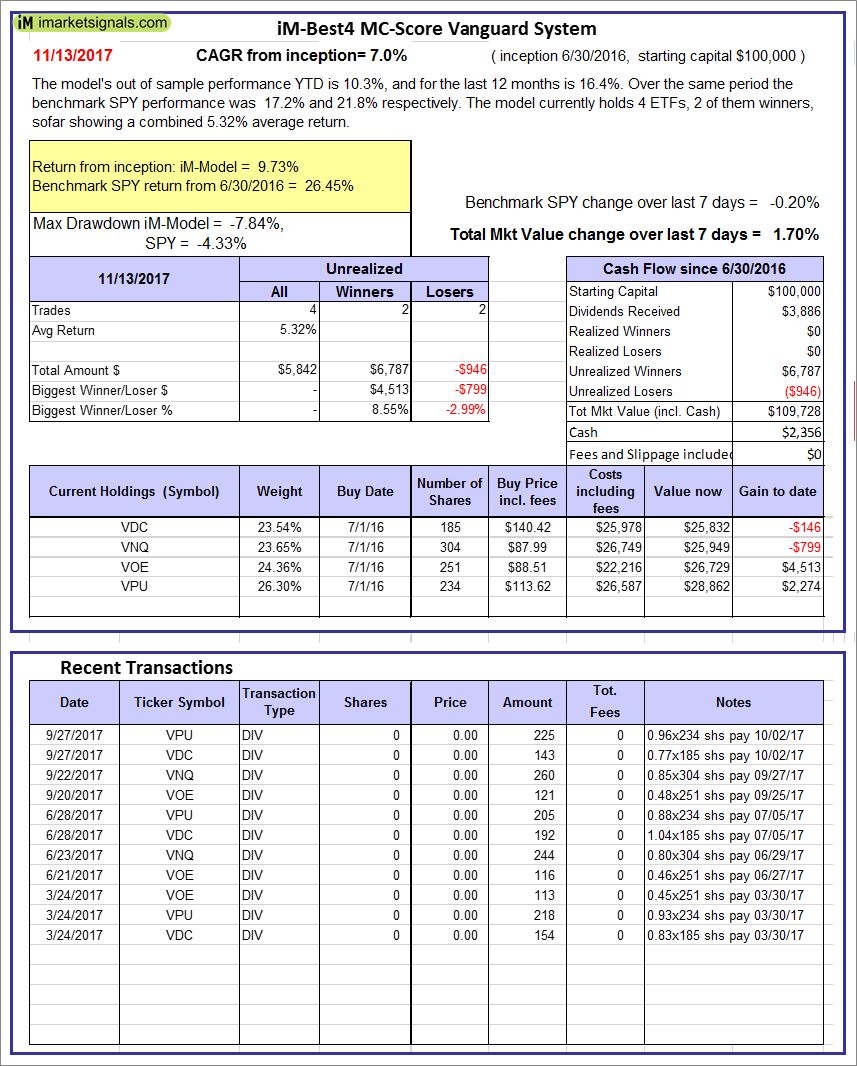 |
iM-Best4 MC-Score Vanguard System: The model’s out of sample performance YTD is 10.3%, and for the last 12 months is 16.4%. Over the same period the benchmark SPY performance was 17.2% and 21.8% respectively. Over the previous week the market value of the iM-Best4 MC-Score Vanguard System gained 1.70% at a time when SPY gained -0.20%. A starting capital of $100,000 at inception on 6/30/2016 would have grown to $109,728 which includes $2,356 cash and excludes $00 spent on fees and slippage. |
 |
iM-Composite (SH-RSP) Timer: The model’s out of sample performance YTD is 13.2%, and for the last 12 months is 17.5%. Over the same period the benchmark SPY performance was 17.2% and 21.8% respectively. Over the previous week the market value of the iM-Composite (SH-RSP) Timer gained -0.08% at a time when SPY gained -0.20%. A starting capital of $100,000 at inception on 6/30/2016 would have grown to $124,361 which includes $1,593 cash and excludes $513 spent on fees and slippage. |
 |
iM-Composite (SPY-IEF) Timer: The model’s out of sample performance YTD is 19.3%, and for the last 12 months is 23.3%. Over the same period the benchmark SPY performance was 17.2% and 21.8% respectively. Over the previous week the market value of the iM-Composite (SPY-IEF) Timer gained -0.20% at a time when SPY gained -0.20%. A starting capital of $100,000 at inception on 6/30/2016 would have grown to $128,448 which includes $833 cash and excludes $1,390 spent on fees and slippage. |
 |
iM-VIX Timer with ZIV: The model’s out of sample performance YTD is 57.6%, and since inception 57.6%. Over the same period the benchmark SPY performance was 17.2% and 17.2% respectively. Over the previous week the market value of the iM-VIX Timer with ZIV gained -0.62% at a time when SPY gained -0.20%. A starting capital of $100,000 at inception on 6/30/2016 would have grown to $157,546 which includes $587 cash and excludes $578 spent on fees and slippage. |
 |
iM-Composite(Gold-Stocks-Bond) Timer: The model’s out of sample performance YTD is 21.6%, and for the last 12 months is 23.6%. Over the same period the benchmark SPY performance was 17.2% and 21.8% respectively. Over the previous week the market value of the iM-Composite(Gold-Stocks-Bond) Timer gained -0.26% at a time when SPY gained -0.20%. A starting capital of $100,000 at inception on 6/30/2016 would have grown to $126,315 which includes $53 cash and excludes $1,955 spent on fees and slippage. |
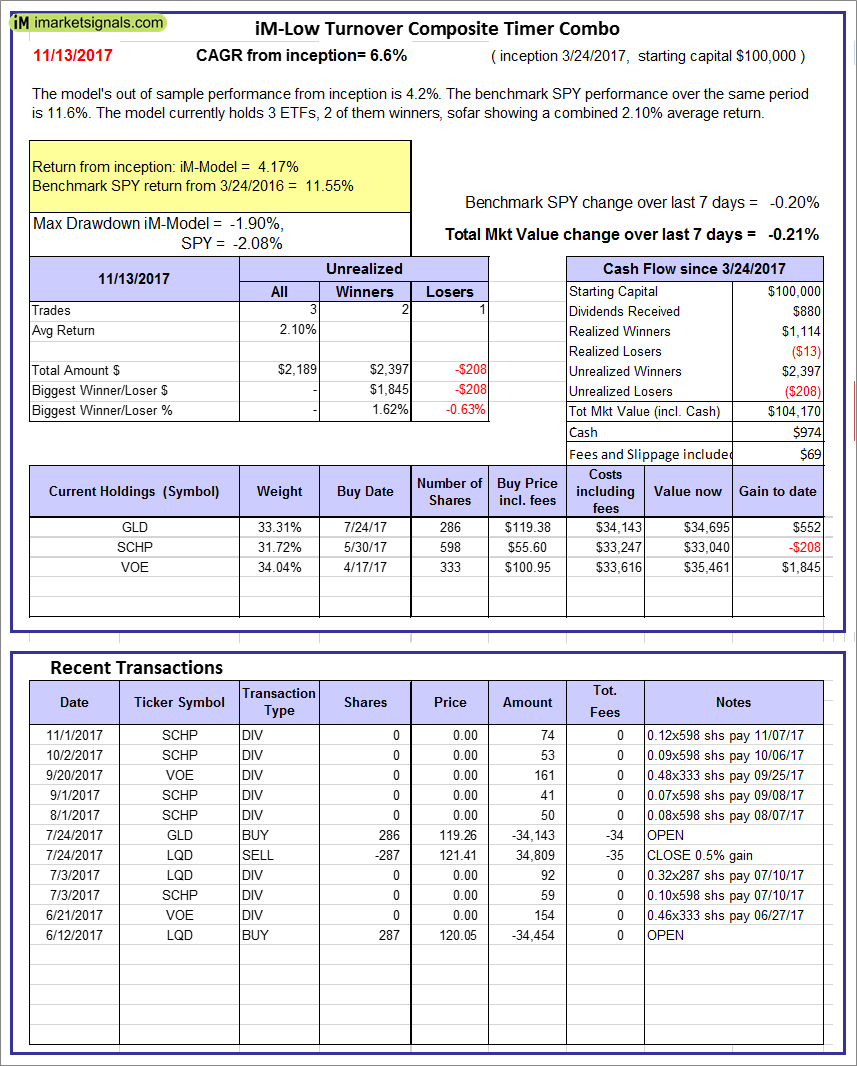 |
iM-Low Turnover Composite Timer Combo: The model’s out of sample performance from inception is 4.2%. The benchmark SPY performance over the same period is 11.6%. Over the previous week the market value of the iM-Low Turnover Composite Timer Combo gained -0.21% at a time when SPY gained -0.20%. A starting capital of $100,000 at inception on 3/24/27 would have grown to $104,170 which includes $974 cash and excludes $69 spent on fees and slippage. |
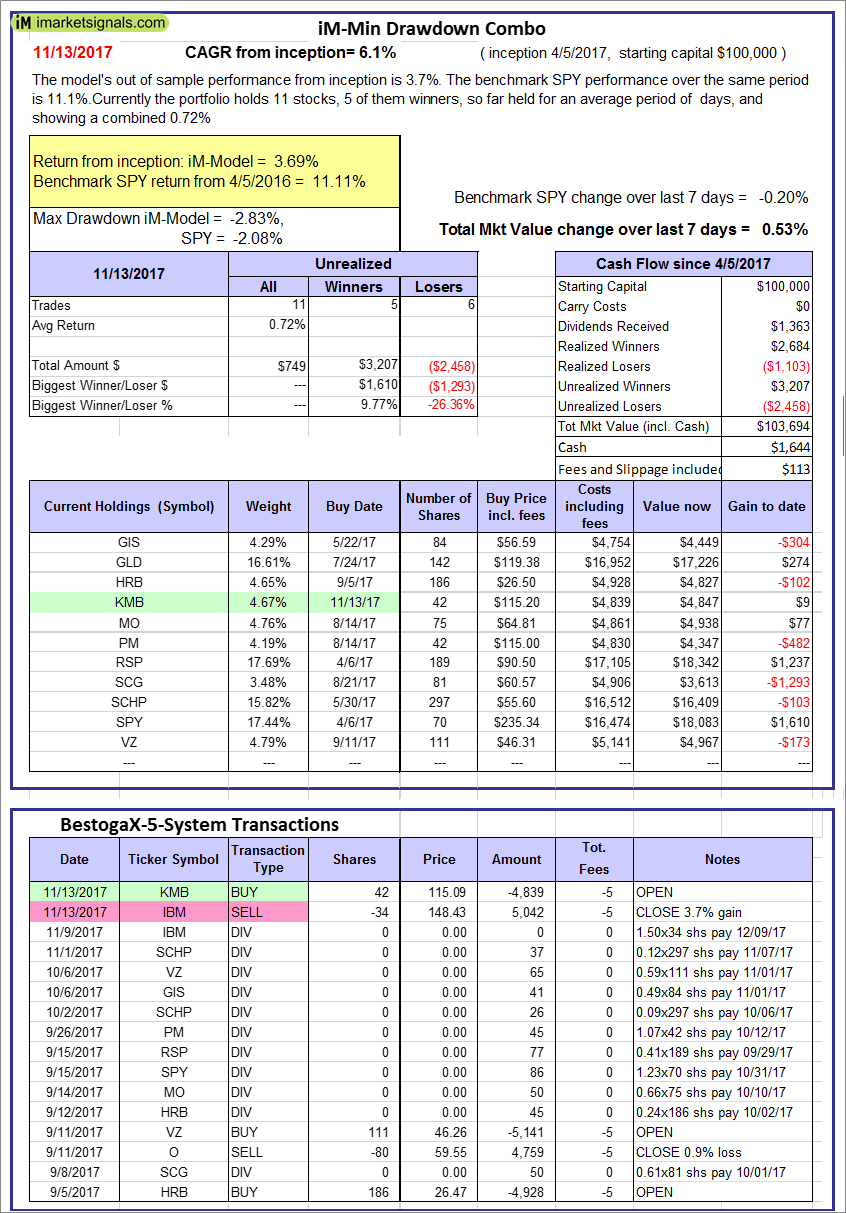 |
iM-Min Drawdown Combo: The model’s out of sample performance from inception is 3.7%. The benchmark SPY performance over the same period is 11.1%. Over the previous week the market value of the iM-Min Drawdown Combo gained 0.53% at a time when SPY gained -0.20%. A starting capital of $100,000 at inception on 4/5/2017 would have grown to $103,694 which includes $1,644 cash and excludes $113 spent on fees and slippage. |
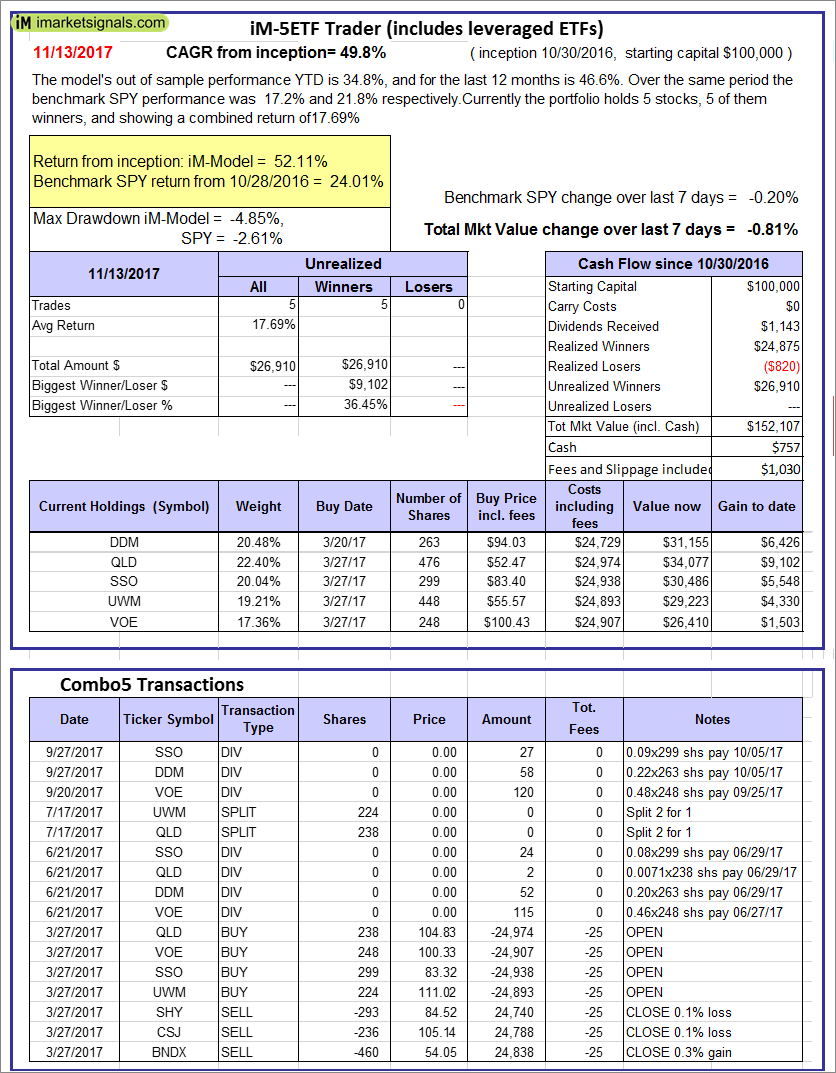 |
iM-5ETF Trader (includes leveraged ETFs): The model’s out of sample performance YTD is 34.8%, and for the last 12 months is 46.6%. Over the same period the benchmark SPY performance was 17.2% and 21.8% respectively. Over the previous week the market value of the iM-5ETF Trader (includes leveraged ETFs) gained -0.81% at a time when SPY gained -0.20%. A starting capital of $100,000 at inception on 10/30/2016 would have grown to $152,107 which includes $757 cash and excludes $1,030 spent on fees and slippage. |
 |
iM-Standard 5ETF Trader (excludes leveraged ETFs): The model’s out of sample performance YTD is 17.0%, and for the last 12 months is 20.4%. Over the same period the benchmark SPY performance was 17.2% and 21.8% respectively. Over the previous week the market value of the iM-Standard 5ETF Trader (excludes leveraged ETFs) gained -0.11% at a time when SPY gained -0.20%. A starting capital of $100,000 at inception on 10/30/2016 would have grown to $120,301 which includes $1,385 cash and excludes $880 spent on fees and slippage. |
Posted in pmp SPY-SH
With reference to Section 202(a)(11)(D) of the Investment Advisers Act:
We are Engineers and not Investment Advisers,
read more ...
By the mere act of reading this page and navigating this site you acknowledge, agree to, and abide by the
Terms of Use / Disclaimer