
  |
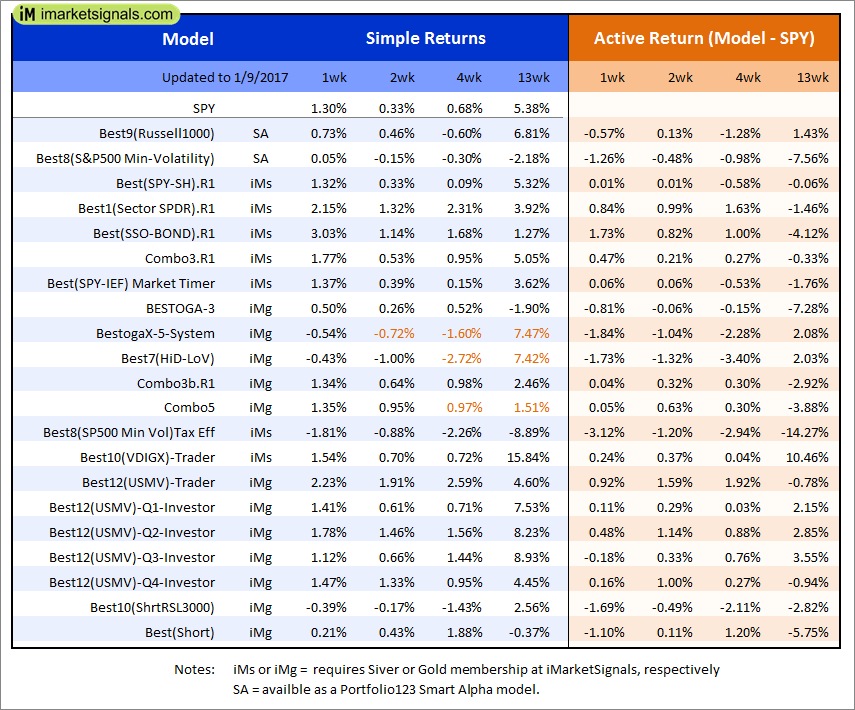
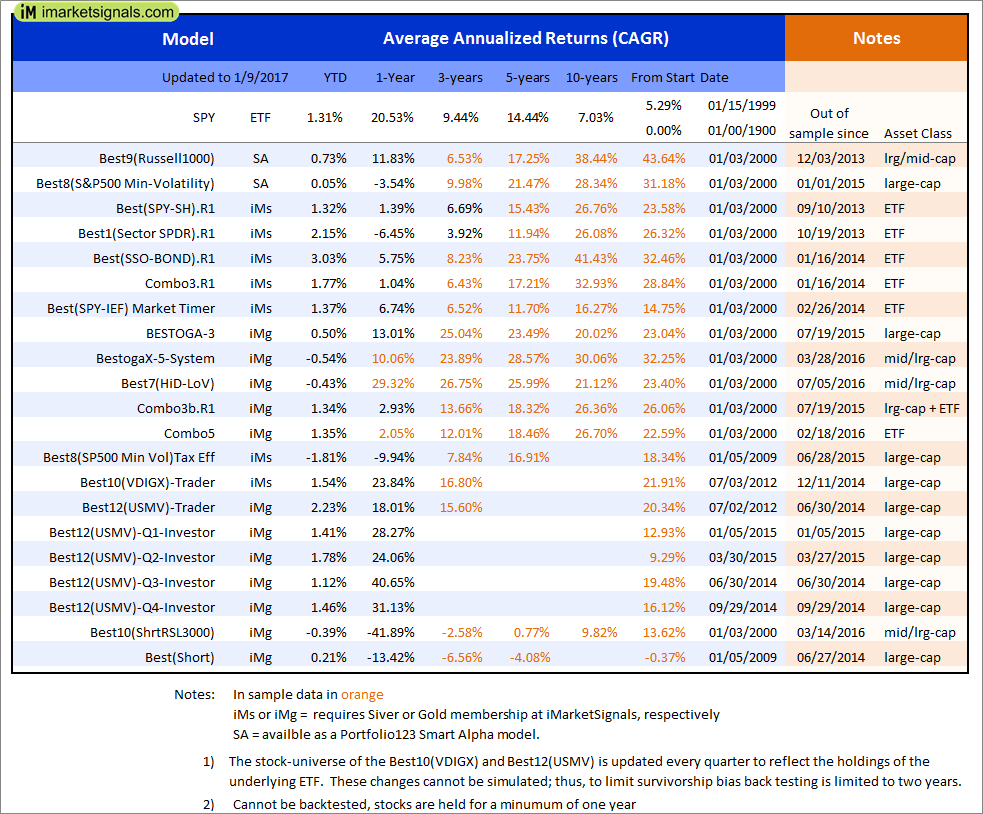
Out of sample performance summary of our models for the past 1, 2, 4 and 13 week periods. The active active return indicates how the models over- or underperformed the benchmark ETF SPY. Also the YTD, and the 1-, 3-, 5- and 10-year annualized returns are shown in the second table |
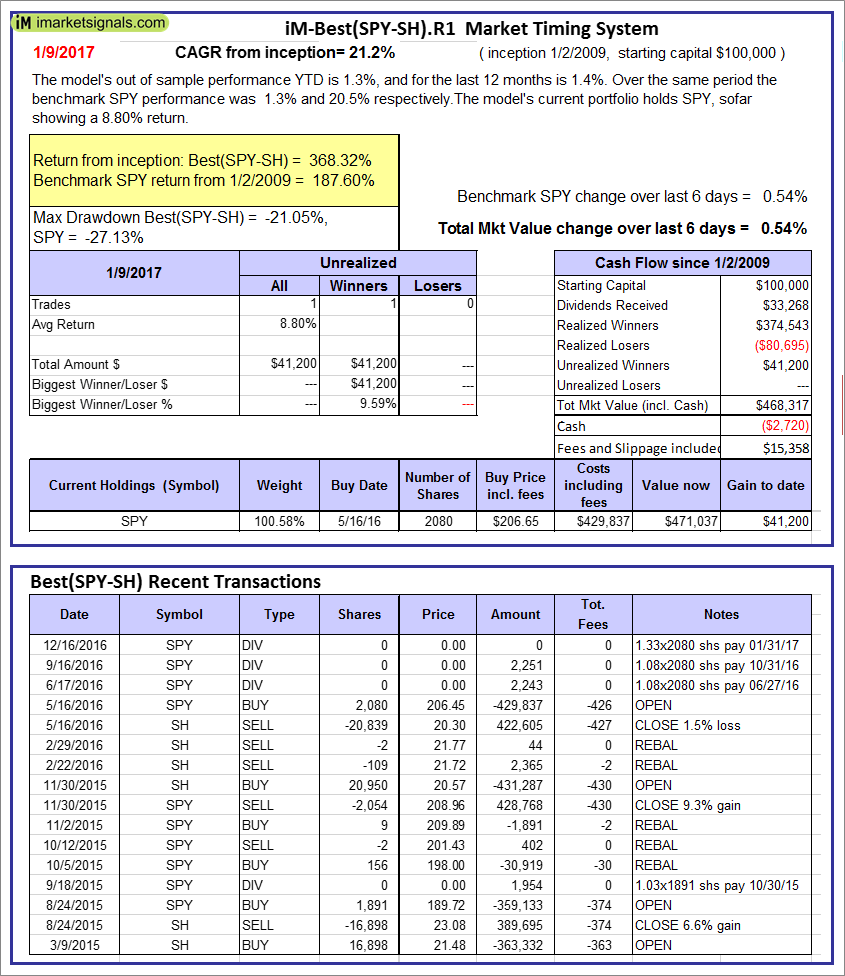 |
iM-Best(SPY-SH).R1: The model’s out of sample performance YTD is 1.3%, and for the last 12 months is 1.4%. Over the same period the benchmark SPY performance was 1.3% and 20.5% respectively. Over the previous week the market value of Best(SPY-SH) gained 0.54% at a time when SPY gained 0.54%. A starting capital of $100,000 at inception on 1/2/2009 would have grown to $468,317 which includes -$2,720 cash and excludes $15,358 spent on fees and slippage. |
 |
iM-Combo3.R1: The model’s out of sample performance YTD is 1.8%, and for the last 12 months is 1.0%. Over the same period the benchmark SPY performance was 1.3% and 20.5% respectively. Over the previous week the market value of iM-Combo3.R1 gained 0.81% at a time when SPY gained 0.54%. A starting capital of $100,000 at inception on 2/3/2014 would have grown to $127,883 which includes $182 cash and excludes $3,149 spent on fees and slippage. |
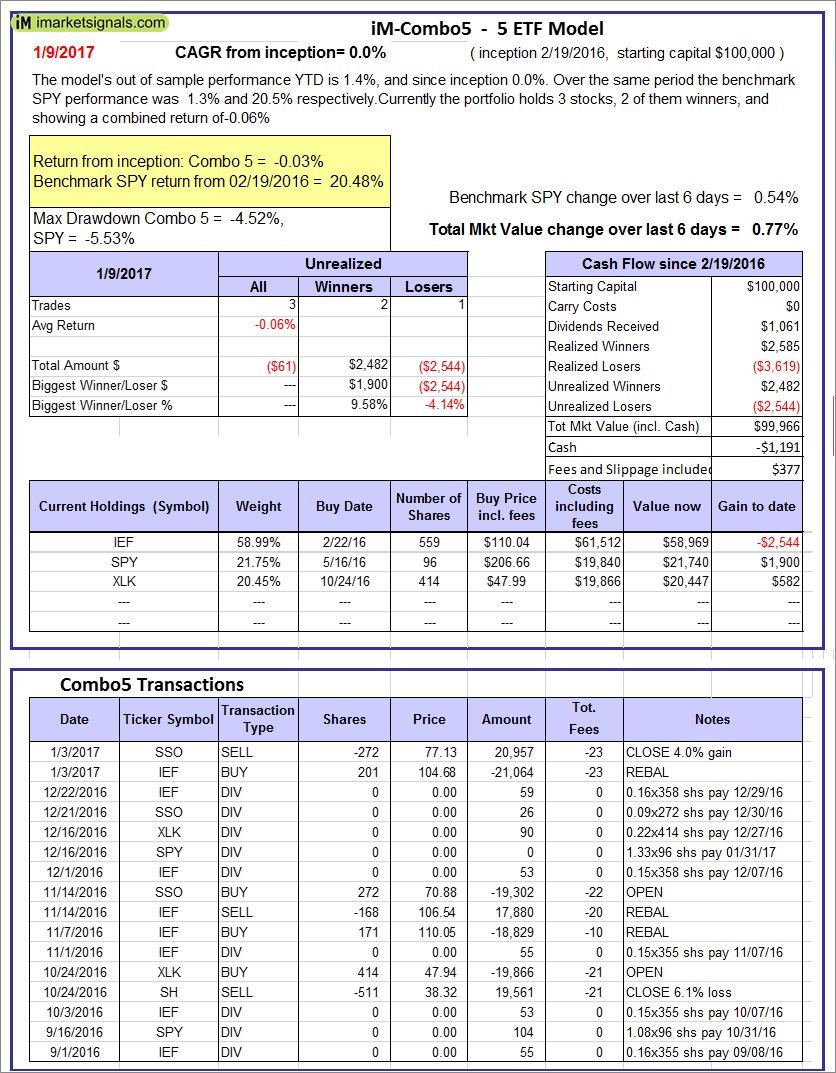 |
iM-Combo5: The model’s out of sample performance YTD is 1.4%, and since inception 0.0%. Over the same period the benchmark SPY performance was 1.3% and 20.5% respectively. Over the previous week the market value of iM-Combo5 gained 0.77% at a time when SPY gained 0.54%. A starting capital of $100,000 at inception on 2/22/2016 would have grown to $99,966 which includes -$1,191 cash and excludes $377 spent on fees and slippage. |
 |
The iM-Best8(S&P500 Min Vol)Tax-Efficient The model’s out of sample performance YTD is -1.8%, and for the last 12 months is -9.9%. Over the same period the benchmark SPY performance was 1.3% and 20.5% respectively. Over the previous week the market value of iM-Best8(S&P 500)Tax-Eff. gained -1.24% at a time when SPY gained 0.54%. A starting capital of $100,000 at inception on 1/2/2009 would have grown to $386,318 which includes -$43,279 cash and excludes $8,236 spent on fees and slippage. |
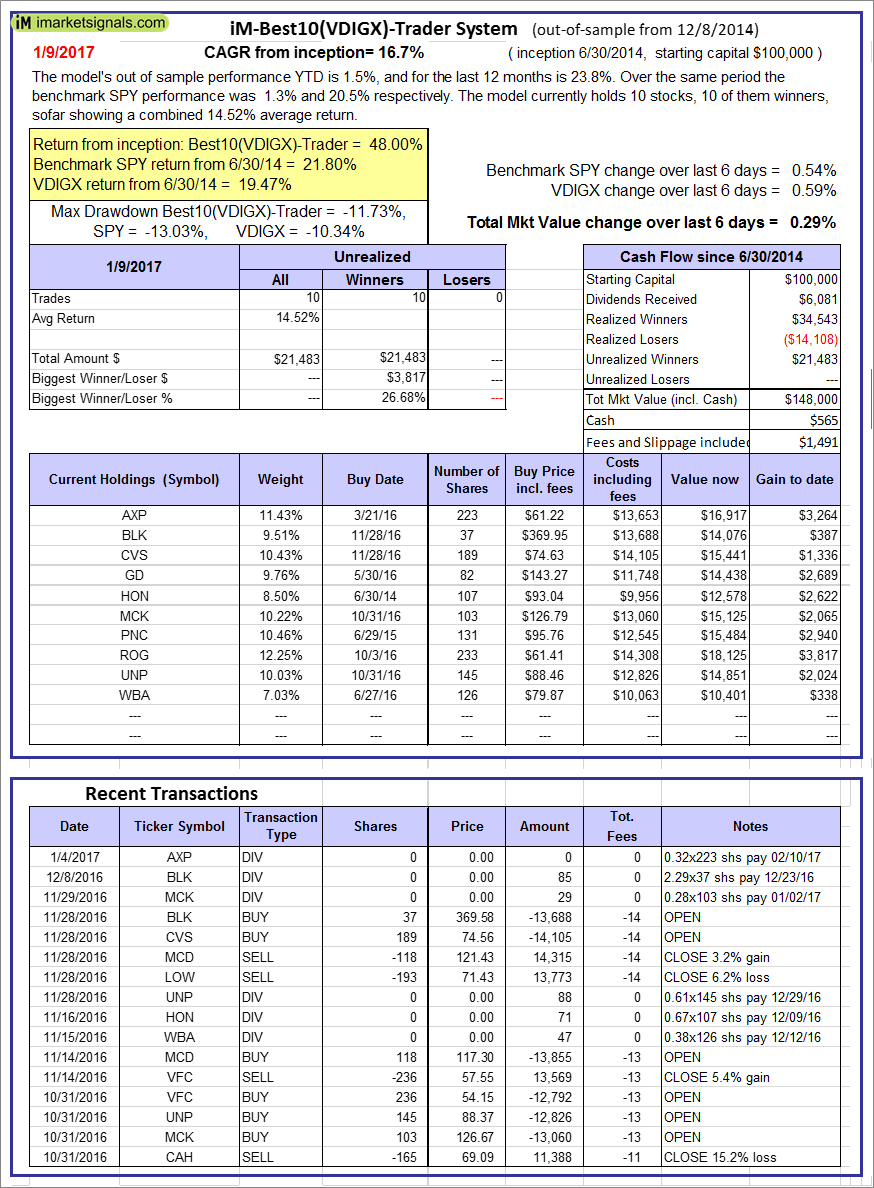  |
iM-Best10(VDIGX)-Trader: The model’s out of sample performance YTD is 1.5%, and for the last 12 months is 23.8%. Over the same period the benchmark SPY performance was 1.3% and 20.5% respectively. Since inception, on 7/1/2014, the model gained 48.00% while the benchmark SPY gained 21.80% and the ETF VDIGX gained 19.47% over the same period. Over the previous week the market value of iM-Best10(VDIGX) gained 0.29% at a time when SPY gained 0.54%. A starting capital of $100,000 at inception on 7/1/2014 would have grown to $148,000 which includes $565 cash and excludes $1,491 spent on fees and slippage. |
 |
iM-Best2 MC-Score ETF System: The model’s out of sample performance YTD is 0.2%, and since inception -2.8%. Over the same period the benchmark SPY performance was 1.3% and 9.3% respectively. Over the previous week the market value of iM-BESTOGA-3 gained -0.08% at a time when SPY gained 0.54%. A starting capital of $100,000 at inception on 2/3/2014 would have grown to $746 which includes $105 cash and excludes Gain to date spent on fees and slippage. |
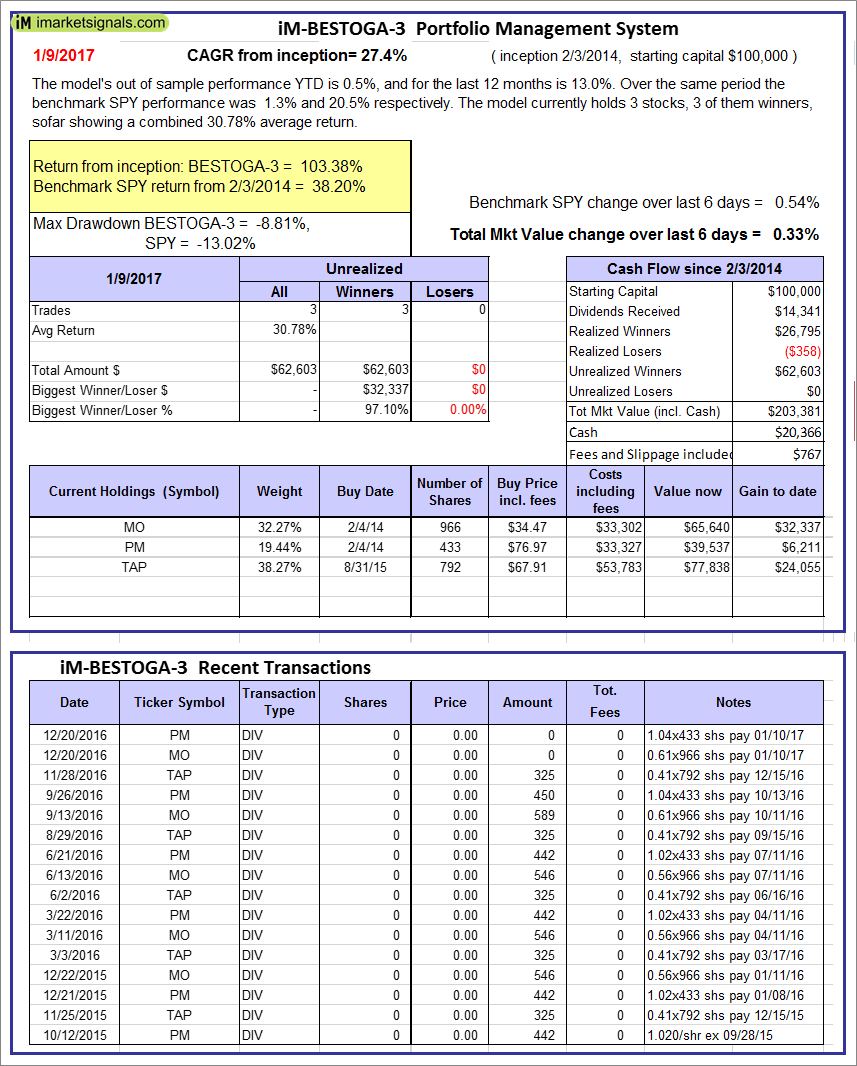 |
iM-BESTOGA-3: The model’s out of sample performance YTD is 0.5%, and for the last 12 months is 13.0%. Over the same period the benchmark SPY performance was 1.3% and 20.5% respectively. Over the previous week the market value of iM-BESTOGA-3 gained 0.33% at a time when SPY gained 0.54%. A starting capital of $100,000 at inception on 2/3/2014 would have grown to $203,381 which includes $20,366 cash and excludes $767 spent on fees and slippage. |
 |
iM-Best7(HiD-LoV): The model’s out of sample performance YTD is -0.4%, and since inception 2.3%. Over the same period the benchmark SPY performance was 1.3% and 9.3% respectively. Over the previous week the market value of iM-BESTOGA-3 gained -0.27% at a time when SPY gained 0.54%. A starting capital of $100,000 at inception on 2/3/2014 would have grown to $102,314 which includes -$31 cash and excludes $450 spent on fees and slippage. |
 |
iM-Best10(Short Russell3000): The model’s performance YTD is -0.4%, and for the last 12 months is -41.9%. Over the same period the benchmark SPY performance was 1.3% and 20.5% respectively. Over the previous week the market value of iM-Best10(Short Russell3000) gained 0.20% at a time when SPY gained 0.54%. Over the period 2/3/2014 to 1/9/2017 the starting capital of $100,000 would have grown to $8,516 which includes $14,368 cash and excludes $1,637 spent on fees and slippage. |
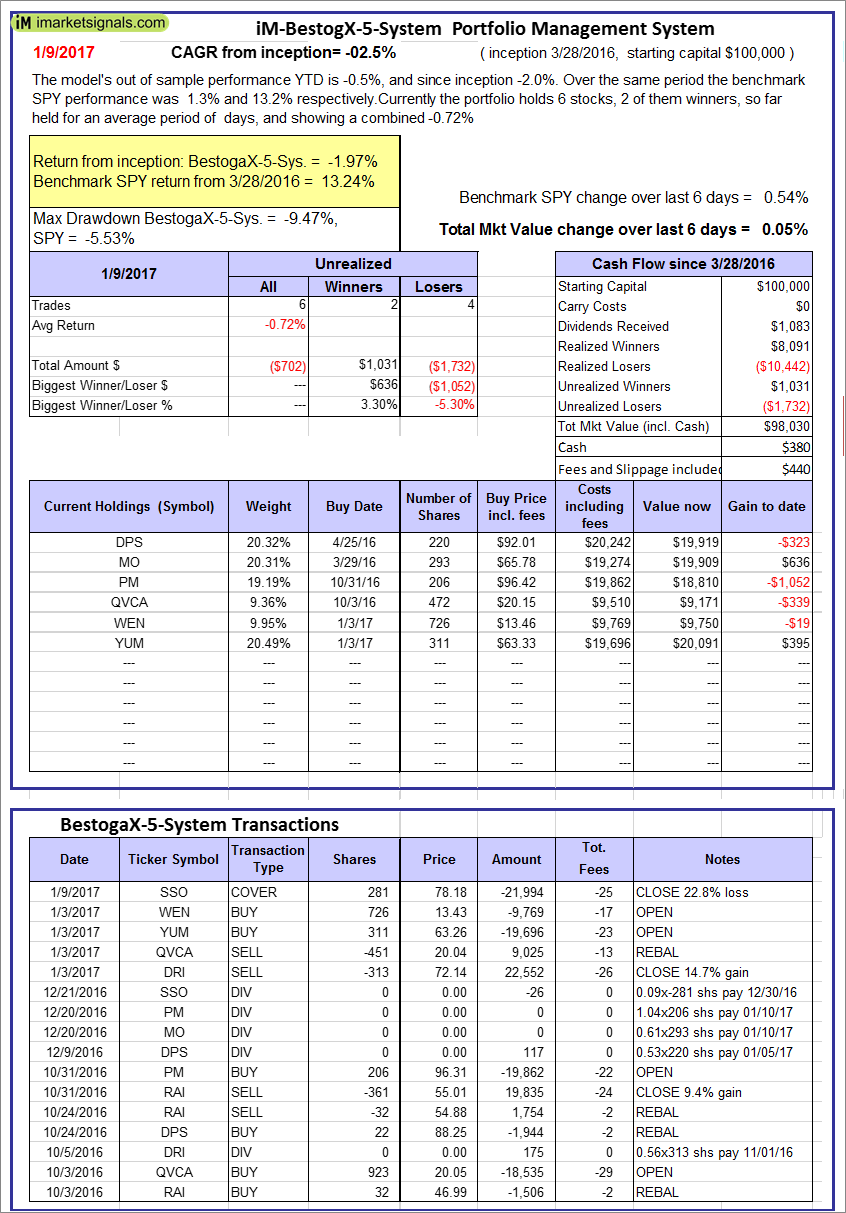 |
iM-BestogaX5-System: The model’s out of sample performance YTD is -0.5%, and since inception -2.0%. Over the same period the benchmark SPY performance was 1.3% and 13.2% respectively. Over the previous week the market value of iM-Best8(S&P 500)Tax-Eff. gained 0.05% at a time when SPY gained 0.54%. A starting capital of $100,000 at inception on 1/2/2009 would have grown to $98,030 which includes $380 cash and excludes $440 spent on fees and slippage. |
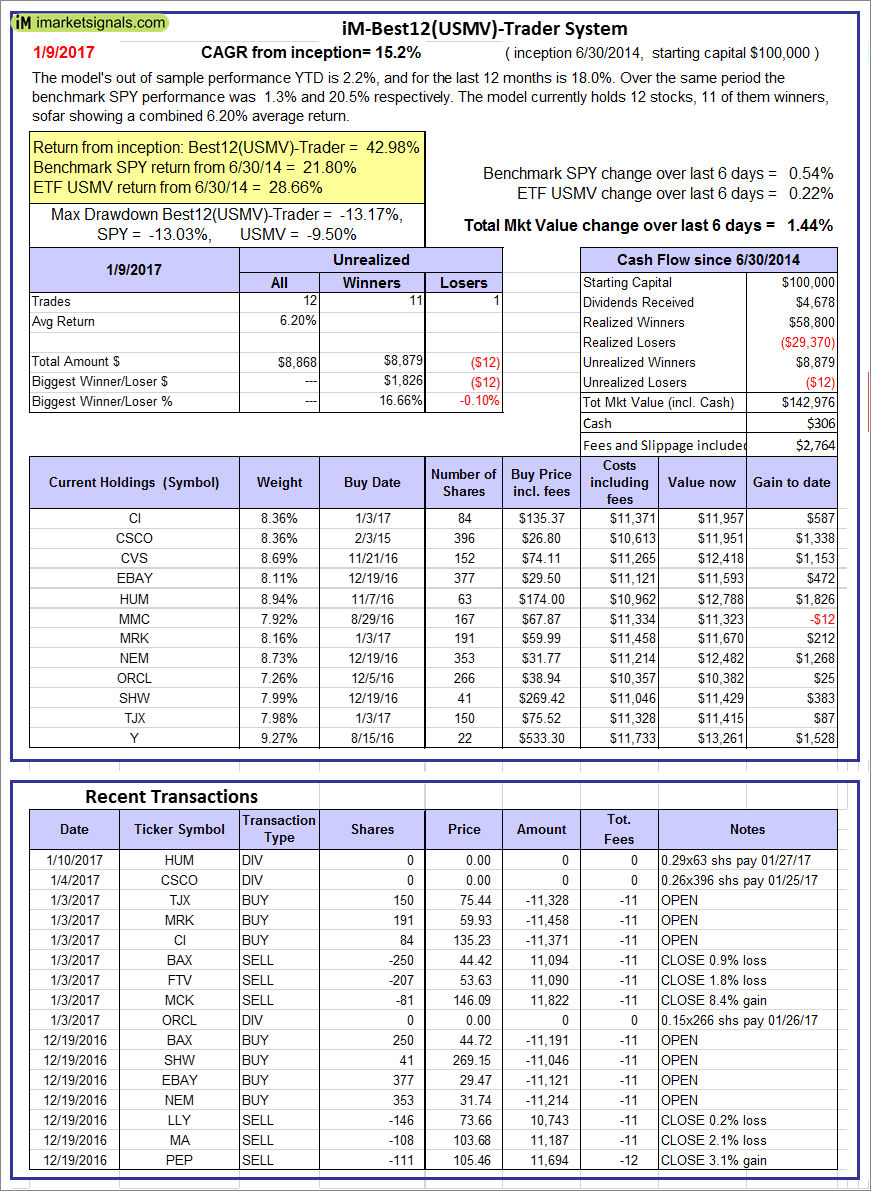  |
iM-Best12(USMV)-Trader: The model’s out of sample performance YTD is 2.2%, and for the last 12 months is 18.0%. Over the same period the benchmark SPY performance was 1.3% and 20.5% respectively. Since inception, on 7/1/2014, the model gained 42.98% while the benchmark SPY gained 21.80% and the ETF USMV gained 28.66% over the same period. Over the previous week the market value of iM-Best12(USMV)-Trader gained 1.44% at a time when SPY gained 0.54%. A starting capital of $100,000 at inception on 7/1/2014 would have grown to $142,976 which includes $306 cash and excludes $2,764 spent on fees and slippage. |
  |
iM-Best12(USMV)Q1-Investor: The model’s out of sample performance YTD is 1.4%, and for the last 12 months is 28.3%. Over the same period the benchmark SPY performance was 1.3% and 20.5% respectively. Since inception, on 1/5/2015, the model gained 27.61% while the benchmark SPY gained 17.05% and the ETF USMV gained 18.16% over the same period. Over the previous week the market value of iM-Best12(USMV)Q1 gained 0.83% at a time when SPY gained 0.54%. A starting capital of $100,000 at inception on 1/5/2015 would have grown to $127,611 which includes -$32 cash and excludes $620 spent on fees and slippage. |
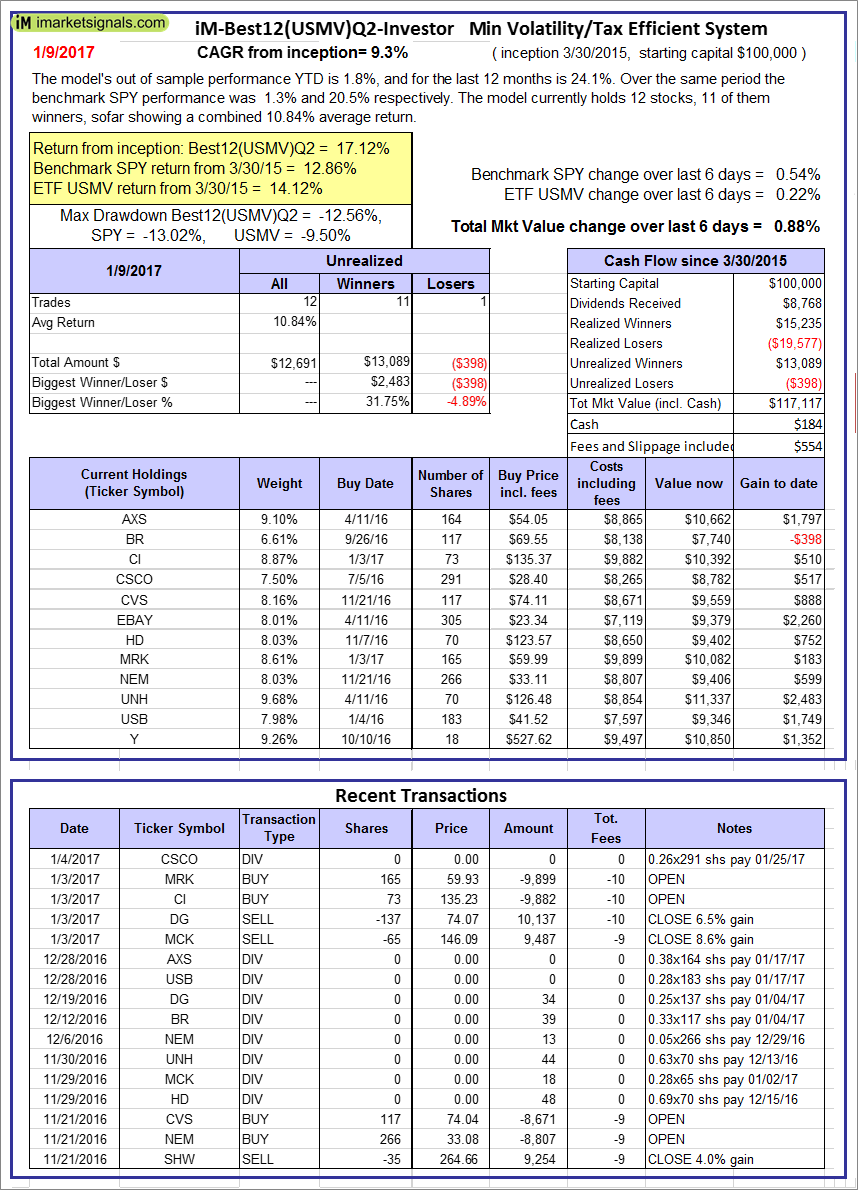 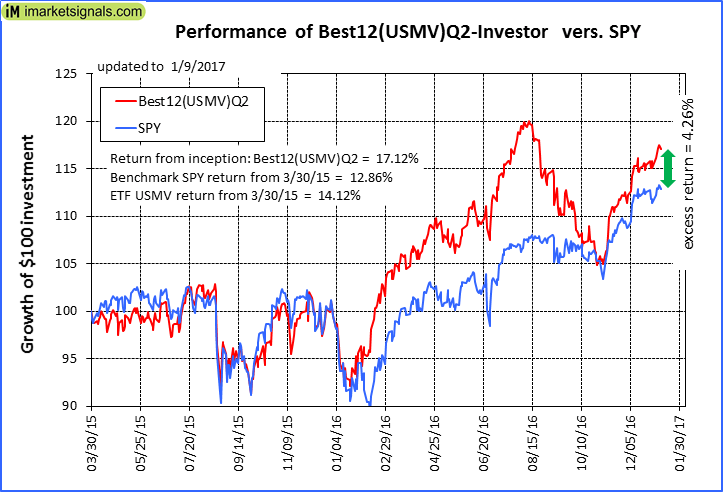 |
iM-Best12(USMV)Q2-Investor: The model’s out of sample performance YTD is 1.8%, and for the last 12 months is 24.1%. Over the same period the benchmark SPY performance was 1.3% and 20.5% respectively. Since inception, on 3/31/2015, the model gained 17.12% while the benchmark SPY gained 12.86% and the ETF USMV gained 14.12% over the same period. Over the previous week the market value of iM-Best12(USMV)Q2 gained 0.88% at a time when SPY gained 0.54%. A starting capital of $100,000 at inception on 3/31/2015 would have grown to $117,117 which includes $184 cash and excludes $554 spent on fees and slippage. |
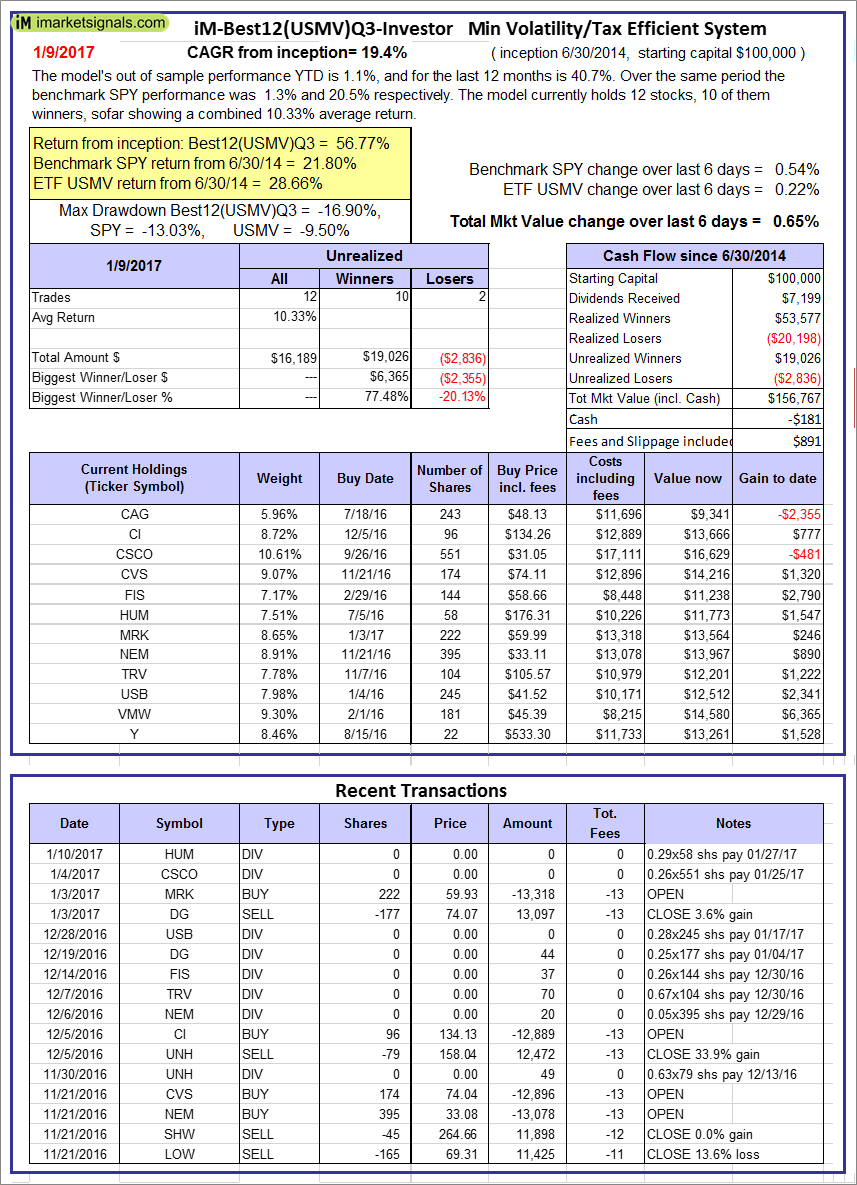 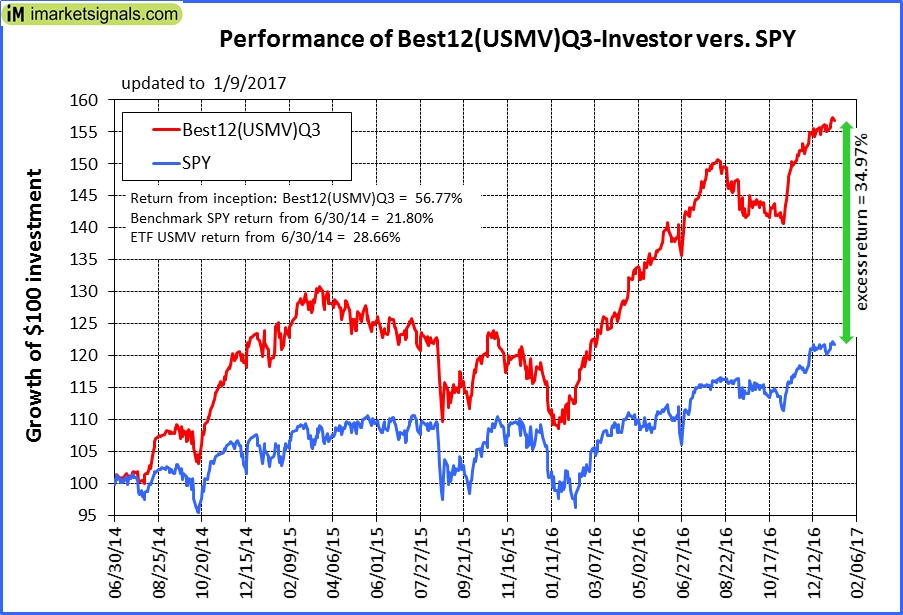 |
iM-Best12(USMV)Q3-Investor: The model’s out of sample performance YTD is 1.1%, and for the last 12 months is 40.7%. Over the same period the benchmark SPY performance was 1.3% and 20.5% respectively. Since inception, on 7/1/2014, the model gained 56.77% while the benchmark SPY gained 21.80% and the ETF USMV gained 28.66% over the same period. Over the previous week the market value of iM-Best12(USMV)Q3 gained 0.65% at a time when SPY gained 0.54%. A starting capital of $100,000 at inception on 7/1/2014 would have grown to $156,767 which includes -$181 cash and excludes $891 spent on fees and slippage. |
 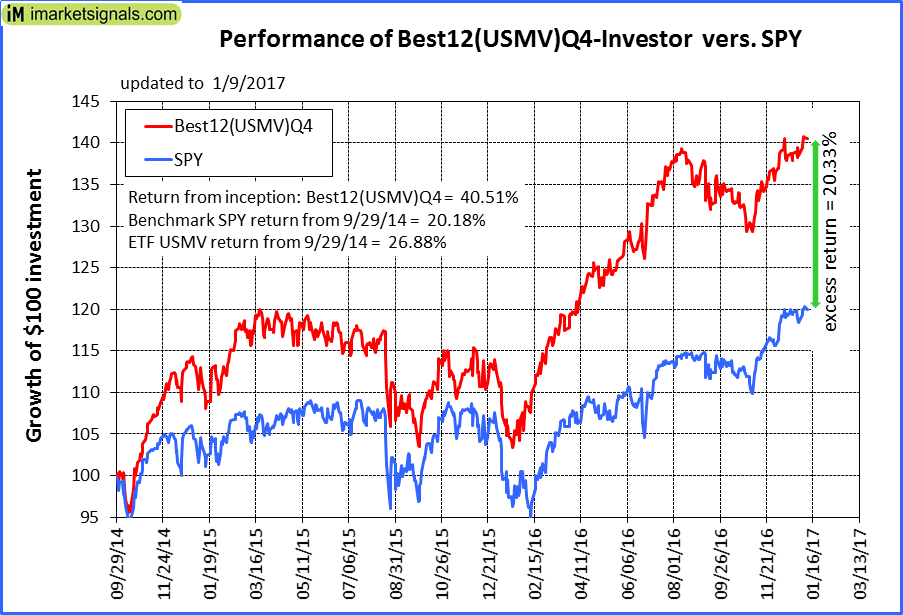 |
iM-Best12(USMV)Q4-Investor: Since inception, on 9/30/2014, the model gained 40.51% while the benchmark SPY gained 20.18% and the ETF USMV gained 26.88% over the same period. Over the previous week the market value of iM-Best12(USMV)Q4 gained 0.74% at a time when SPY gained 0.54%. A starting capital of $100,000 at inception on 9/30/2014 would have grown to $140,507 which includes $199 cash and excludes $755 spent on fees and slippage. |
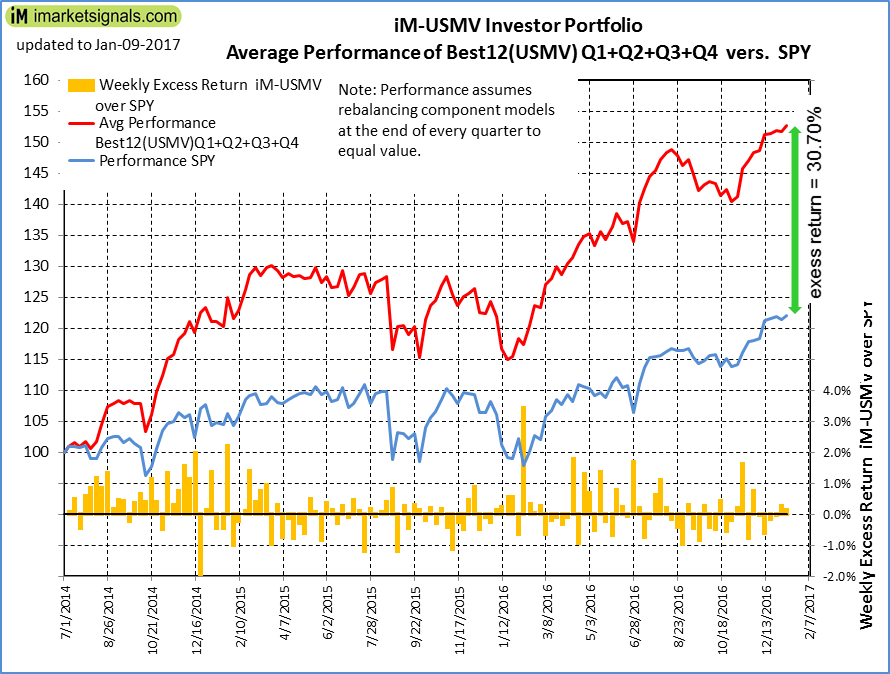 |
Average Performance of iM-Best12(USMV)Q1+Q2+Q3+Q4-Investor resulted in an excess return of 30.70% over SPY. (see iM-USMV Investor Portfolio) |
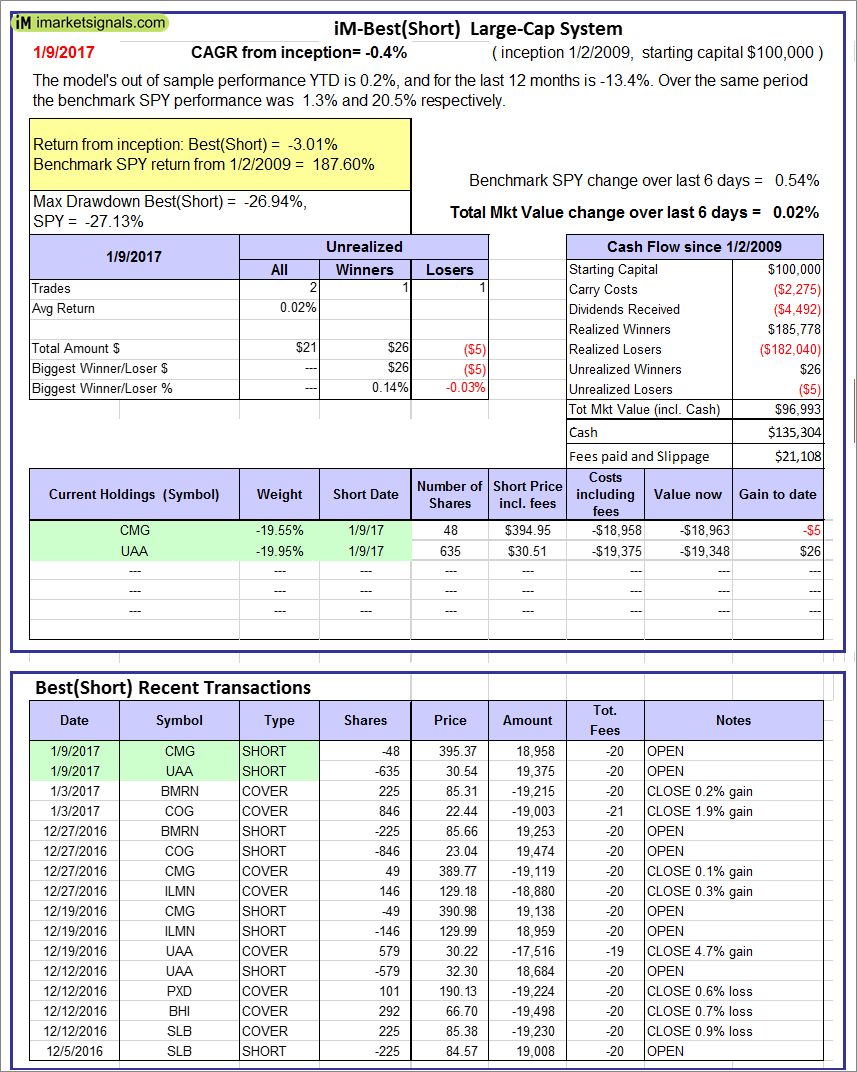 |
iM-Best(Short): The model’s out of sample performance YTD is 0.2%, and for the last 12 months is -13.4%. Over the same period the benchmark SPY performance was 1.3% and 20.5% respectively. Over the previous week the market value of iM-Best(Short) gained 0.02% at a time when SPY gained 0.54%. Over the period 1/2/2009 to 1/9/2017 the starting capital of $100,000 would have grown to $96,993 which includes $135,304 cash and excludes $21,108 spent on fees and slippage. |
iM-Best Reports – 1/9/2-17
Posted in pmp SPY-SH
Leave a Reply
You must be logged in to post a comment.