
Market Signals Summary:
The MAC-US model, iM-Low Frequency Timer and the “3-mo Hi-Lo Index of the S&P500” are invested in the markets. However, the S&P500 Coppock is out of the markets. The MAC-AU is invested in the markets. The recession indicators COMP and iM-BCIg do not signal a recession. The bond market model avoids high beta (long) bonds, and the yield curve is indeterminate. The gold Coppock model generated a new buy signal on 3/28/2019 and remains invested in gold, however the silver model is in cash. The iM-Gold Timer is in cash.The monthly iM-GT-Timer, which is based on Google trends, has switched to cash on November 1, 2018.
Stock-markets:
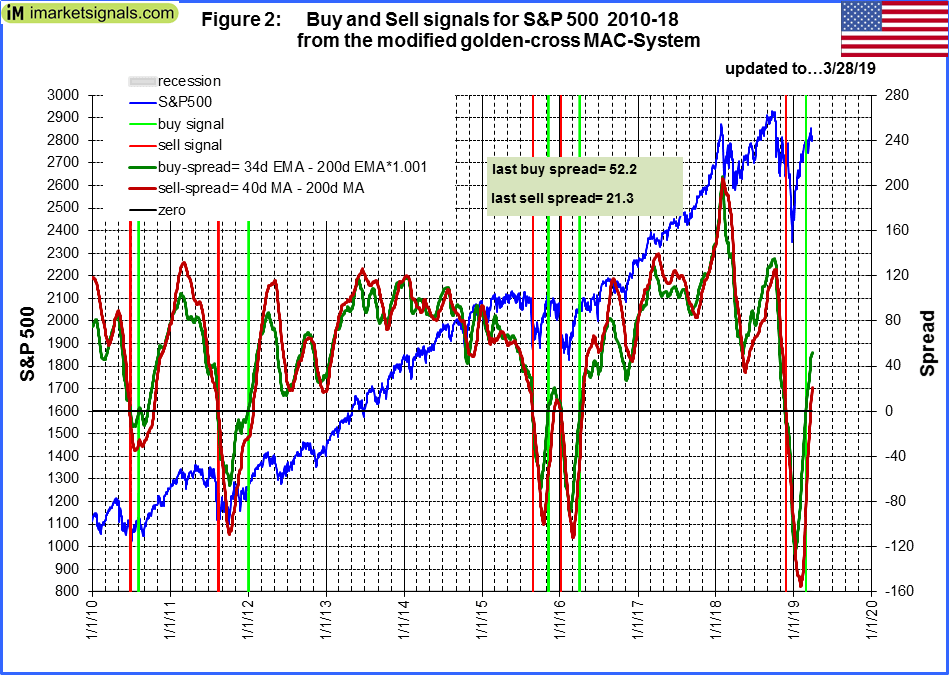 The MAC-US model switched into the markets on 2/26/2019. The sell-spread (red line) now above zero needs to move below zero to generate a sell signal.
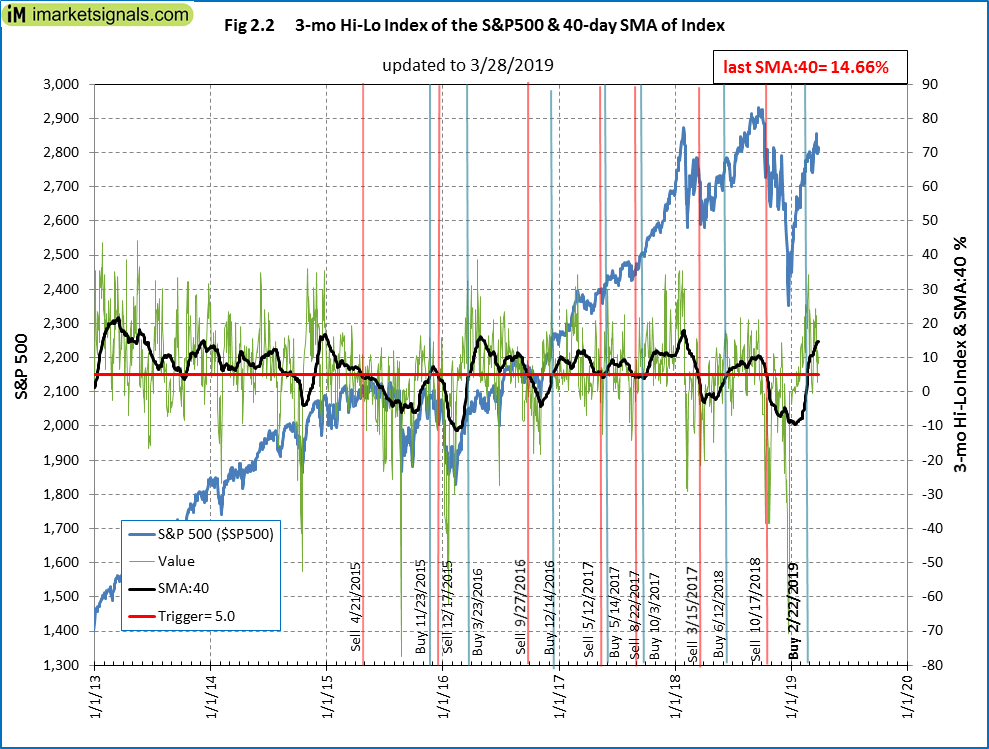 The 3-mo Hi-Lo Index of the S&P500 is above last week’s level at 14.66% (last week 13.72%), and is in the market since 2/27/2019.
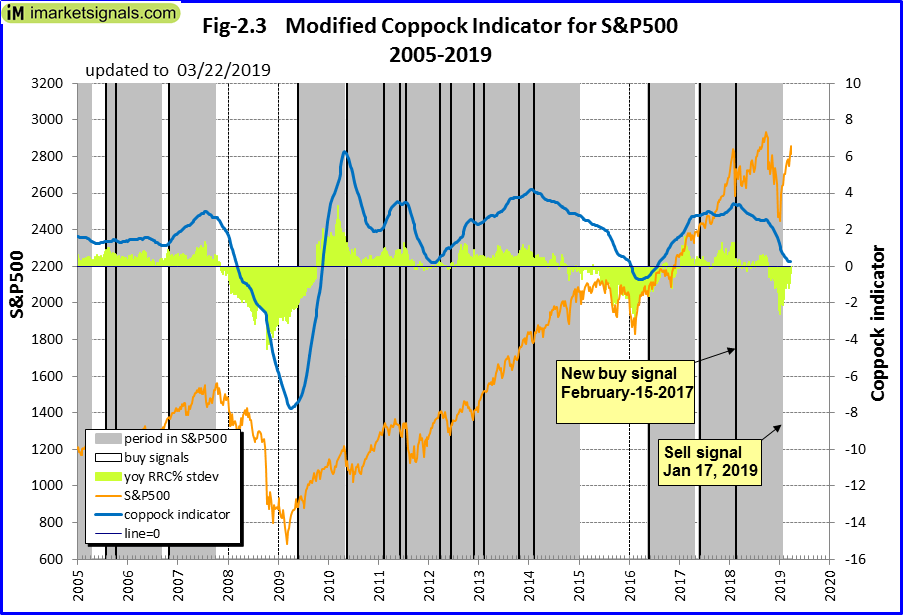 The Coppock indicator for the S&P500 exited the market on 1/29/2019 and is in cash. This indicator is described here.
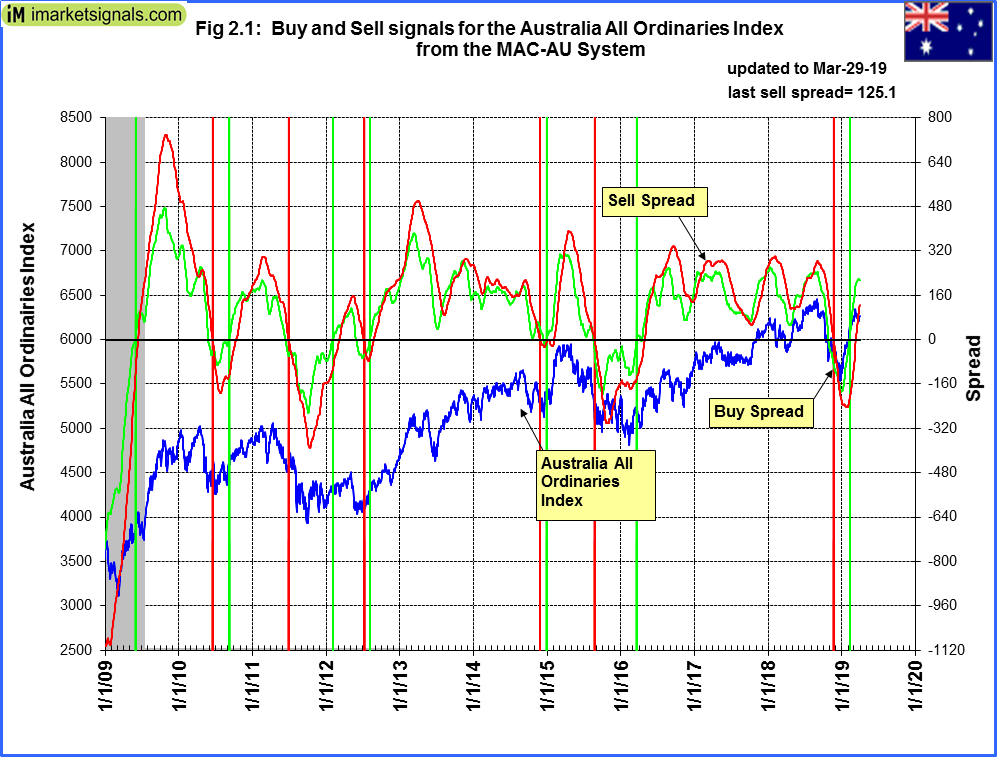 The MAC-AU model is invested in the markets after signaling a a buy on February 7, 2019. The sell-spread (red line) now above zero needs to move below zero to generate a sell signal.
This model and its application is described in MAC-Australia: A Moving Average Crossover System for Superannuation Asset Allocations.
Recession:
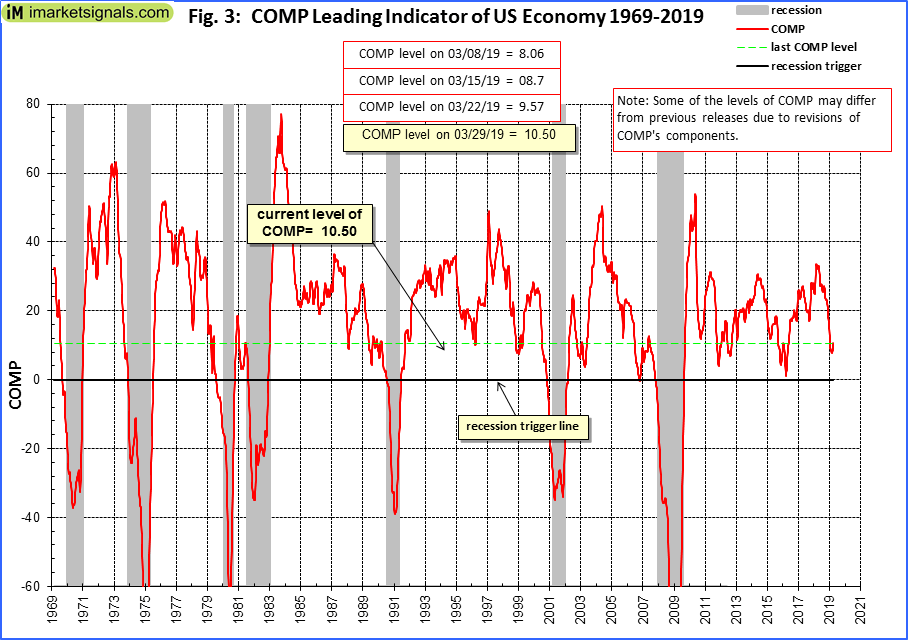 Figure 3 shows the COMP above last week’s levels . No recession is indicated. COMP can be used for stock market exit timing as discussed in this article The Use of Recession Indicators in Stock Market Timing.
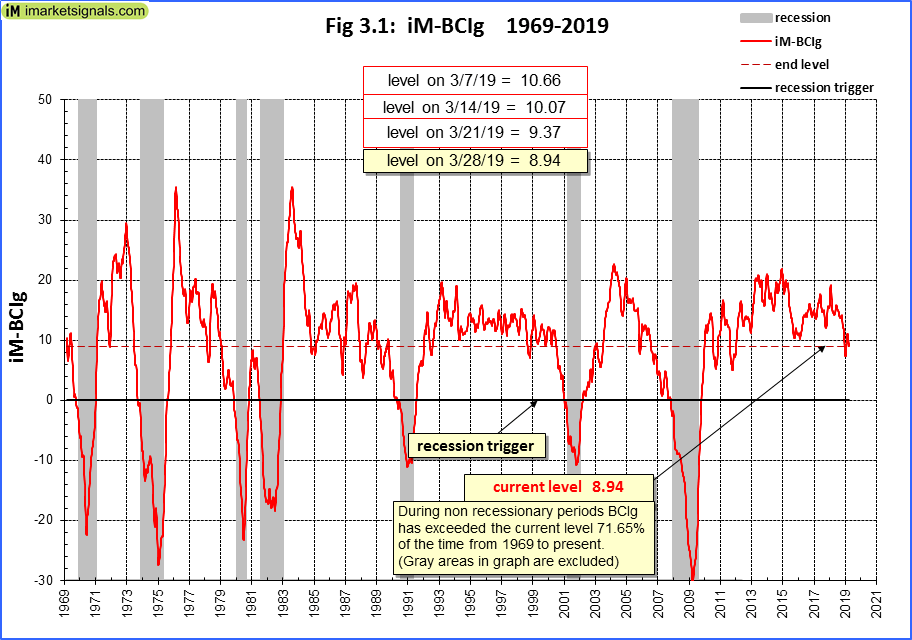 Figure 3.1 shows the recession indicator iM-BCIg below last week’s level. An imminent recession is not signaled .
Please also refer to the BCI page
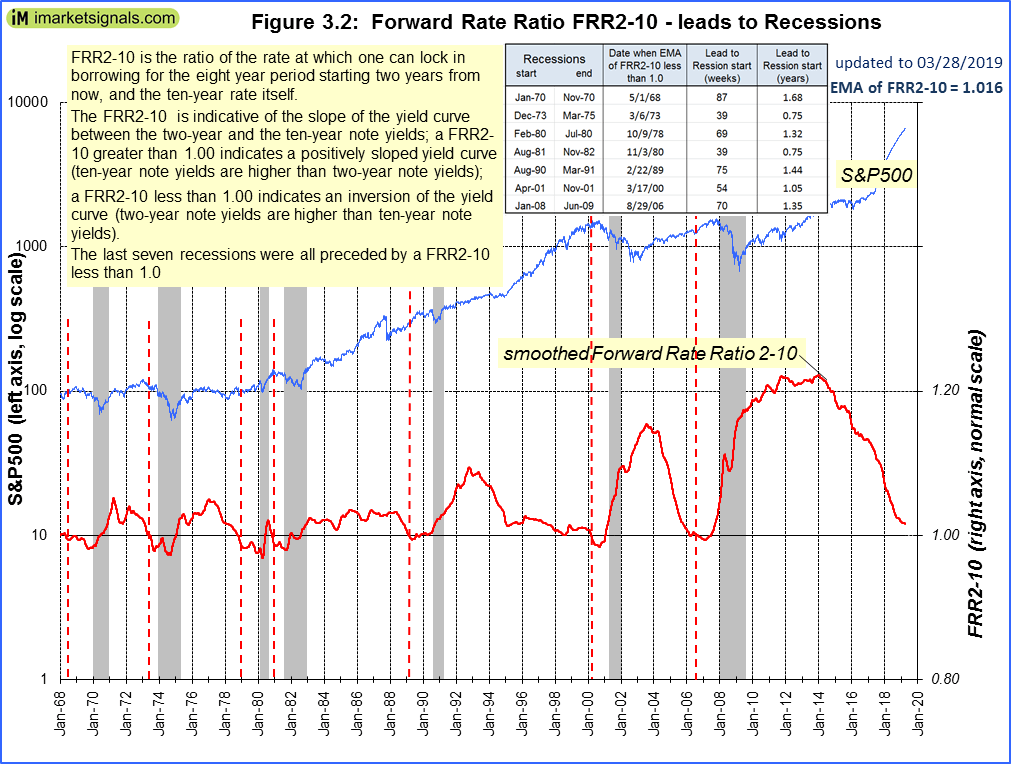 The Forward Rate Ratio between the 2-year and 10-year U.S. Treasury yields (FRR2-10) is near last week’s level and is not signaling a recession. The FRR2-10 general trend is downwards.
A description of this indicator can be found here.
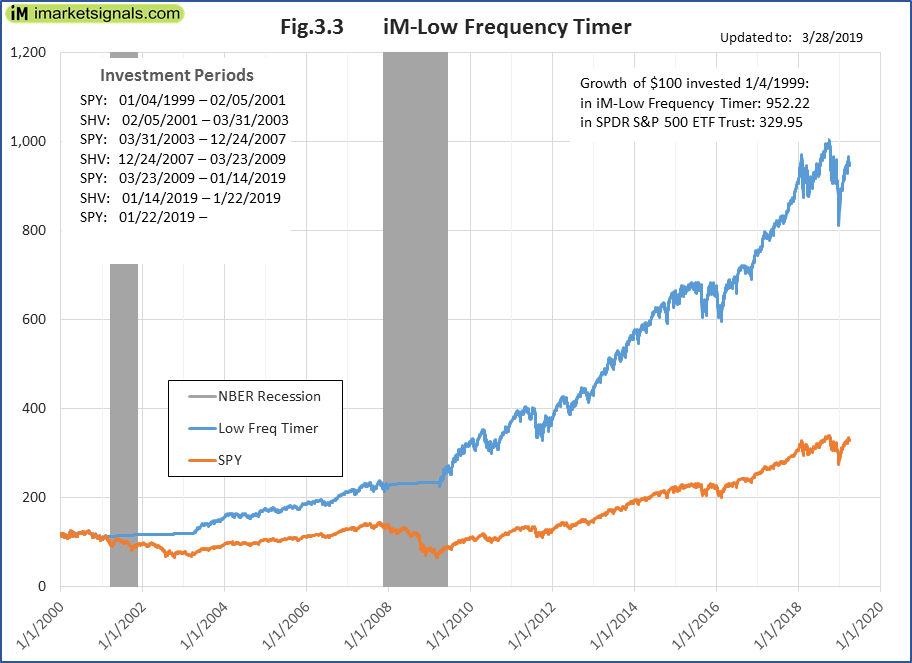 The iM-Low Frequency Timer is back in the markets since 1/22/2019.
A description of this indicator can be found here.
Leave a Reply
You must be logged in to post a comment.