- This market timing model integrates the iM-Standard Market Timer and the iM-Composite Market Timer.
- This model switches between ETFs SH and RSP providing signals when to be short or long the stock market.
- The model does not utilize Bond ETFs, and is therefore not directly affected by the potential risk of rising interest rates.
- From 2001 to 2016 switching between SH and RSP provided significant benefits. This strategy would have produced an average annual return of 26.2% versus only 8.5% for buy&hold RSP.
A composite market timing model, using many uncorrelated strategies, should be more advantageous than using a single strategy. This was introduced in our iM-Composite Market Timer. We now combined this composite strategy with our iM-Standard Market Timer in this new iM-(SH-RSP) Timer for a low turnover model that switches between ETFs SH and RSP, providing signals when to be short or long the stock market. Additionally, when this model is short (holding SH) it provides a good hedging signal.
Performance of the iM-(SH-RSP) Timer
The model was backtested using the on-line portfolio simulation platform Portfolio 123, which also provides extended price data for ETFs prior to their inception dates calculated from their proxies.
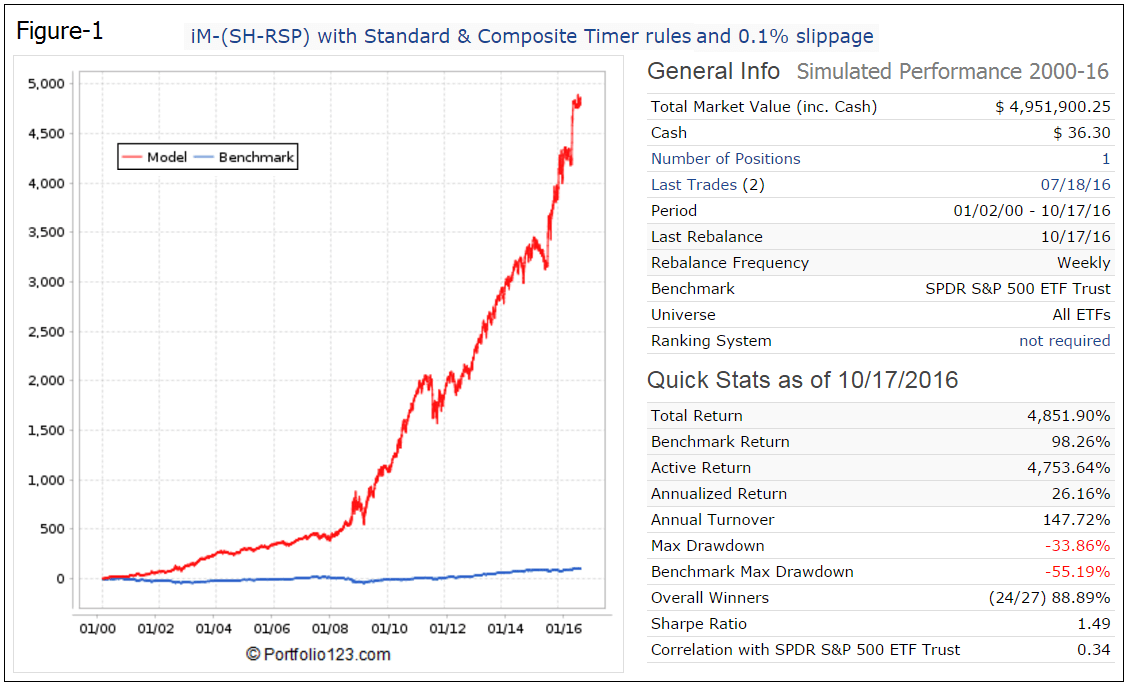
For the period 2001 to 2016, a backtest verified the performance of this timer. The P123 backtest elected either the ProShares Short S&P500 (SH). or the Guggenheim S&P 500 Equal Weight ETF (RSP). The P123 backtest performance is shown in Figure-1, giving an average annual return of 26.2% with a maximum drawdown of -34%. In the figure the red graph represents the performance of the model.
Transaction slippage and brokerage fees were assumed to be 0.1% of each trade amount. The model is rebalanced weekly, but portfolio turnover is low, about 1.5-times a year on average. There were only 26 realized trades of which 24 were winners. (See the Appendix for realized transactions.)
Hedging
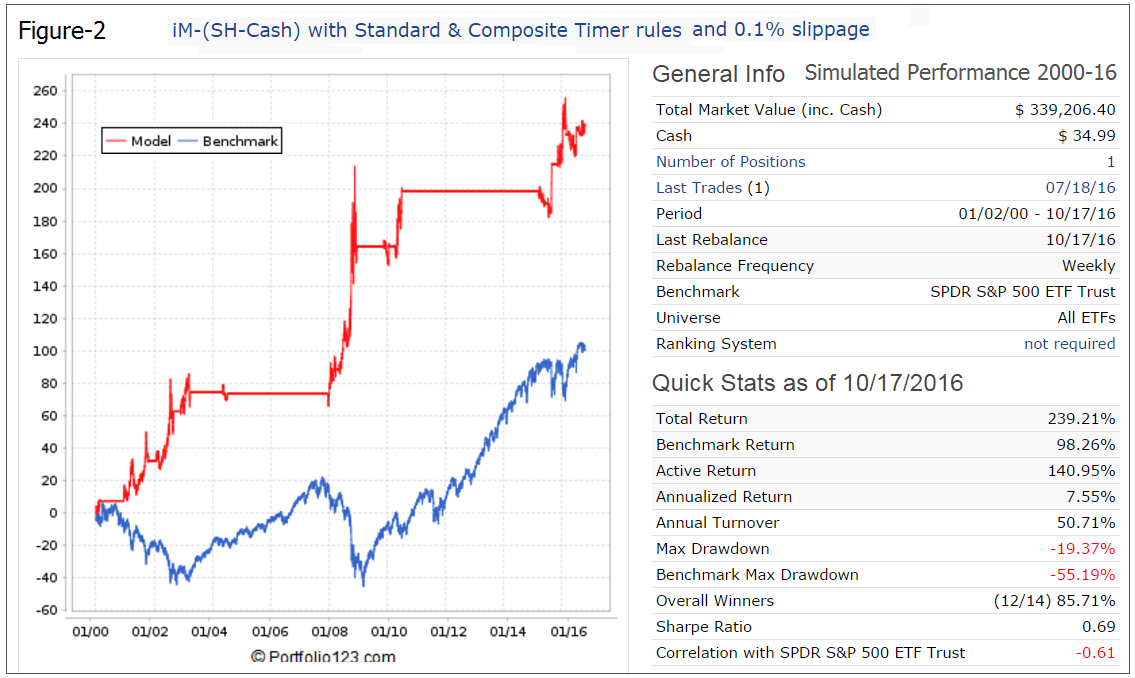
This model could be useful for hedging stock portfolios. When the model holds SH then the hedge is on. Figure-2 shows performance when switching between SH and Cash instead of RSP, the horizontal portions of the graph indicating when the model was in Cash.
There were 14 periods when the model was invested in SH (including the current period since 7/18/2016), with 2 periods showing small losses of -2.35% and -0.51%.
Conclusion
From 2001 to 2016 the buy & hold strategy no longer worked, and it is unlikely to work in the future as well, due to stock market volatility increasing. From the analysis it appears that the iM-(SH-RSP) Timer model could profitably be used as a market timer.
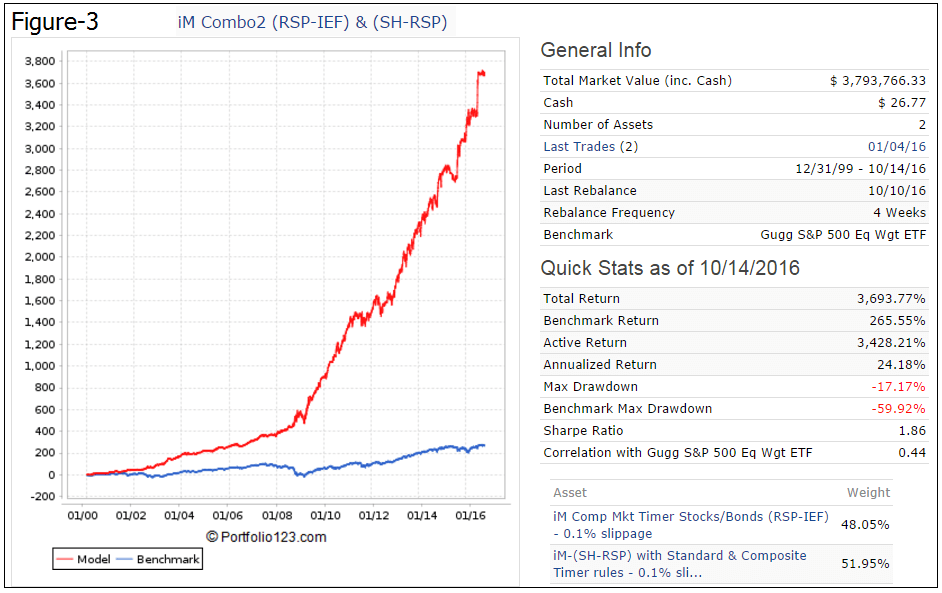
This model is independent of bond market performance because it solely uses stock market related ETFs. However, the high maximum drawdown of -34% early in 2009 is of concern. This can be alleviated by combining this model with the iM-Composite Market Timer. The simulated performance of this combination is shown in Figure-3 in the Appendix. Maximum drawdown is -17% and average annual return is 24.2%.
One can follow the iM-(SH-RSP) Timer at iMarketSignals.com, where it is updated weekly.
Appendix
Realized Transactions of iM-(SH-RSP) Timer:
|
Symbol |
Open |
Close |
Days held |
Pct Return |
|
RSP |
06/27/16 |
07/18/16 |
21 |
9.17% |
|
SH |
03/21/16 |
06/27/16 |
98 |
1.28% |
|
RSP |
02/22/16 |
03/21/16 |
28 |
6.87% |
|
SH |
11/02/15 |
02/22/16 |
112 |
5.75% |
|
RSP |
08/24/15 |
11/02/15 |
70 |
8.51% |
|
SH |
07/06/15 |
08/24/15 |
49 |
8.25% |
|
RSP |
06/01/15 |
07/06/15 |
35 |
-2.86% |
|
SH |
03/16/15 |
06/01/15 |
77 |
-2.35% |
|
RSP |
07/06/10 |
03/16/15 |
1714 |
115.88% |
|
SH |
04/05/10 |
07/06/10 |
92 |
12.78% |
|
RSP |
01/25/10 |
04/05/10 |
70 |
10.87% |
|
SH |
11/16/09 |
01/25/10 |
70 |
0.12% |
|
RSP |
12/15/08 |
11/16/09 |
336 |
46.52% |
|
SH |
05/05/08 |
12/15/08 |
224 |
39.37% |
|
RSP |
03/31/08 |
05/05/08 |
35 |
7.53% |
|
SH |
12/17/07 |
03/31/08 |
105 |
7.51% |
|
RSP |
07/06/04 |
12/17/07 |
1259 |
34.83% |
|
SH |
05/03/04 |
07/06/04 |
64 |
-0.51% |
|
RSP |
03/31/03 |
05/03/04 |
399 |
47.99% |
|
SH |
11/25/02 |
03/31/03 |
126 |
7.27% |
|
RSP |
09/03/02 |
11/25/02 |
83 |
8.48% |
|
SH |
01/28/02 |
09/03/02 |
218 |
22.96% |
|
RSP |
10/22/01 |
01/28/02 |
98 |
9.25% |
|
SH |
12/11/00 |
10/22/01 |
315 |
23.07% |
|
RSP |
02/22/00 |
12/11/00 |
293 |
18.07% |
|
SH |
01/03/00 |
02/22/00 |
50 |
7.15% |
Disclaimer:
One should be aware that all results shown for the iM-(SH-RSP) Timer are from a simulation and not from actual trading.
All information for this model is back-tested, based on the methodology that was in effect on the launch date. Back-tested performance, which is hypothetical and not actual performance, is subject to inherent limitations because it reflects application of a methodology and selection criteria in hindsight. Actual returns may differ from, and be lower than, back-tested returns.
All results are presented for informational and educational purposes only and shall not be construed as advice to invest in any assets. Backtesting results should be interpreted in light of differences between simulated performance and actual trading, and an understanding that past performance is no guarantee of future results. All investors should make investment choices based upon their own analysis of the asset, its expected returns and risks, or consult a financial adviser.


Georg,
I like the simplicity of this model. it does rely on the market timers, hopefully those continue to be great signals of market direction.
with the trend undeniably in favor of more and more assets into index funds.. I actually think a system like this, might return higher in future. if you can get the “shorting” right.
might be better choices than SH.
Georg,
can you re-run this with QLD in place of RSP?
We have historic data for QLD from 6/21/06. So we can do a 10.33 year simulation for (SH-QLD). Annualized return 54%, max D/D= -37%
Quick Stats as of 10/22/2016
Total Return 8,645.71%
Benchmark Return 128.95%
Active Return 8,516.76%
Annualized Return 54.13%
Annual Turnover 153.44%
Max Drawdown -36.67%
Benchmark RSP Max Drawdown -59.92%
Overall Winners (16/18) 88.89%
Sharpe Ratio 1.62
Correlation with Gugg S&P 500 Eq Wgt ETF 0.56
Thanks for re-running, That’s stunning. is this 37% max DD with composite timer?
It is Market Timing with ETFs SH and QLD: Using the iM-Composite & Standard Market Timers’ Rules. This is from a simulation, backtest results are no guarantee of future returns.
Georg,
It appears this model’s strength is hedging,unless I am missing the point. You have presented many quality hedging ideas. Is someone wants to hedge a portfolio of stocks or etf s what do you feel may be some of your best ideas and why? Which model to follow and by how much? Which method ie, short SSO 50% long portfolio, short SPY 100%, sell 25% and purchase SPXU, sell 33% and purchase SDS?
Perhaps hedging when component models of Combo2-(RSP-IEF) & (SH-RSP) point to IEF and SH could be advantageous. The type of hedge and hedge ratio is for the investor to decide.
When will you start to supply the iM-(SH-RSP) Timer signals? I see the Standard Timer is “Hedge Off’. I see the Composite Timer is in IEF. How do I put the two together to get a signal for RSP-SH?
The iM-(SH-RSP) Timer signals will be included in our usual Sunday updates, starting Oct-30.
It is my understanding that IMCombo 2 is 50% in Composite Timing and 50% in the new IM (SH-RSP).
It is also my understanding that the IM (SH-RSP) basically invests in RSP rather than cash in the standard IM Standard Market Timer.
Curious why the investment dates are different for the IM (SH-RSP) vs Standard Market Timer.
You did mention some rules using Compsite Market Timer for new (SH-RSP), but, not real clear what those new rules are.
In your brief on IM Standard Market Timing and IM Composite Market Timing, you were very clear on the details as to when change occurs.
Thanks for clarifying.
Jeff
Reason that investment dates are different is that we employed a combination of the original Standard Timer rules and the Composite Timer rules.
Hi Georg and Anton:
This new SH-RSP and the Combo2 timing models and strategy are very creative. I am considering using them. Couple ?’s please:
*Can the backtests for both the new SH-RSP timing system and the new Combo2 (RSP-
IEF)&(SH-RSP) be conducted further back in time using a proxy for SH and/or RSP?
*Could you please present more data from the backtests for both new timing systems
similar to your other strategies: Annual returns; Sortino ratios; standard deviation;
rolling returns; and especially max drawdowns by year
*Could you please backtest the SH-QLD with Combo2 to see the effect on CAGR/MaxDD?
*Combo2: The current weighting for the Composite Timer is 48%; for the new SH-RSP
52%. Will this ever change or is it permanent?
*Any thoughts about using TIPS instead of IEF in the Composite Market Timer now that inflation is creeping up??
Lots to ask but really like the simplicity and potential effectiveness of these timing systems and strategies; need to know more about them. Many thanks
Vman
IEF: rate increase
Here are some replies until we can get to the others:
The backtests for both the new SH-RSP timing system and the new Combo2 (RSP-
IEF)&(SH-RSP) can not be conducted further back in time than Jan-2000 on the P123 platform.
Combo2: The nominal weighting for the Composite Timer is 50%; for the new SH-RSP
50%. The combo is rebalanced every 4 weeks if the percentage weight differences get larger.
TIPS can be used instead of IEF, there is not much difference in simulated performance.
Georg
Great; many thanks…….looking forward to the balance of your data.
Vman
Georg,
Why RSP rather than SPY or VTI? I understand the weighting issue, but can you post the returns when using SPY and/or VTI for comparison?
Thanks,
(SH-SPY) with Standard & Composite Timer rules and 0.1% slippage
Period 01/02/00 – 11/04/16
Benchmark SPDR S&P 500 ETF Trust
Quick Stats as of 11/4/2016
Total Return 2,792.28%
Benchmark Return 94.22%
Active Return 2,698.06%
Annualized Return 22.12%
Annual Turnover 148.10%
Max Drawdown -33.99%
Benchmark Max Drawdown -55.19%
Overall Winners (24/27) 88.89%
Sharpe Ratio 1.37
Correlation with SPDR S&P 500 ETF Trust 0.29
Hi Georg and Anton,
I’m curious what the correlation figures are like for these new ETF trading models (SH-RSP and Composite Timer) compared to the component models of the Combo5?
Do you view them as replacing the older models like SPY-SH and SSO-Bond since the timing rules seem to be a little more complex and advanced? Or does running them alongside the Combo5 ETF models result in better performance figures overall?
My sense would be that as long as every additional model to a Combo book is slightly uncorrelated to the others, then it should improve the Sharpe ratio and risk measures, correct? I suppose the cost of doing this is eventually you have a portfolio that becomes quite complex to manage if you have a dozen or more models running side by side…
Thanks for your input,
Ryne
Correlation of Composite Market Timer (SPY-IEF) with the 5 component models of Combo5 ranges from 0.18 to 0.47.
Correlation of ETF Timer (SH-RSP) with the component models of Combo5 ranges from 0.34 to 0.61.
The simulated performance of a combo of all 7 models is:
Period 12/31/99 – 11/03/16
Benchmark SPDR S&P 500 ETF Trust
Total Return 3,136.38%
Benchmark Return 94.22%
Active Return 3,042.16%
Annualized Return 22.93%
Max Drawdown -8.68%
Benchmark Max Drawdown -55.19%
Sharpe Ratio 1.98
Correlation with SPDR S&P 500 ETF Trust 0.41
Georg and Anton
Sorry but I have to ask what would simulation of Combo 6, Composite market timer SPY-IEF, and SH-RSP look like?
Simulated performance from Jan-2000
Combo5+Bestoga3+CompMktTimer+(SH-RSP)Timer
Number of Assets 8
Period 12/31/99 – 11/04/16
Benchmark SPDR S&P 500 ETF Trust
Quick Stats as of 11/4/2016
Total Return 3,119.99%
Benchmark Return 94.01%
Active Return 3,025.98%
Annualized Return 22.89%
Max Drawdown -8.22%
Benchmark Max Drawdown -55.19%
Sharpe Ratio 2.04
Correlation with SPDR S&P 500 ETF Trust 0.44
2000 … 16.64%
2001 … 12.73%
2002 … 24.52%
2003 … 35.18%
2004 … 19.04%
2005 … 9.63%
2006 … 18.80%
2007 … 19.84%
2008 … 39.48%
2009 … 48.53%
2010 … 34.44%
2011 … 16.96%
2012 … 18.00%
2013 … 36.03%
2014 … 21.91%
2015 … 14.88%
2016** … 8.36%
Hi Georg –
Is there a plan to come up with new Combos?
The Combo5 did not come even close to its benchmark performance AND it also did only 10% of the back-tested performance (2% annual return in 2016 vs. 20% plus back-tested).
Even when combined with Bestoga 3 for a Combo 6, the performance still lagged significantly from back-tests and against the S&P 500.
Most of your market timers were showing being long and in the market, but Combo5 stayed underinvested in the market and overinvested in IEF throughout 2016.
I noticed all of the Best12(USMV)- Q1-Q4-Investor models did well in 2016. I don’t know what the drawdowns were. Is there a way for you to back-test a new Combo by putting in say Best12(USMV)- Q3-Investor at 25% and 75% in Combo6 for a new Combo7b? If the CAGR and drawdown improve, then you could publish this new combo or at least by providing the backtest, you could enable us to make an informed decision of how to invest in 2017.
It was quite frustrating to get less than 3% returns in a year like 2016 with Combo6 even though the drawdown was very small. :-)
I know you cannot provide investment advice. But I was wondering if you could comment on how you are investing in your personal accounts? I am assuming you utilize some of the signals in the subscription to manage your own money.
Thanks for all the good work. Look forward to a better 2017.
Regards,
RV
RV,
All models can underperform for a while. Backtest performance is not a guarantee of future performance. As you pointed out correctly the component models of Combo5 were holding IEF for long periods in 2016 which resulted in no gain since the combo went live in Feb 2016.
Also the Bestoga3 stocks did not match the performance of SPY. Therefore the combination Combo5 and Bestoga3 prduced disappointing results.
The Best12(USMV) models have been live since July 2014 and they cannot be backtested from an earlier date because they take their stock holdings from the ETF USMV. There is no historic information on the holdings of USMV available.
Obviously I use the signals from the various models for my own investment decisions.
Best,
Georg
What is this timer called? I’m not seeing it on the updates page
We don’t feature Combo5+Bestoga3+CompMktTimer+(SH-RSP)Timer
Georg, Would you test hedging when both component models of Combo2-(RSP-IEF) & (SH-RSP) point to IEF and SH with a SH-Cash model? Thanks
One could do this for another long only model, not for this combo.
Hi Georg and Anton
Is there any benefit to using RSP vs SPY for this strategy? (I don’t see any….)
Good luck,
Vman
RSP gives better returns.
It looks like the standard and composite timers are only backtested to 2000. Can you construct a similar model that can be backtested to 1950?
No, this is not possible because the database is not available going so far back.
Only the MAC-US Timer, CAPE-Cycle-ID, and Inflation Timer were backtested for longer periods.
Hello, for UPRO/SPXU, would it be better to use this as the timer or SPY-SH?
That is, between the timers iM-Standard Market Timer and the iM-Composite Market Timer, which one would be a better timer to use for UPRO/SPXU?
Max Drawdown becomes too large with UPRO/SPXU.
Composite Market Timer (UPRO-SPXU)
Period 01/02/00 – 03/26/18
Annualized Return 35.33%
Annual Turnover 397.12%
Max Drawdown -69.67%
Overall Winners (51/71) 71.83%
Sharpe Ratio 0.83
Composite(UPRO-SPXU)Timer with Standard & Composite Timer rules
Period 01/02/00 – 03/26/18
Annualized Return 42.27%
Annual Turnover 151.43%
Max Drawdown -79.31%
Overall Winners (25/31) 80.65%
Sharpe Ratio 0.99
Georg,
Can you post yearly returns for this model, or better yet, a yearly breakdown for the iM Combo2?
Calendar year returns for RSP-SH
Return (%)
2000 … 32.01
2001 … 29.75
2002 … 39.53
2003 … 49.15
2004 … 14.21
2005 … 7.26
2006 … 15.55
2007 … -1.50
2008 … 75.86
2009 … 38.84
2010 … 60.76
2011 … -0.66
2012 … 16.72
2013 … 34.10
2014 … 13.45
2015 … 16.00
2016 … 32.16
2017 … 19.05
2018 … -7.82
2019 … 14.55
What if you combined 1/3 SH-RSP, 1/3 SPY-IEF Composite Timer, and 1/3 Low Frequency Timer – with the Low Freq Term Timer going to SH during the two down periods?
Can you run this updated to latest date? And then can you run this with RSP and cash? Also RSP and IEF?
Thank you.
For this model, when do you switch and buy SH? Is it based on when the Standard Market Timer goes to Hedge Off or when the Composite Market Timer combined weight is less than 50?
The switching rules are quite complex.
Please refer to the model description.
https://imarketsignals.com/2016/market-timing-with-etfs-sh-and-rs/
Clarification on last trade date:
on home page above the box of all trades it says ‘no trades since 11/7/16’
in box with all trades, it shows trades dated 11/7/17
Which is correct?
Thanks
Last trade:
11/7/2016 sell SH and buy RSP