
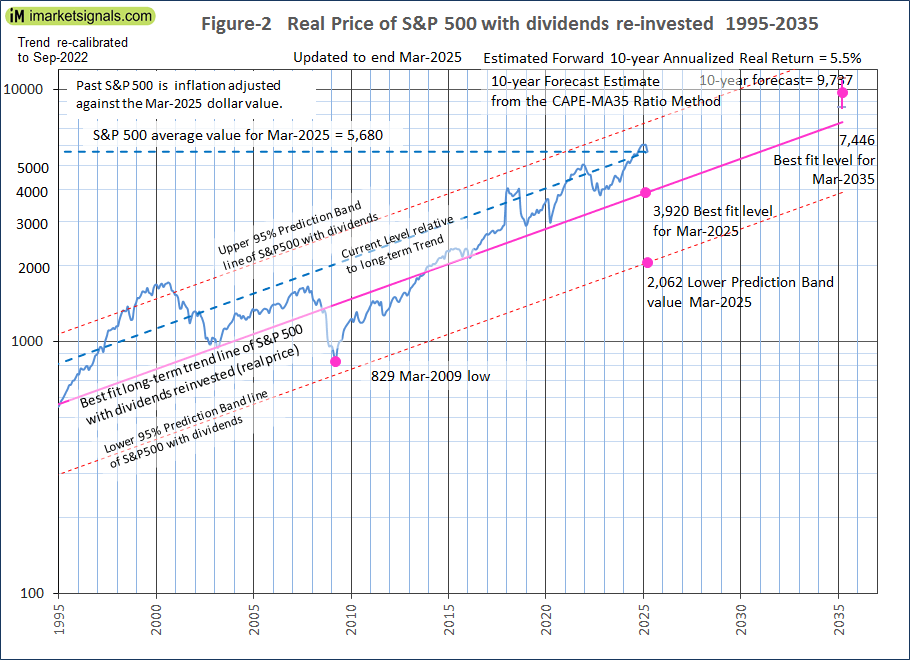
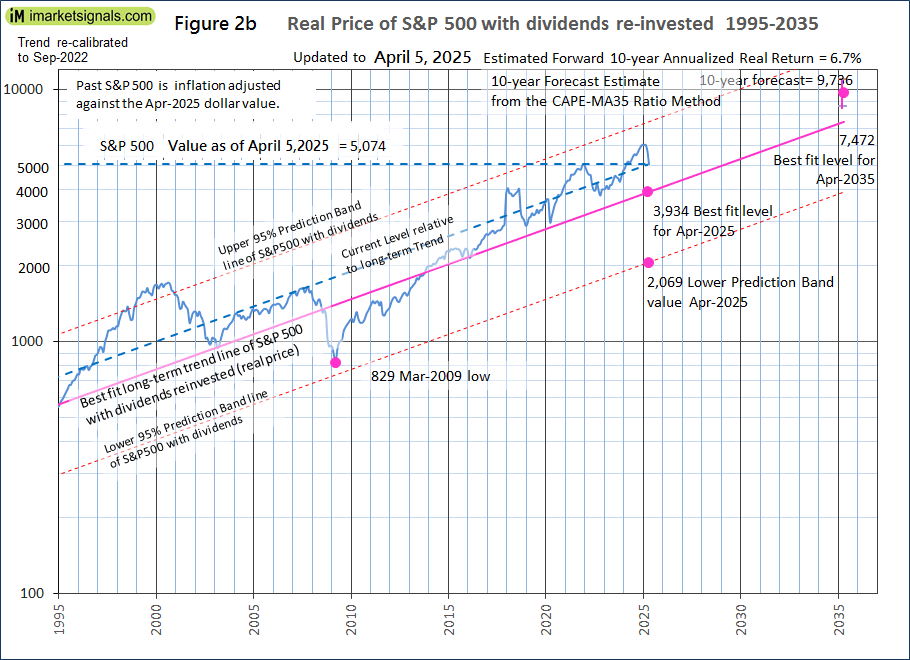
- The average of S&P 500 for March 2025 was 5,680, declining to 5,074 by April 4, 2025 (now 13% up from Jul-2023 average of 4,497 when forward returns for stocks “looked reasonably good” according to this analysis).
- The S&P 500 is still 1,140 points higher than the corresponding long-term trend value of 3,934 for April 2025.
- For the S&P 500 to reach the corresponding long-trend value would entail a 22% decline from the April 4, 2025 value, indicating that the S&P 500 is still considerably overvalued.
- Assuming that the current S&P 500 value remains unchanged until the end of April, then the CAPE-ratio would be 31.0, 15% higher than its 35-year moving average (MA35), currently at 26.9.
- The long-term trend indicates a forward 10-year annualized real return of 4.0%, while the CAPE-MA35 methodology derived 10-year annualized real return is better at about 6.7%.
This analysis highlights the overvaluation of the S&P 500 as of April 5, 2025 despite the recent losses due to the tariff event initiated by President Trump. It is an update to our series of articles started in 2012 assessing market valuation and estimating forward stock market returns. The most recent previous update was for December 2024 which indicate a substantial overvaluation for stocks and included a recommendation that defensive positioning may be prudent given the potential for market corrections.
The projections here are partly based on our CAPE-MA35 methodology described in the January 2019 article Estimating Forward 10-Year Stock Market Returns using the Shiller CAPE Ratio and its 35-Year Moving Average, which is referred to as the “referenced article” further down.
What short-term stock market returns can be expected?
Nobody knows, and the best one can do is to use the historic data (which is from Shiller’s S&P series) to guide us to make estimates for the future. From the real price of the S&P-Composite with dividends re-invested (S&P-real) one finds that the best-fit line from 1871 onward is a straight line when plotted to a semi-log scale. There is no reason to believe that this long-term trend of S&P-real will be interrupted.
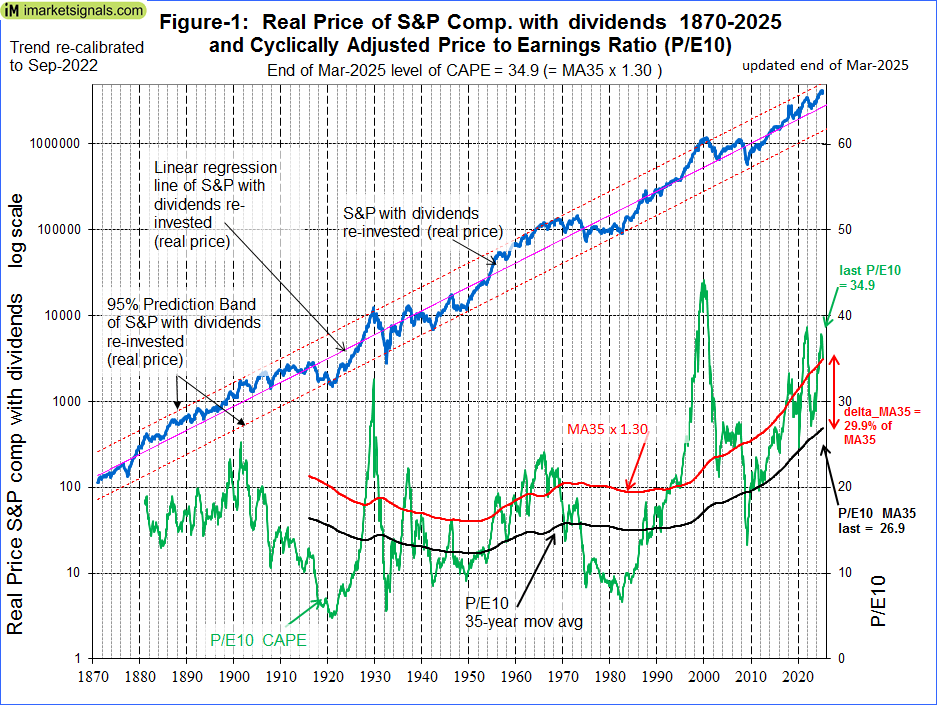
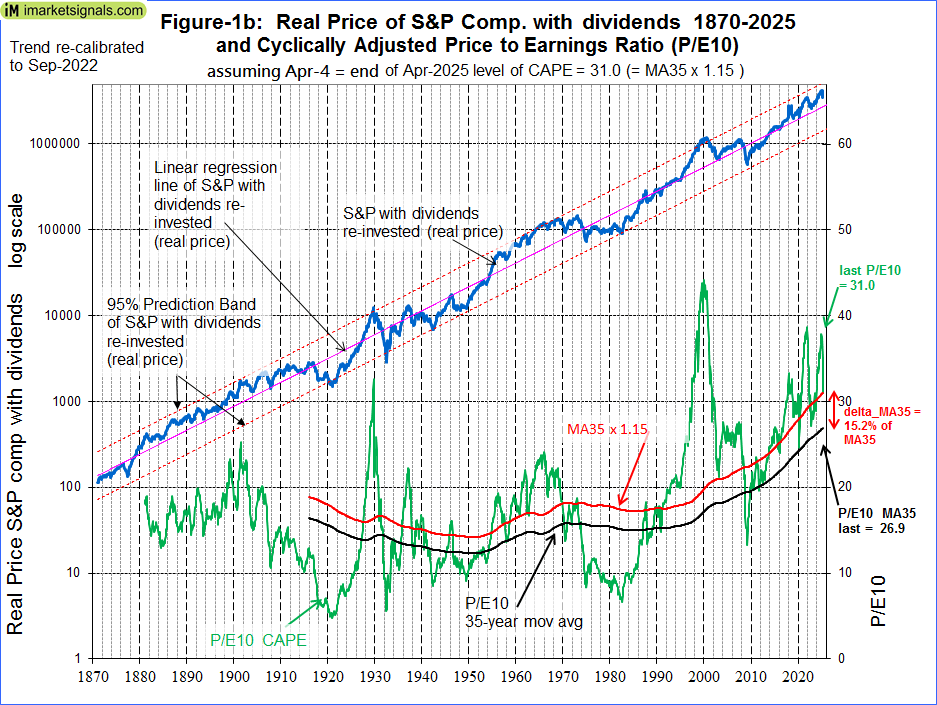
S&P-real and the best fit line together with its 95% prediction band lines are shown in Figure-1, updated to end of March 2025, and in Figure-1b, preliminarily updated to end of April 2025. (See the appendix for the equations.)
In Figure-2 and Figure-2b the level of the S&P 500 relative to the long-term trend is indicated by the line parallel to the long-term trend line. Note that this relative level is now similar than what it was at mid-2007 prior to the 55% decline of the S&P 500 to the March 2009 low. Thus, it is not impossible for the S&P 500 to still suffer a similar decline from the current level, despite the recent 10% loss.
Forecasting stock market returns with the CAPE-MA35 Ratio
Also shown in Figure-1 are the CAPE-ratio (which is the S&P-real divided by the average of the real earnings over the preceding 10 years) and its 35-year moving average (MA35), having end of March 2025 values of 34.9 and 26.9, respectively. Thus, the CAPE was 30% above its MA35. In Figure-1b, assuming that the value of April 4 will represent the average value for April, the CAPE is at 31.0 only 15% above its MA35.
As shown in the referenced article, a superior method to the standard use of the Shiller CAPE-ratio is to predict 10-year real returns using the CAPE-MA35 ratio as a valuation measure. It is simply the value of the Shiller CAPE-ratio divided by the corresponding value of its 35-year moving average (now at 31.0 / 26.9 = 1.15).
Currently the CAPE-MA35 ratio of 1.15 forecasts a probable 10-year annualized real return of about 6.7% to end of April 2035. Based on the current S&P 500 value this would indicate an end of April 2035 value of about 9,736 for S&P-real, with upper and lower confidence values of 11,000 and 8,600, respectively (Figures-2b).
Forecasting returns to 2035 with the long-term trend
When extending the best fit line and the prediction bands (Figure-2b), then the S&P-real end of April 2035 value would be 7,472.
Thus, the historic trend forecasts a probable total 10-year gain of about 47% (or an annualized return of about 4.0%) for S&P-real from its April 4, 2025 level of 5,074 to the end of April 2035 best fit level of 7,472.
Conclusion
- The S&P 500 is still substantially overvalued based on historical metrics, and a further 50% decline induced by escalation of geopolitical tension cannot be discounted.
- While forward returns are positive, they are modest and still carry significant downside risks.
- Defensive positioning may be prudent given the potential for more market declines.
- Should the CAPE-MA35 ratio decline further to below 1.0 then it would again present a good stock market investment opportunity.
Monthly updates of the estimated 10-year forward returns of the S&P 500 are posted at imarketsignals.com.
Appendix
The best fit line and prediction band (re-calibrated to Sep-2022)
The best fit line and prediction band were calculated from monthly data from Jan-1871 to Sep-2022. This includes now an additional 10 years of data of the SP-real values for the period after July-2012, previously not included in the regression analysis.
The equation of the best fit line is y = 10(ax+b)
y = is the dependent variable of the best fit line.
x = are the number of months from January 1871 onward.
a =0.002321819
b = 2.133179076
R2= 0.98
The parameters for the 95% prediction band lines are:
Upper: a = 0.002321819, b = 2.412217299
Lower: a = 0.002321819, b = 1.854140854
Leave a Reply
You must be logged in to post a comment.