
Bond-market:
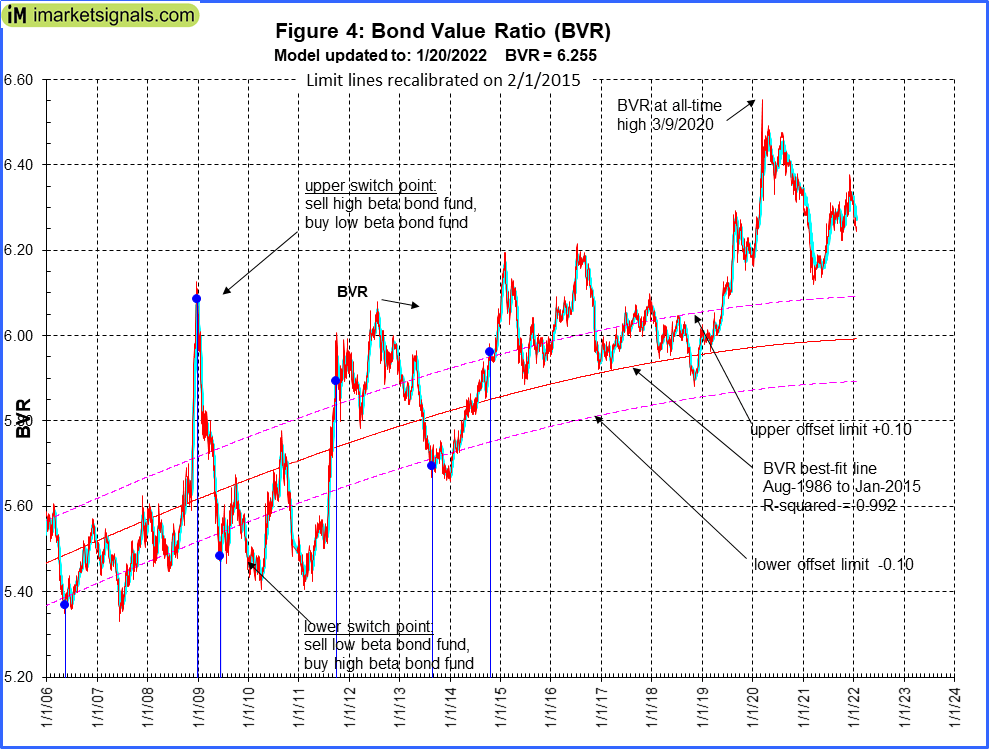 The BVR-model avoids high beta bonds (long-bonds) and also intermediate duration bonds.
The Bond Value Ratio is shown in Fig 4 and is below last week’s value. According to the model, only when BVR turns upward after having been lower than the lower offset-line should one consider long bonds again.
The Yield Curve:
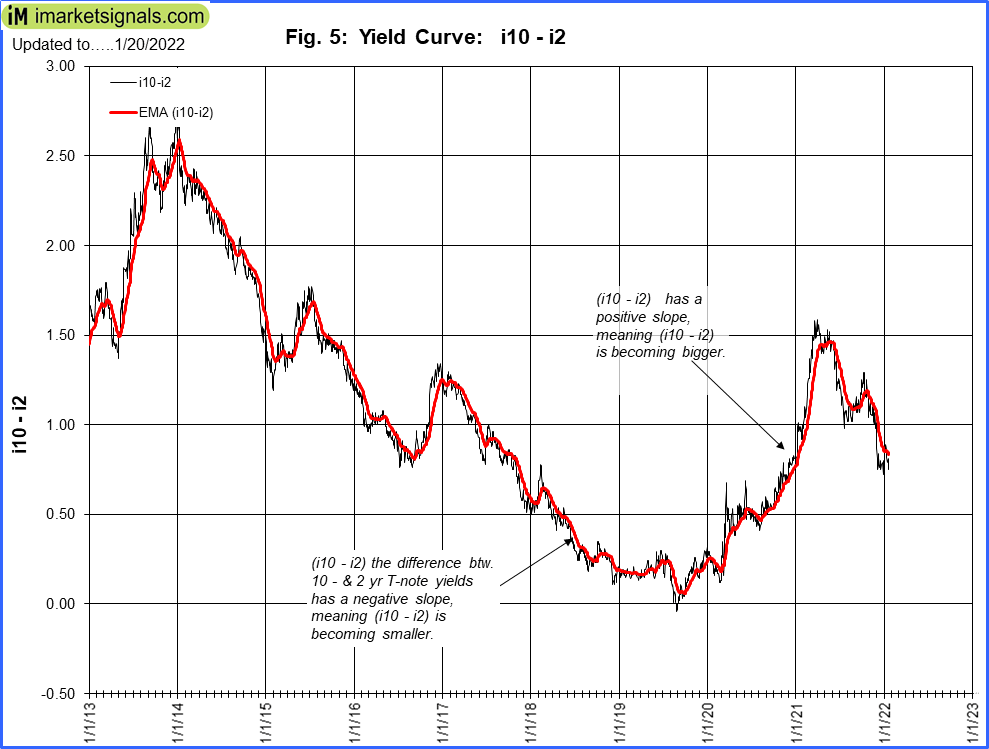 The yield curve model indicates the trend of the 10-year and 2-year Treasuries yield spread. Figure 5 charts (i10 – i2), the yield curve is below last week’s level and the trend remains flattening. This model confirms the direction of the BVR. (This model previously showed buy and sell signals for STPP and FLAT, two ETN’s that profited from a steepening or flattening yield curve, respectively, but these have now matured and are no longer available. The model is continued so that the trend of the yield curve can be monitored)
Gold:
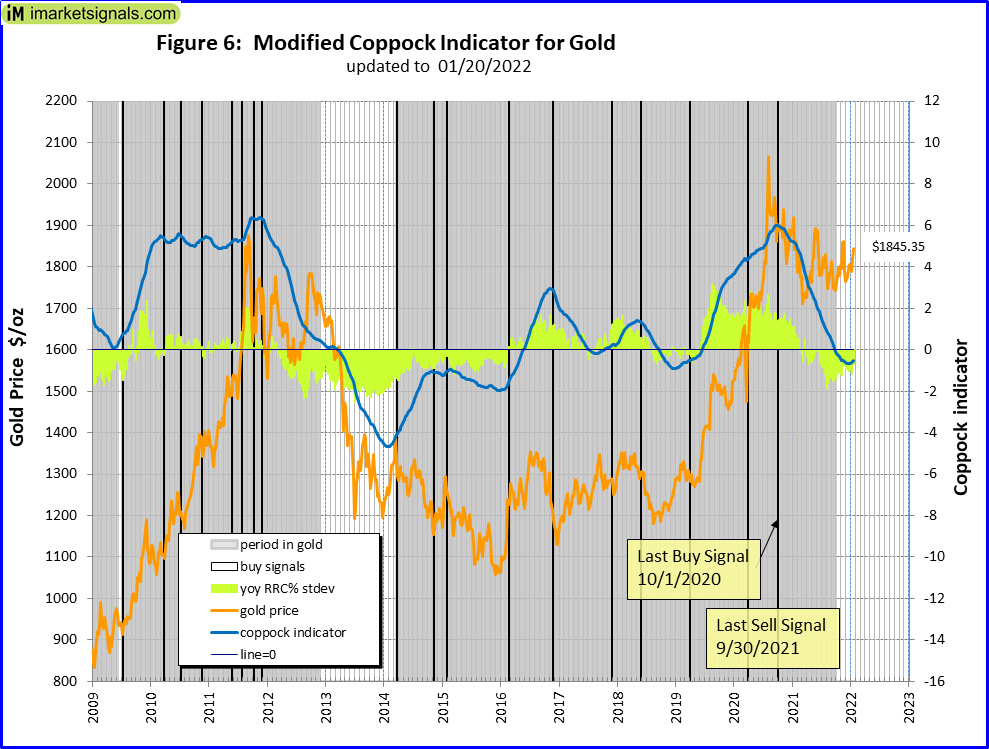 The modified Coppock Gold indicator shown in Fig 6 generated a sell signal end September 2021, and thus invested in cash.
This indicator is described in Is it Time to Buy Gold Again? – Wait for the buy signal …….
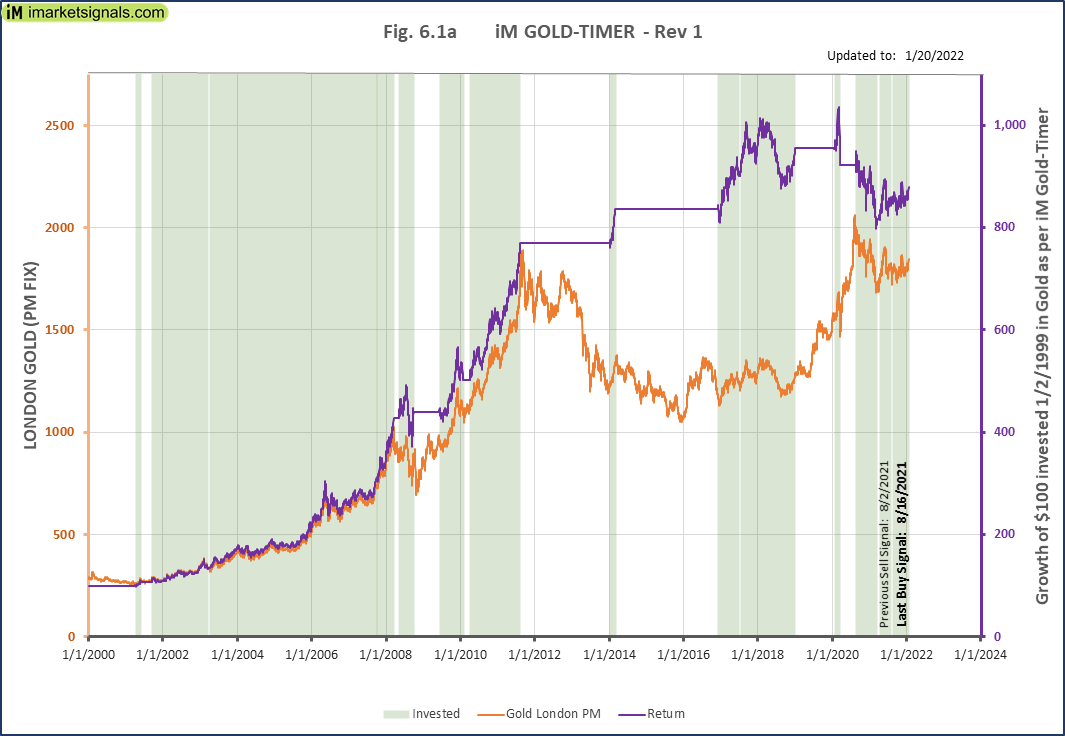 The iM GOLD-TIMER Rev-1 This model generated a new a buy signal mid August 2021 after being in cash for two weeks and thus invested in gold.
Silver:
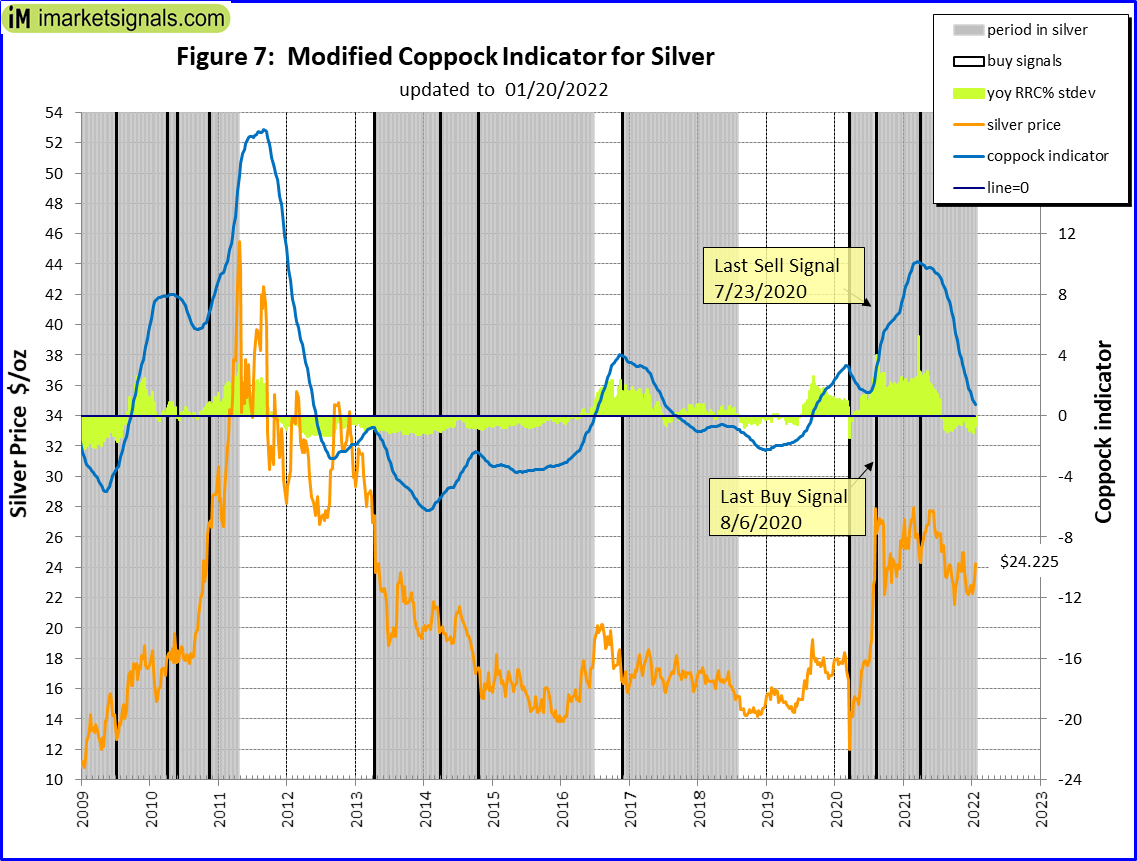 The modified Coppock Silver indicator shown in Fig 7. A week after exiting silver, iM-coppock model generated a buy signal begin August 2020 and is again invested in silver.
This indicator is described in Silver – Better Than Gold: A Modified Coppock Indicator for Silver.
Leave a Reply
You must be logged in to post a comment.