
- The average of S&P 500 for December 2020 is 3695. This is 1293 points higher than the long-term trend value of 2402.
- The current percentage difference of S&P 500 level relative to the current long-term trend level is 54%, a value never exceeded in the recent past since 2002.
- The Shiller Cyclically Adjusted Price to Earnings Ratio (CAPE) is at a level of 33.7. That is 37% higher than its 35-year moving average (MA35), currently at 24.7.
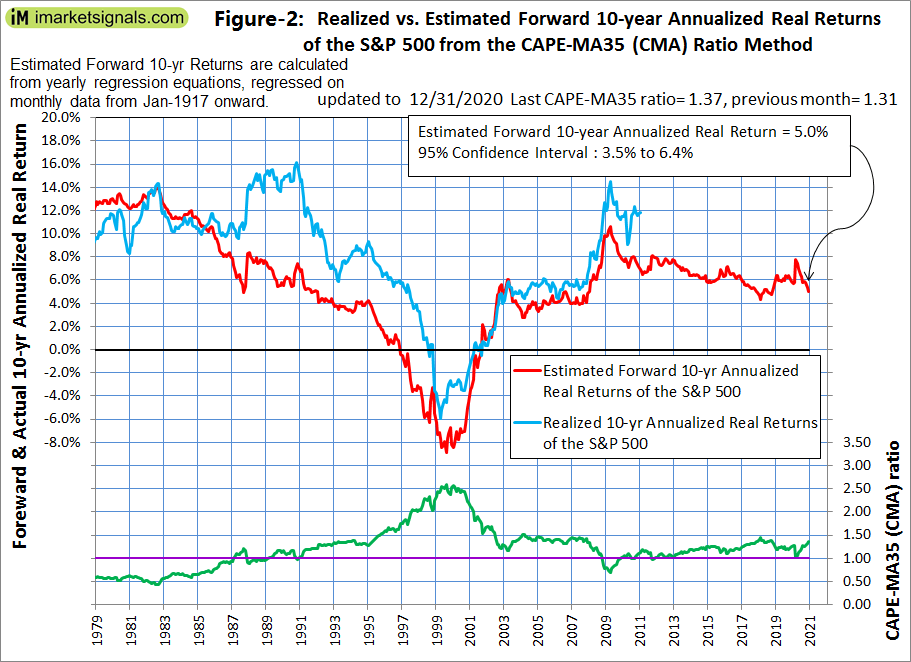
- The CAPE-MA35 ratio is 1.37, forecasting a 10-year annualized real return of about 5.0%. Should the CAPE-MA35 ratio increase further, then 10-year forward returns will be even lower.
- The long-term trend is forecasting a 10-year annualized real return of 2.1%. The most likely forecast 10-year forward return would be about 3.5%, the average of 5.0% and 2.1%.
This is an update to our series of articles started in 2012 assessing market valuation and estimating forward stock market returns. The most recent previous update was in April 2020.
The projections here are partly based on Estimating Forward 10-Year Stock Market Returns using the Shiller CAPE Ratio and its 35-Year Moving Average, which is referred to as the “referenced article” further down.
What short-term stock market returns can be expected?
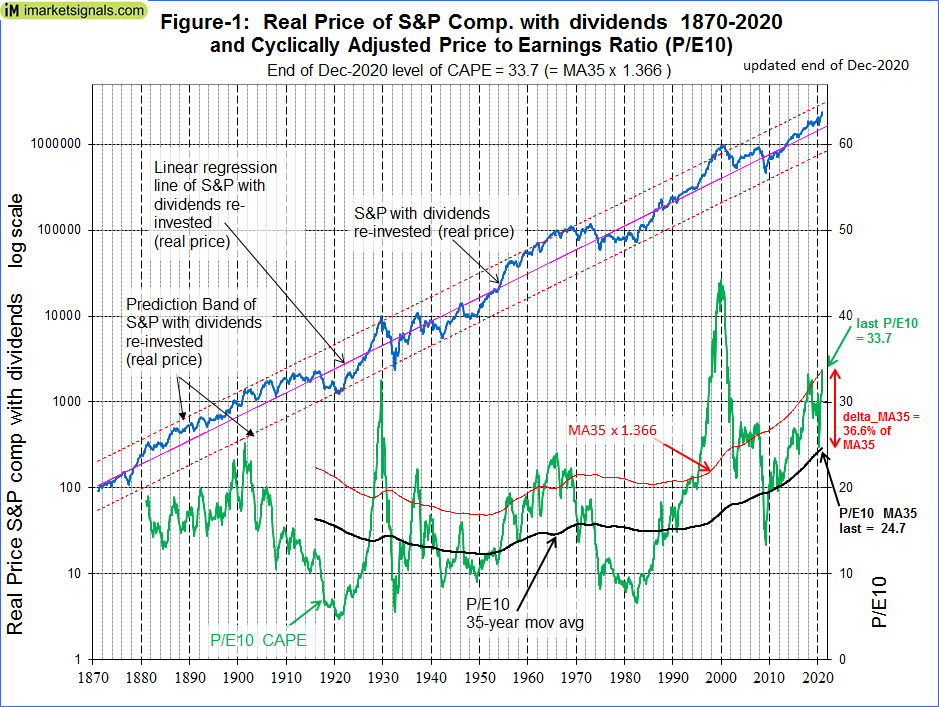
Nobody knows, and the best one can do is to use the historic data (which is from Shiller’s S&P series) to guide us to make estimates for the future. From the real price of the S&P-Composite with dividends re-invested (S&P-real) one finds that the best-fit line from 1871 onward is a straight line when plotted to a semi-log scale. There is no reason to believe that this long-term trend of S&P-real will be interrupted. S&P-real, updated to end of December 2020, and the best fit line together with its 95% prediction bands are shown in Figure-1. (See appendix for the equation.)
The current level of the S&P-real is 54% above the long-term trend line, and a reversal to the mean trend would entail a 35% decline, possibly over a short period.
Forecasting 10-year stock market returns with the CAPE-MA35 Ratio
Also shown in Figure-1 are the CAPE (which is the S&P-real divided by the average of the real earnings over the preceding 10 years) and its 35-year moving average, having end of December values of 33.7 and 24.7, respectively.
As shown in the referenced article, a superior method to the standard use of the Shiller CAPE-ratio is to predict 10-year real returns using the CAPE-MA35 ratio as a valuation measure. It is simply the value of the Shiller CAPE-ratio divided by the corresponding value of its 35-year moving average (33.7 / 24.7 = 1.37).
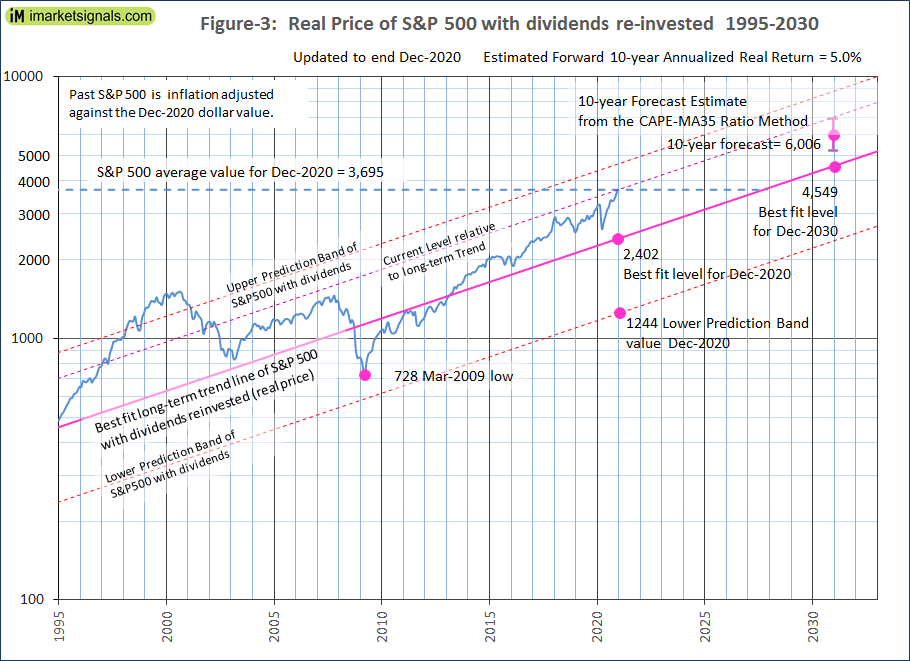
Currently the CAPE-MA35 ratio of 1.37 forecasts an annualized real return of about 5% to December 2030 (Figure-2). Based on the current S&P 500 value this would indicate an end of 2030 value of 6006 for S&P-real, with upper and lower confidence values of 6890 and 5230, respectively, as shown in Figure-3.
Also in Figure-3 the current level of the S&P 500 relative to the long-term trend is indicated by the line parallel to the long-term trend line. Note, that since 2002 this relative level has never been greater than what it is now. This is not a situation which provides confidence of major stock market gains to come.
Forecasting returns to 2030 with the long-term trend
When extending the best fit line and the prediction bands (Figure-3), then the S&P-real end of December 2030 value would be 4549, while the highest and lowest values shown by the prediction bands would be about 8780 and 2360, respectively.
Thus the historic trend forecasts a probable annualized return of 2.1% for S&P-real from its current level of 3695 to the end of 2030. The worst case scenario would be a possible annualized return of -4.4%, and the best outcome could be an annualized return 9.0%.
Conclusion
Since 1950, for a CAPE-MA35 ratio of 1.37 the actual historic real 10-yr forward returns that followed ranged from -3.3% to 9.9%, averaging 5.1%, as shown in the table below. This range is similar what is predicted now from the CAPE-MA35 ratio and the long-term trend.
| CAPE-MA35 Ratio 1.37 +/- 3% | ||||
| real forward 10-yr CAGR | No. of observations | |||
| Estimated | Actual | 80 | ||
| Min | 2.5% | -3.3% | ||
| Max | 5.8% | 9.9% | Data begins | Data ends |
| Avg. | 4.0% | 5.1% | 1/1/1950 | 12/31/2010 |
- The current elevated level of the S&P 500 relative to the current long-term trend level warns that stocks are overvalued; and
- The current CAPE-MA35 ratio of 1.37 forecasts only a 5.0% real 10-year forward return for the S&P 500; and
- The long-term trend indicates a 2.1% 10-year forward annualized return.
- The most likely forecast 10-year forward return would be about 3.5%, the average of 5.0% and 2.1%. This would be near the lower confidence value of 5230 for the S&P-real indicated by the CAPE-MA35 ratio for December 2030.
Should the market continue to go higher it will provide even poorer investment opportunities for long-term investors, because the 10-year forward returns will get lower with increasing values of the CAPE-MA35 ratio. For example, prior to the 2001 recession, from January 1999 to October 2000 the CAPE-MA35 ratio was greater than 2.3, and the real annualized 10-year returns for stocks that followed averaged a negative 3.7%.
Updates of the estimated 10-year forward returns of the S&P 500 (Figure-2) are posted monthly at imarketsignals.com.
Appendix
The best fit line and prediction band were calculated from monthly data from Jan-1871 to July-2012. The SP-real values for the period after July-2012 are “out of sample” and were not included in the regression analysis.
The equation of the best fit line is: y = 10(ax+b)
where:
y = is the dependent variable of the best fit line.
x = are the number of months from January 1871 onward.
a = 0.0023112648
b = 2.02423522
Leave a Reply
You must be logged in to post a comment.