- This investment strategy holds a maximum of 50 consensus stock picks from 40 hedge funds with more than $3,500 million Assets Under Management.
- Changes in the holdings occur only every three months when the end of the quarter 13F filings becomes public information; the latest date was February 15, 2021.
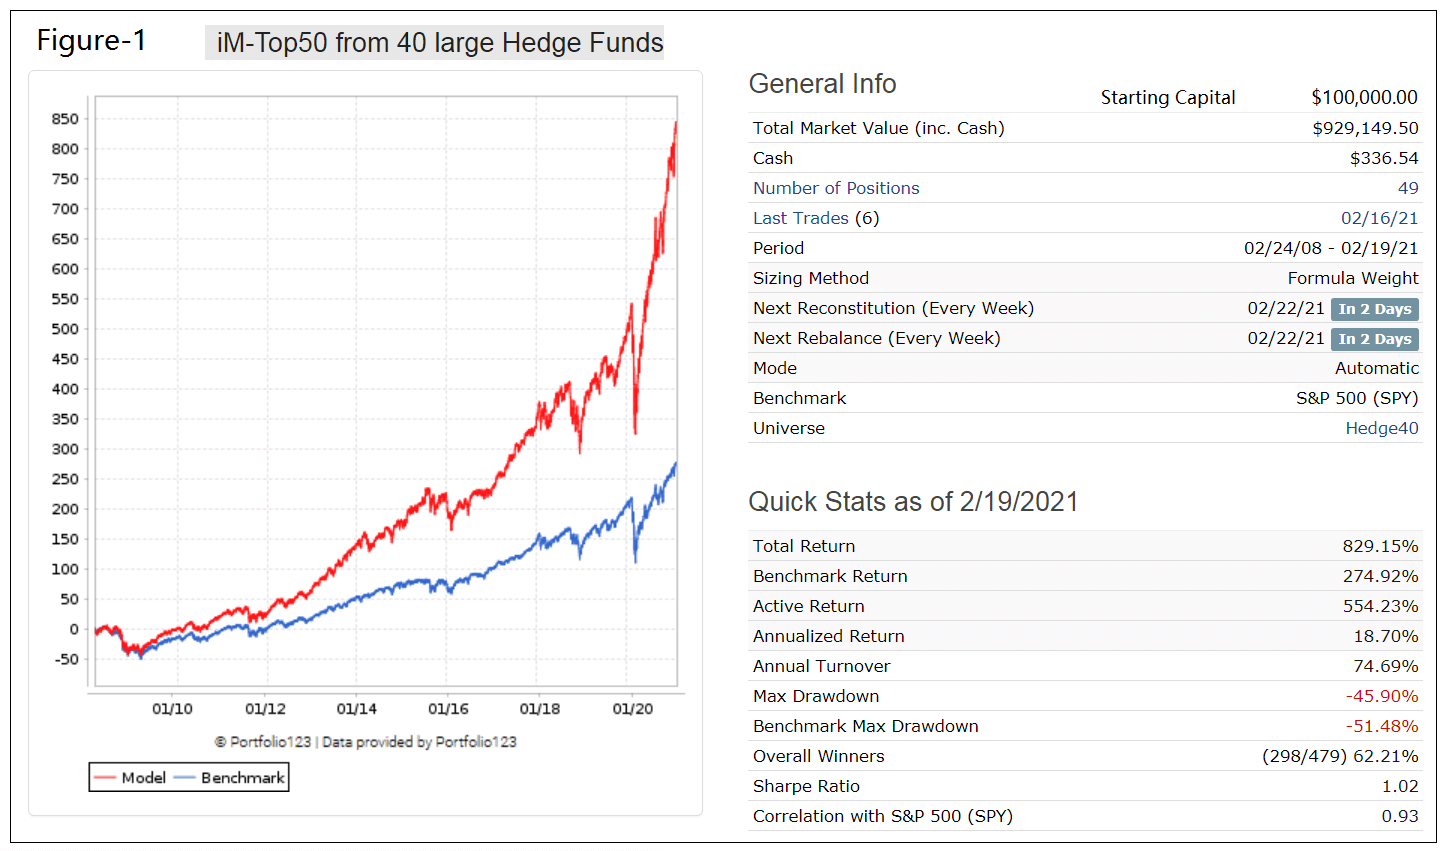
- From 02/24/08 – 02/19/21 this strategy would have produced an annualized return (CAGR) of 18.7%, significantly more than the 10.7% CAGR of the S&P 500 ETF (SPY).
- Here we report the most recent holdings, and also list the stocks removed and added as of the week ending 2/19/2021.
Rational for a Copycat Strategy
Research from Barclay and Novus published in October 2019 found that a stock selection copycat strategy that combines conviction and consensus of fund managers that have longer-term views outperformed the S&P 500 by 3.80% on average annually from Q1 2004 to Q2 2019.
Therefore, relying on the stock picking expertise of professional fund managers should provide superior returns than a “do-it-yourself” strategy for an average investor.
Stock Selection from the Fund Manager Group
Stocks come from the quarterly 13F filings, point in time, approximately 45 days after the end of month filing date of each quarter, typically by the middle of February, May, August and November. Thus, the model is reconstituted with an approximate 45-day lag after the quarter-end, with positions occasionally rebalanced to equally weight.
Hedge funds considered had to have Assets Under Management (AUM) greater than $3.5 billion and to have outperformed the S&P 500 Total Return from 2008, and also over the last 3 years. There were only 40 hedge funds satisfying these criteria, these are listed in Appendix-B.
The top 50 picks from the group are selected according to a “Combined Percent of Portfolio” method by summing each securities percent of portfolio for each filer. Stocks with the highest combined percentage count are picked first.
Historic Performance
The backtest started with the 2007-Q4 data available mid-February 2008 and was performed online at whalewisdom.com which also provides the historic holdings for every quarter. The historic holdings were then transferred to Portfolio 123 as a “Stock Factor”, a listing of dates and tickers and their associated values.
Figure-1 shows the performance of this strategy since February 2008. It would have produced an annualized return of 18.7% with low annual turnover of 75%. The total return is 3-times that of SPY and the average holding period for a position would have been 370 days.
The model outperformed the benchmark SPY every year except for 2016, as can be seen from the table below.
Investment Risk
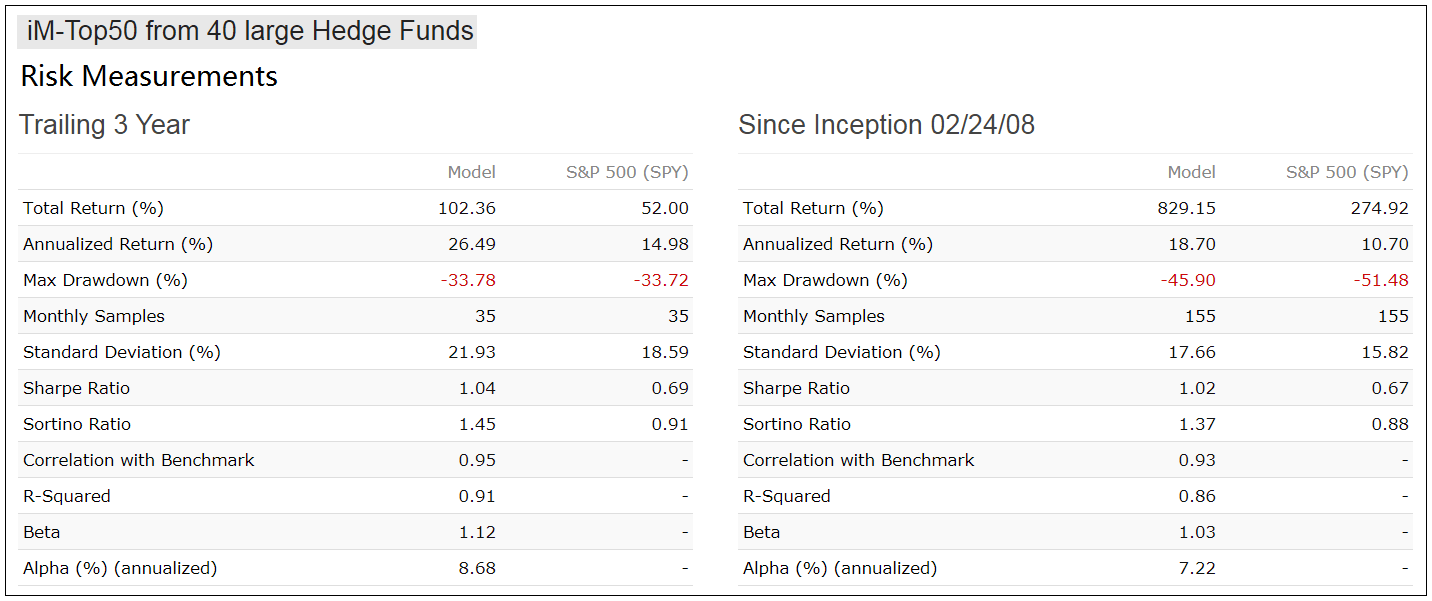
In the table below are the risk statistics from 2008 to 2021 for the model relative to the benchmark S&P 500 (SPY). It is evident from the risk measures that the trading strategy carries less risk than investing in SPY over the longer term. The positive alpha indicates that this strategy would have outperformed its risk-adjusted benchmark return on average by 7.2% per year.
Current holdings
The model currently holds 48 stocks which are listed in Appendix-A.
Conclusion:
The analysis shows that a hedge fund copycat strategy which typically holds 50 positions would have produced good returns, preferable to a buy-and-hold investment strategy of an index fund tracking the S&P 500. Minimum trading is required, only four times per year when a few stocks are sold and bought, and periodically rebalancing the portfolio to equal weight i.e. each holding to to approximately 2% of portfolio value..
At iMarketSignals one can follow this strategy where the performance is updated weekly and holdings are updated every 3 months. The next holdings update will be middle of May 2021. Holdings’
Appendix A
Current Holdings (as of 2/22/2020) |
||||
| Ticker | Days Held | Name | Mkt Cap $B | Sector Code |
| AAPL | 4746 | Apple Inc | 2185 | TECH |
| ADBE | 2009 | Adobe Inc | 229 | TECH |
| ADPT | 553 | Adaptive Biotechnologies Corp | 9 | HEALTHCARE |
| ADSK | 1190 | Autodesk Inc. | 67 | TECH |
| AMT | 4746 | American Tower Corp | 101 | FINANCIAL |
| AMZN | 2191 | Amazon.com Inc | 1635 | NONCYCLICAL |
| BBIO | 553 | BridgeBio Pharma Inc | 8 | HEALTHCARE |
| BSX | 364 | Boston Scientific Corp | 54 | HEALTHCARE |
| CHTR | 2191 | Charter Communications Inc | 118 | TELECOM |
| COUP | 553 | Coupa Software Inc | 26 | TECH |
| CP | 826 | Canadian Pacific Railway Ltd | 49 | INDUSTRIAL |
| CRM | 1372 | salesforce.com Inc | 225 | TECH |
| CRWD | 272 | CrowdStrike Holdings Inc | 53 | TECH |
| CSGP | 91 | CoStar Group Inc | 36 | TECH |
| DHR | 553 | Danaher Corp | 164 | HEALTHCARE |
| DIS | 182 | Walt Disney Co (The) | 327 | CONSUMERSVCE |
| DOCU | 182 | DocuSign Inc. | 49 | TECH |
| FATE | 0 | Fate Therapeutics Inc | 10 | HEALTHCARE |
| FB | 2744 | Facebook Inc | 745 | TECH |
| FIS | 553 | Fidelity National Information Services Inc | 81 | FINANCIAL |
| FISV | 462 | Fiserv Inc. | 75 | FINANCIAL |
| FOLD | 0 | Amicus Therapeutics Inc | 3 | HEALTHCARE |
| GOOGL | 4746 | Alphabet Inc | 1410 | TECH |
| GPN | 462 | Global Payments Inc. | 58 | FINANCIAL |
| INTU | 734 | Intuit Inc. | 108 | TECH |
| JPM | 1462 | JPMorgan Chase & Co | 451 | FINANCIAL |
| MA | 4746 | Mastercard Inc | 332 | FINANCIAL |
| MCO | 2925 | Moody’s Corp. | 52 | BIZSVCE |
| MELI | 0 | MercadoLibre Inc | 95 | NONCYCLICAL |
| MSFT | 2555 | Microsoft Corp | 1818 | TECH |
| NFLX | 2835 | Netflix Inc | 239 | TECH |
| NOW | 826 | ServiceNow Inc | 112 | TECH |
| NVDA | 364 | NVIDIA Corporation | 370 | TECH |
| PDD | 272 | Pinduoduo | 166 | NONCYCLICAL |
| PTON | 91 | Peloton Interactive Inc | 41 | CYCLICALS |
| PYPL | 1462 | PayPal Holdings Inc | 336 | FINANCIAL |
| QCOM | 182 | QUALCOMM Inc. | 165 | TECH |
| SGEN | 3836 | Seagen Inc | 29 | HEALTHCARE |
| SHOP | 462 | Shopify Inc | 176 | TECH |
| SNOW | 0 | Snowflake Inc | 82 | TECH |
| SQ | 91 | Square Inc | 124 | FINANCIAL |
| TDG | 2744 | TransDigm Group Inc | 33 | INDUSTRIAL |
| TSLA | 272 | Tesla Inc | 750 | CYCLICALS |
| UBER | 553 | Uber Technologies Inc | 103 | INDUSTRIAL |
| UNH | 1372 | Unitedhealth Group Inc | 308 | HEALTHCARE |
| V | 4662 | Visa Inc | 438 | FINANCIAL |
| W | 91 | Wayfair Inc | 28 | CYCLICALS |
| WDAY | 272 | Workday Inc | 66 | TECH |
| Sold after the most recent 13F filing: (22 February 2021) | ||||
| CNI | 166 | Canadian National Railway Co | ||
| INCY | 110 | Incyte Corp | ||
| KMX | 1011 | CarMax Inc | ||
| TMO | 189 | Thermo Fisher Scientific Inc | ||
| ZM | 189 | Zoom Video Communications Inc | ||
| Bought after the most recent 13F filing: (22 February 2021) | ||||
| FATE | 0 | Fate Therapeutics Inc | ||
| FOLD | 0 | Amicus Therapeutics Inc | ||
| MELI | 0 | MercadoLibre Inc | ||
| SNOW | 0 | Snowflake Inc | ||
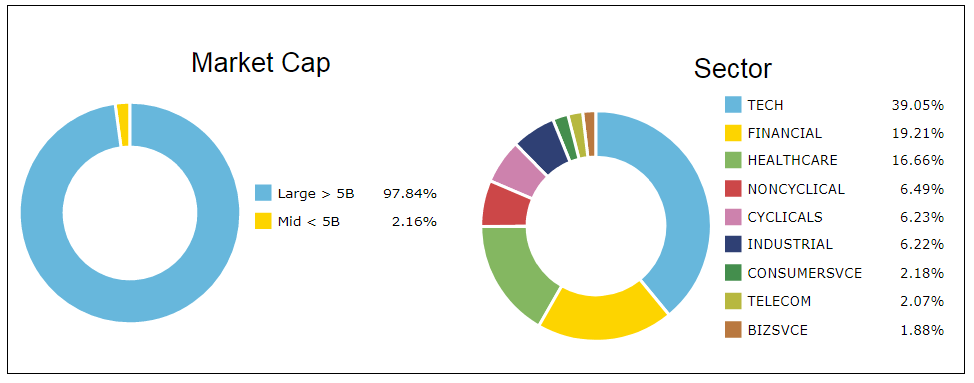
Portfolio composition:
Appendix B
Hedge Fund Filers:
- Akre Capital Management LLC
- Alkeon Capital Management LLC
- Altimeter Capital Management, LP
- Aristotle Capital Management, LLC
- Baker Bros. Advisors LP
- Barings LLC
- Calamos Advisors LLC
- Capital International Ltd
- Citadel Advisors LLC
- Coatue Management LLC
- D. E. Shaw & Company, Inc.
- Disciplined Growth Investors Inc
- DSM Capital Partners LLC
- Echo Street Capital Management LLC
- FMR LLC
- Fort Washington Investment Advisors Inc
- GW&K Investment Management, LLC
- Hitchwood Capital Management LP
- Jennison Associates LLC
- King Luther Capital Management Corp
- Kohlberg Kravis Roberts & Company LP
- Lone Pine Capital LLC
- Loomis Sayles & Company LP
- Matrix Capital Management Company, LP
- Meritage Group LP
- Panagora Asset Management Inc
- Perceptive Advisors LLC
- Pinebridge Investments, LP
- Redmile Group, LLC
- Renaissance Technologies LLC
- Riverbridge Partners LLC
- Ruane, Cunniff & Goldfarb LP
- Steadfast Capital Management LP
- TCI Fund Management Ltd
- Tiger Global Management LLC
- Verition Fund Management LLC
- Viking Global Investors LP
- Westfield Capital Management Company LP
- Whale Rock Capital Management LLC
- Winslow Capital Management, LLC
Disclaimer:
All results shown are hypothetical and the result of backtesting over the period 2008 to 2021. The future out-of-sample performance may be significantly less if fund managers are not as effective in selecting stocks as they were during the backtest period. No claim is made about future performance.


A large portfolio, is it equally weighted, or are the stocks held for 10 years over-weighted by now? Do you have rolling returns you could share? Would a reasonable entry into this model be buying new selections? thanks in advance.