
  |
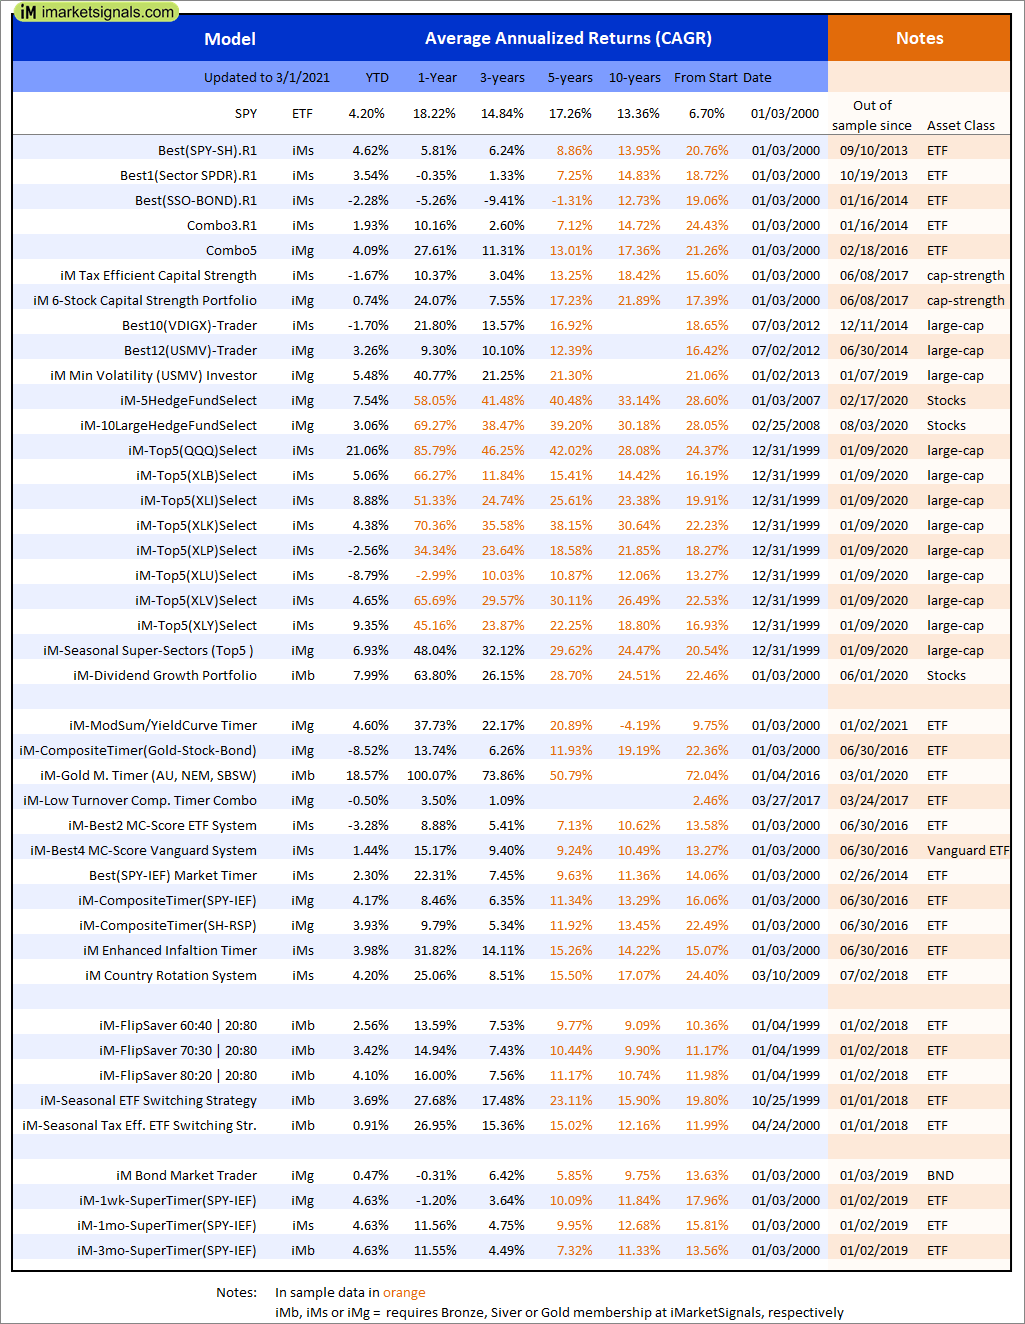
Out of sample performance summary of our models for the past 1, 2, 4 and 13 week periods. The active active return indicates how the models over- or underperformed the benchmark ETF SPY. Also the YTD, and the 1-, 3-, 5- and 10-year annualized returns are shown in the second table |
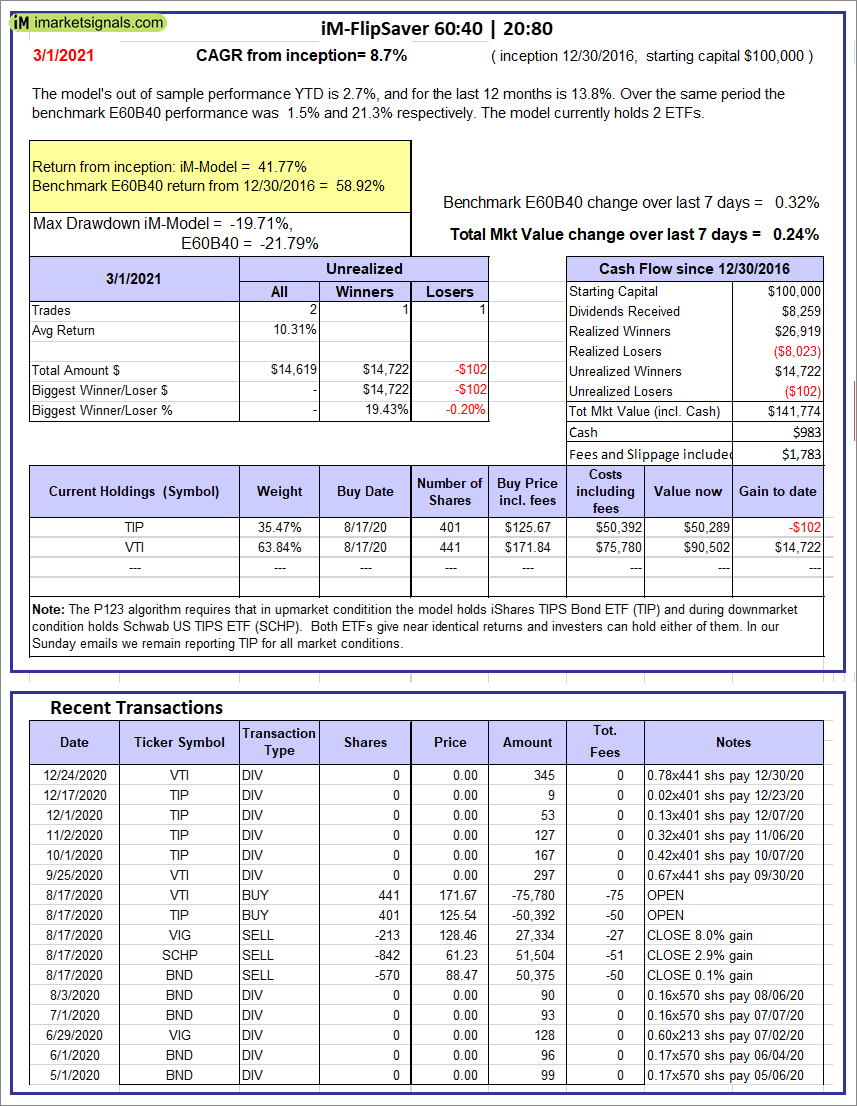 |
iM-FlipSaver 60:40 | 20:80 – 2017: The model’s out of sample performance YTD is 2.7%, and for the last 12 months is 13.8%. Over the same period the benchmark E60B40 performance was 1.5% and 21.3% respectively. Over the previous week the market value of iM-FlipSaver 80:20 | 20:80 gained 0.24% at a time when SPY gained 0.32%. A starting capital of $100,000 at inception on 7/16/2015 would have grown to $141,774 which includes $983 cash and excludes $1,783 spent on fees and slippage. |
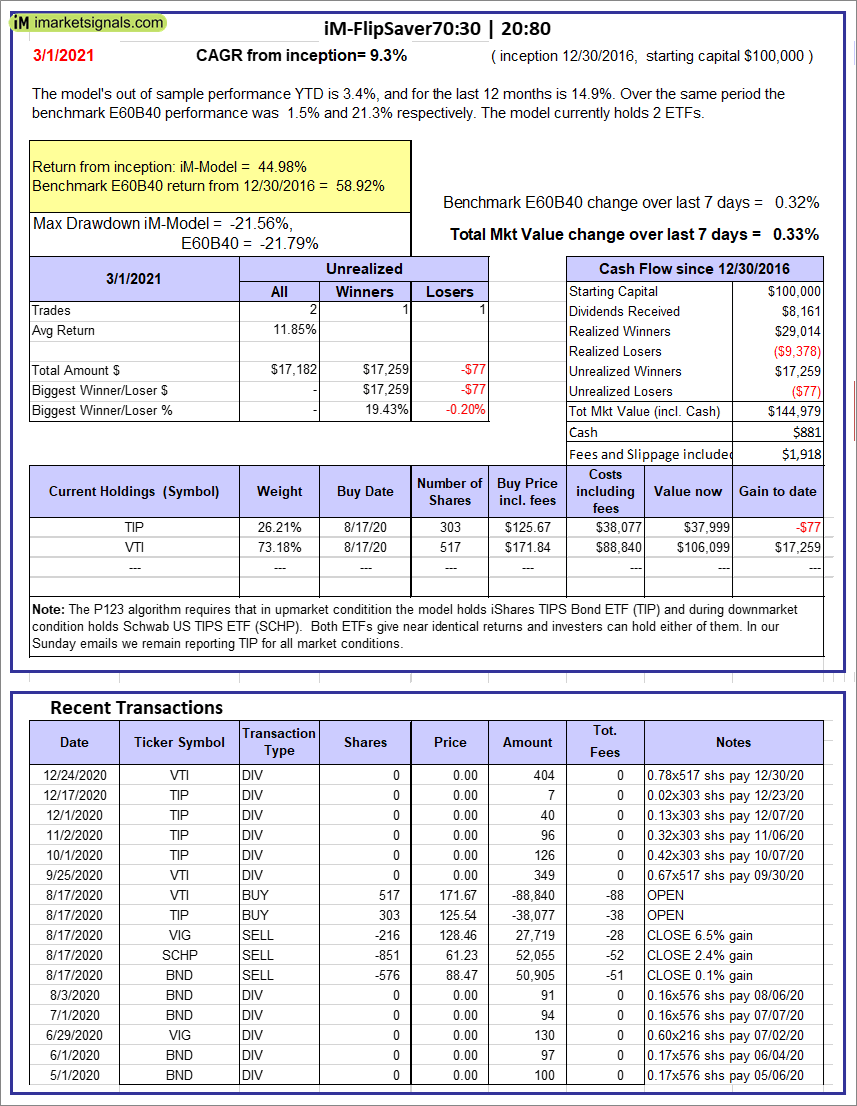 |
iM-FlipSaver 70:30 | 20:80 – 2017: The model’s out of sample performance YTD is 3.4%, and for the last 12 months is 14.9%. Over the same period the benchmark E60B40 performance was 1.5% and 21.3% respectively. Over the previous week the market value of iM-FlipSaver 70:30 | 20:80 gained 0.33% at a time when SPY gained 0.32%. A starting capital of $100,000 at inception on 7/15/2015 would have grown to $144,979 which includes $881 cash and excludes $1,918 spent on fees and slippage. |
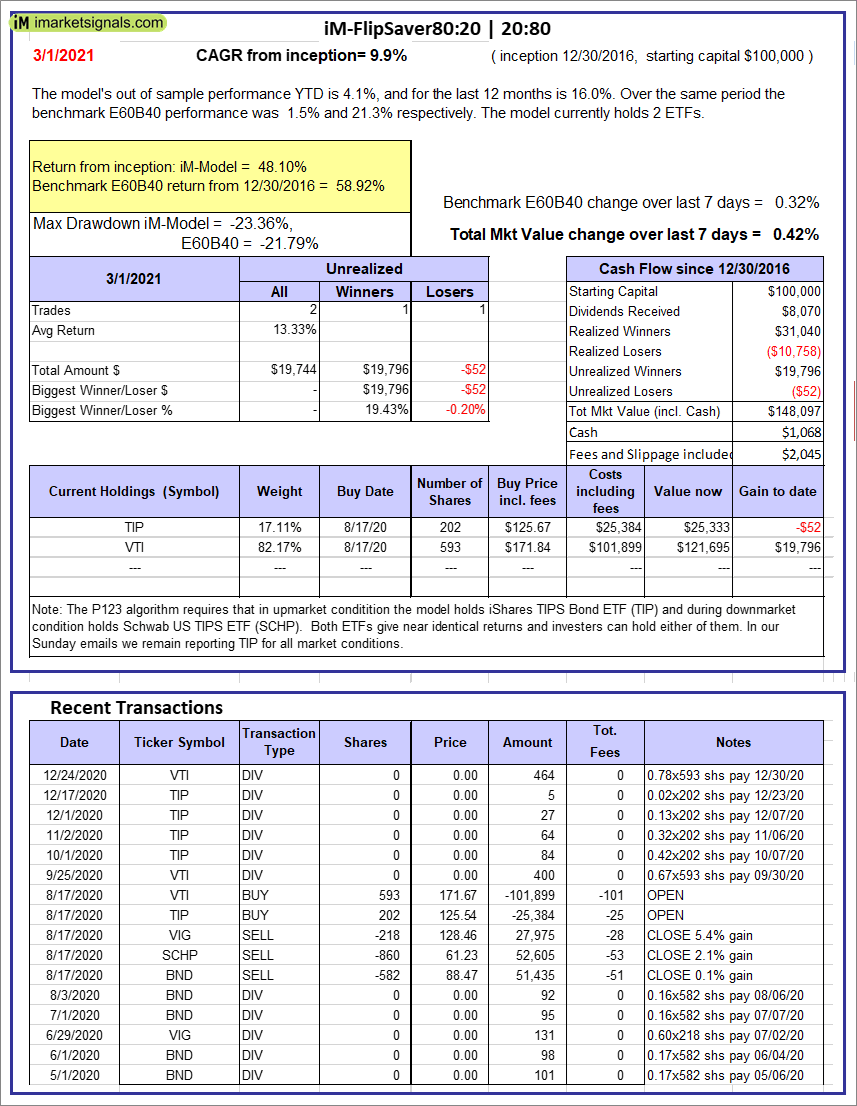 |
iM-FlipSaver 80:20 | 20:80 – 2017: The model’s out of sample performance YTD is 4.1%, and for the last 12 months is 16.0%. Over the same period the benchmark E60B40 performance was 1.5% and 21.3% respectively. Over the previous week the market value of iM-FlipSaver 80:20 | 20:80 gained 0.42% at a time when SPY gained 0.32%. A starting capital of $100,000 at inception on 1/2/2017 would have grown to $148,097 which includes $1,068 cash and excludes $2,045 spent on fees and slippage. |
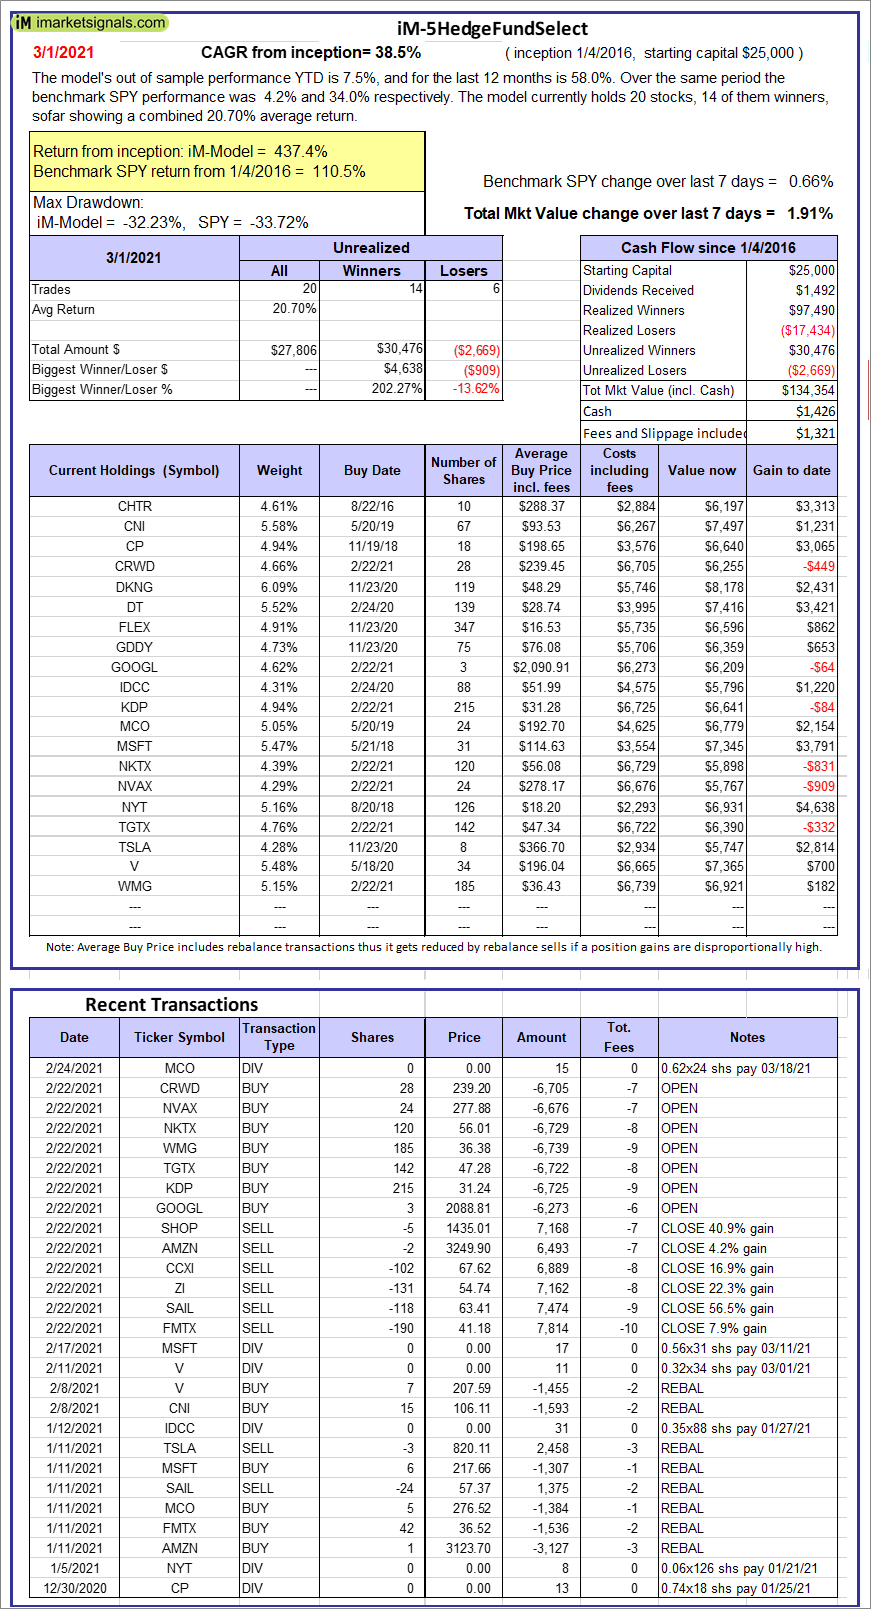  |
iM-5HedgeFundSelect: Since inception, on 1/5/2016, the model gained 437.42% while the benchmark SPY gained 110.47% over the same period. Over the previous week the market value of iM-5HedgeFundSelect gained 1.91% at a time when SPY gained 0.66%. A starting capital of $25,000 at inception on 1/5/2016 would have grown to $134,354 which includes $1,426 cash and excludes $1,321 spent on fees and slippage. |
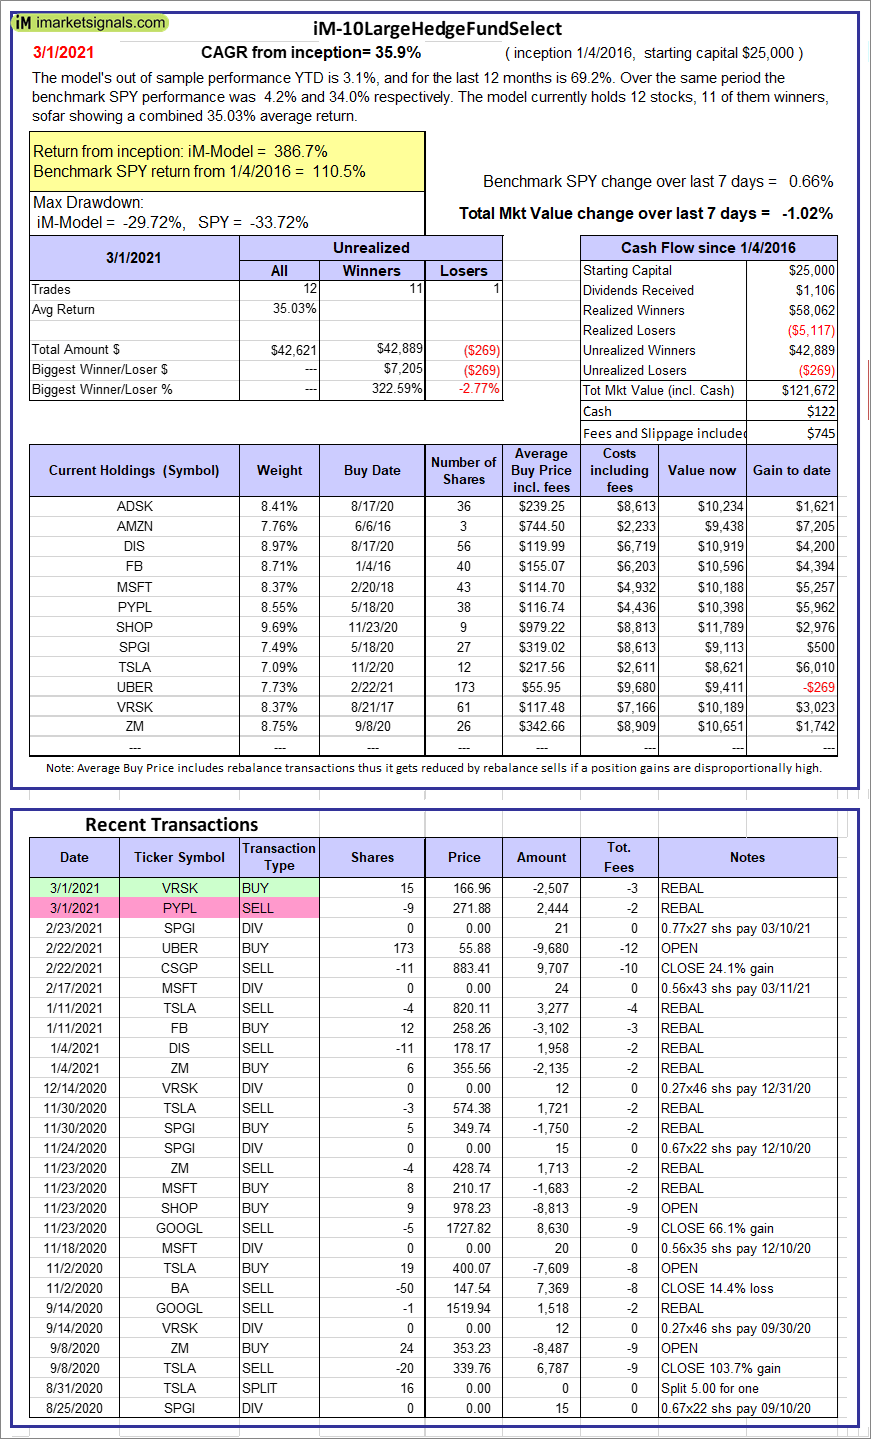 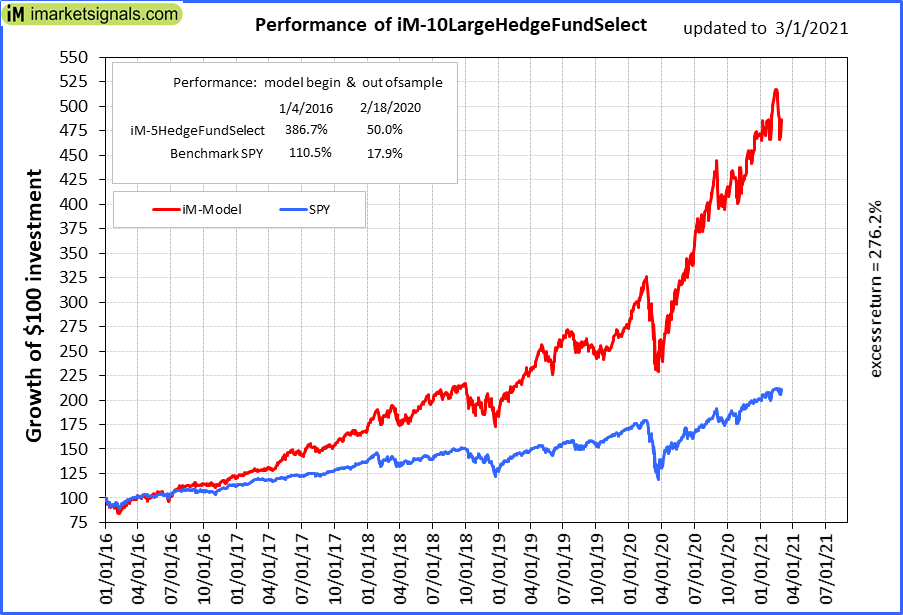 |
iM-10LargeHedgeFundSelect: Since inception, on 1/5/2016, the model gained 386.69% while the benchmark SPY gained 110.47% over the same period. Over the previous week the market value of iM-10LargeHedgeFundSelect gained -1.02% at a time when SPY gained 0.66%. A starting capital of $25,000 at inception on 1/5/2016 would have grown to $121,672 which includes $122 cash and excludes $745 spent on fees and slippage. |
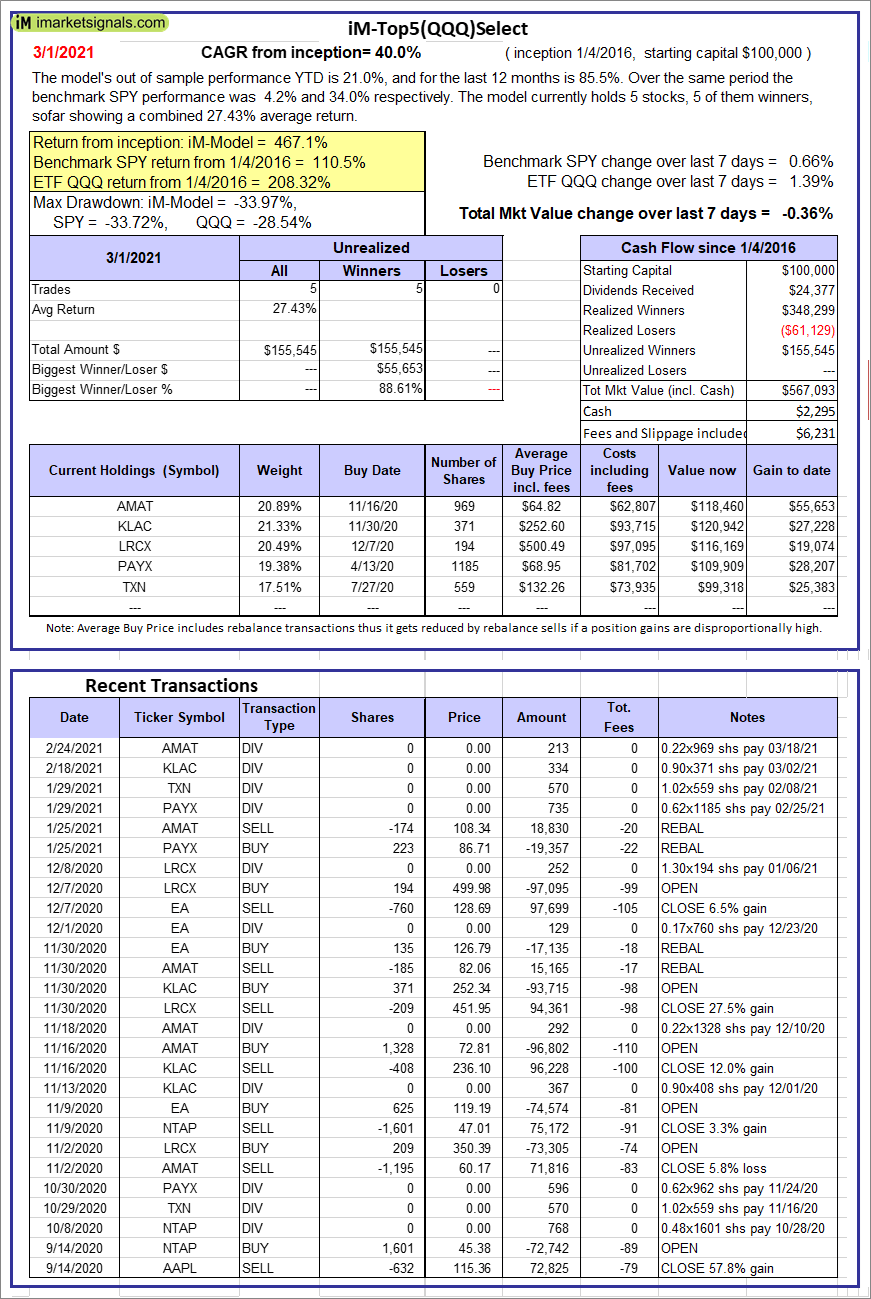 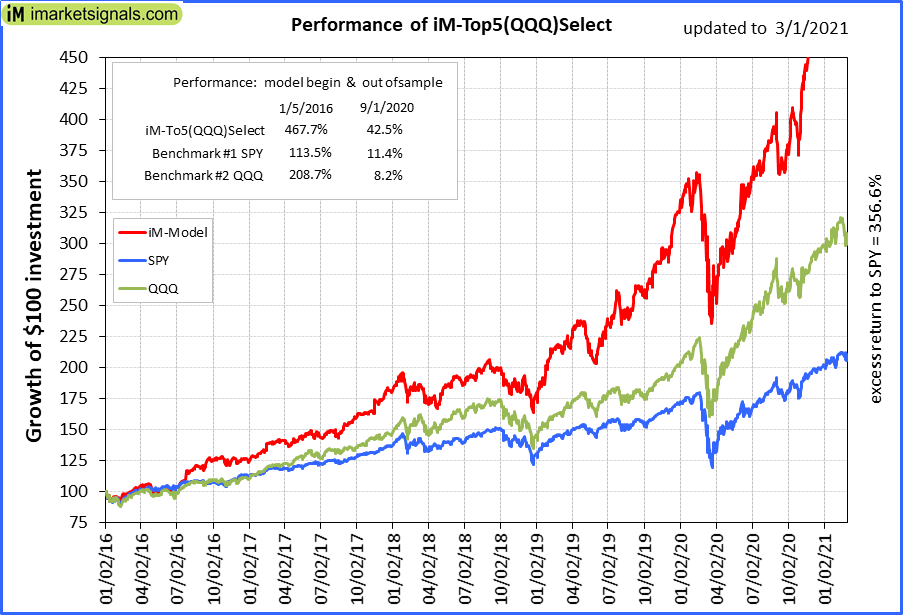 |
iM-Top5(QQQ)Select: Since inception, on 1/5/2016, the model gained 467.09% while the benchmark SPY gained 110.47% over the same period. Over the previous week the market value of iM-Top5(QQQ)Select gained -0.36% at a time when SPY gained 0.66%. A starting capital of $100,000 at inception on 1/5/2016 would have grown to $567,093 which includes $2,295 cash and excludes $6,231 spent on fees and slippage. |
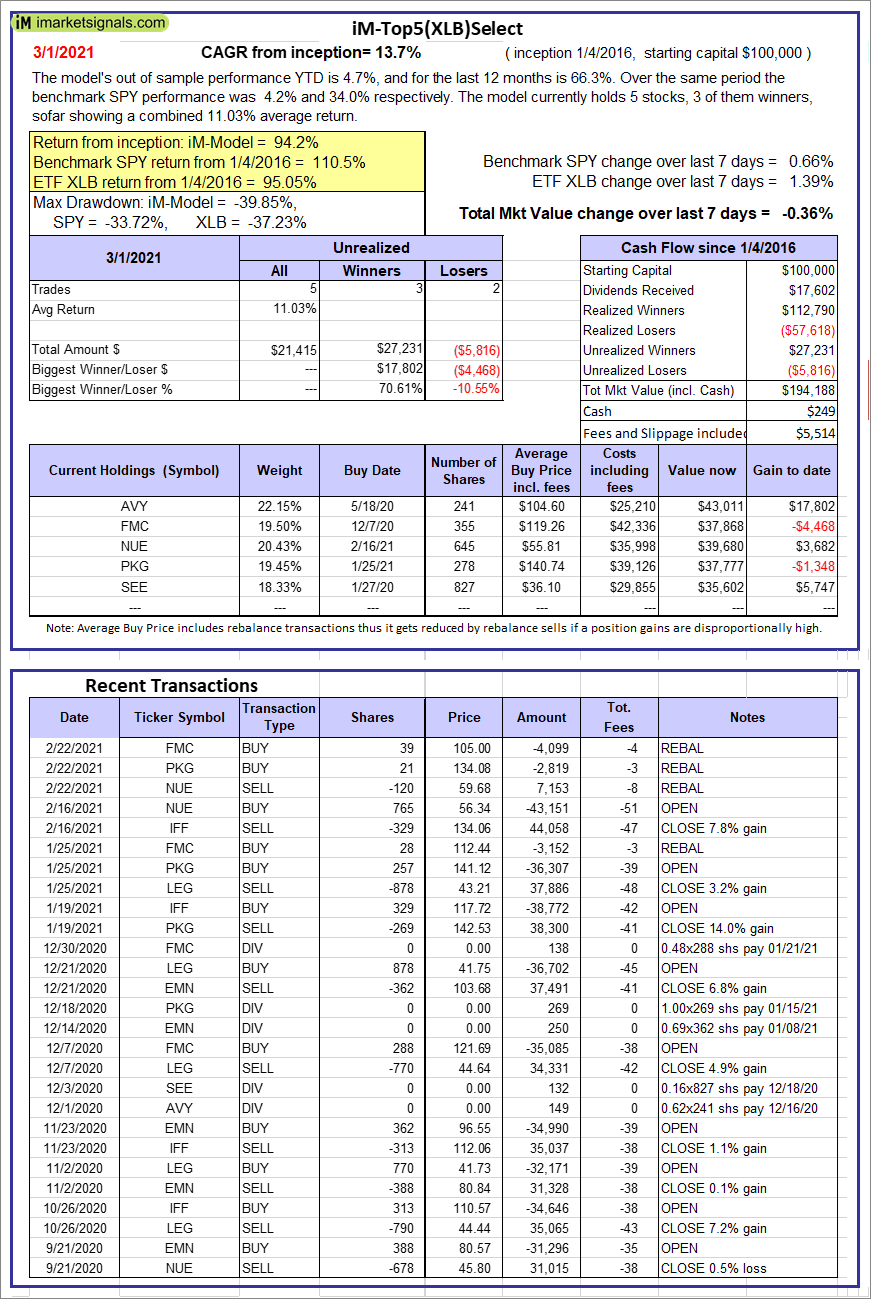 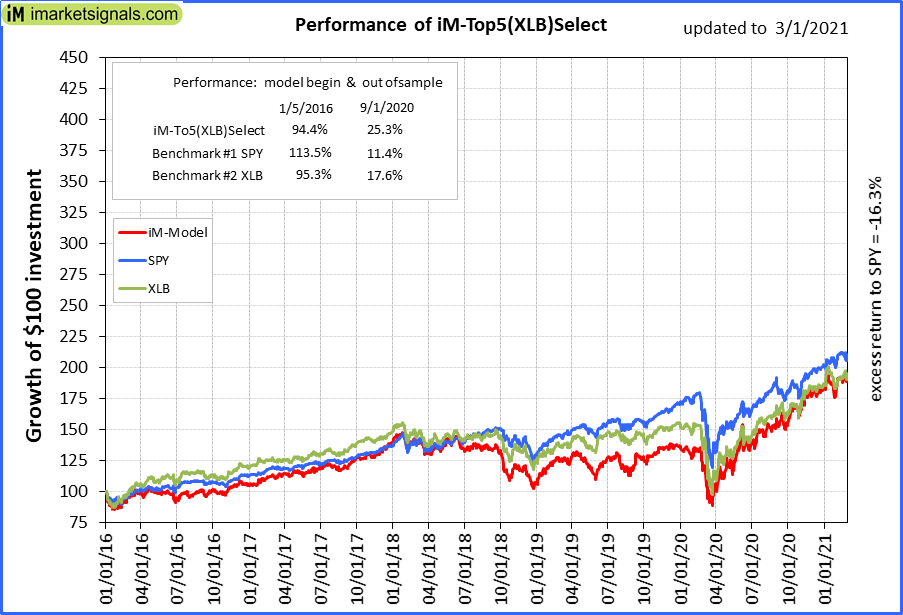 |
iM-Top5(XLB)Select: Since inception, on 1/5/2016, the model gained 94.19% while the benchmark SPY gained 110.47% over the same period. Over the previous week the market value of iM-Top5(XLB)Select gained -0.36% at a time when SPY gained 0.66%. A starting capital of $100,000 at inception on 1/5/2016 would have grown to $194,188 which includes $249 cash and excludes $5,514 spent on fees and slippage. |
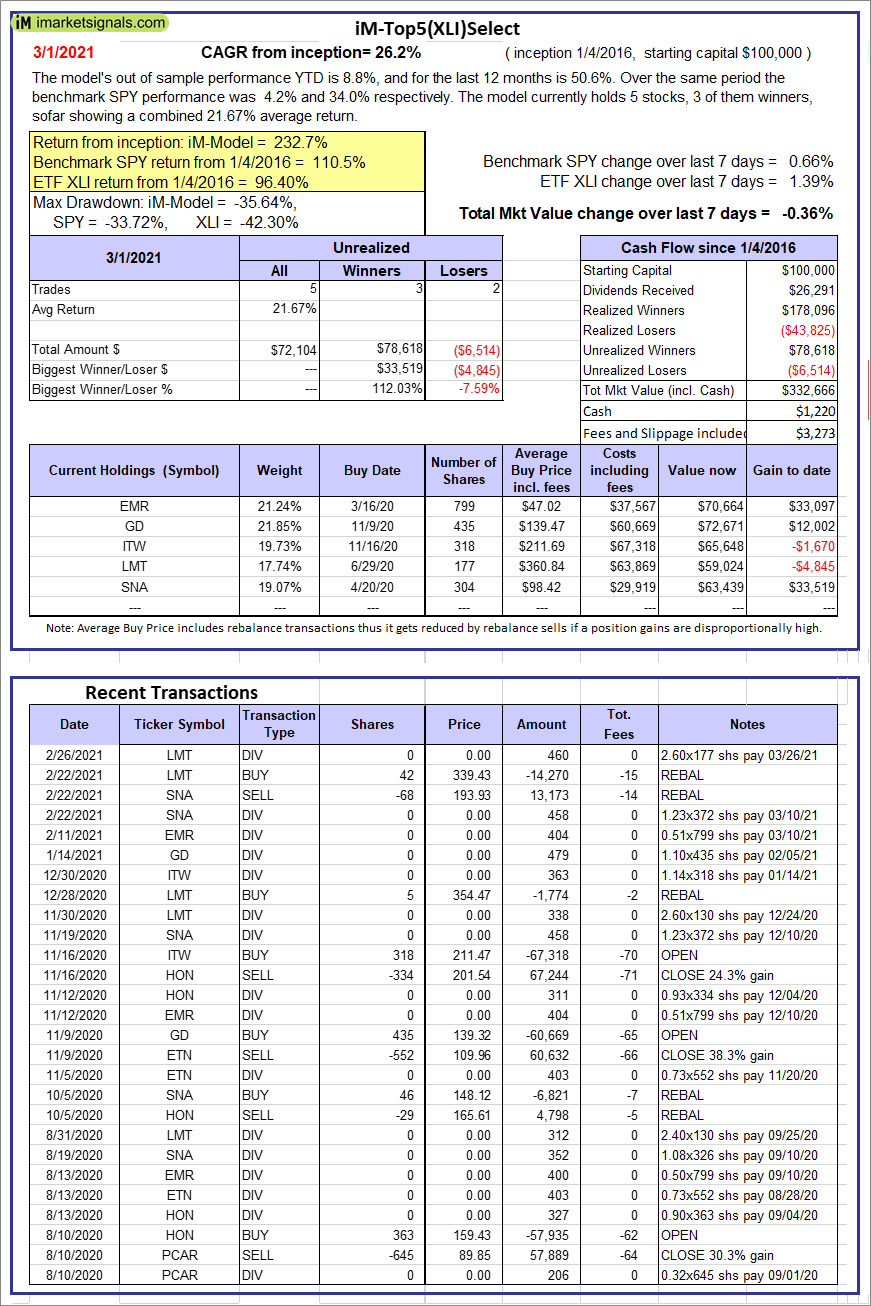  |
iM-Top5(XLI)Select: Since inception, on 1/5/2016, the model gained 232.67% while the benchmark SPY gained 110.47% over the same period. Over the previous week the market value of iM-Top5(XLI)Select gained -0.36% at a time when SPY gained 0.66%. A starting capital of $100,000 at inception on 1/5/2016 would have grown to $332,666 which includes $1,220 cash and excludes $3,273 spent on fees and slippage. |
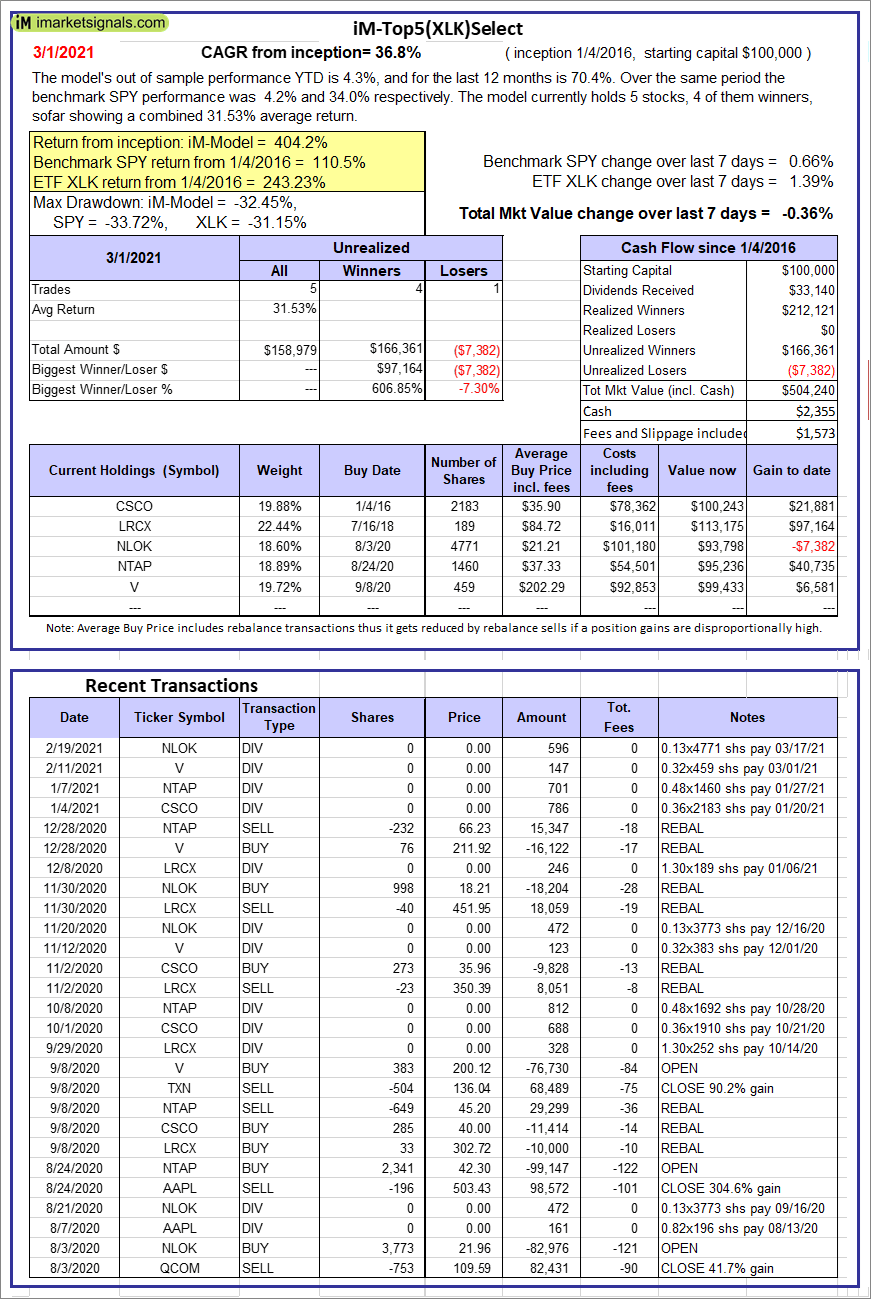 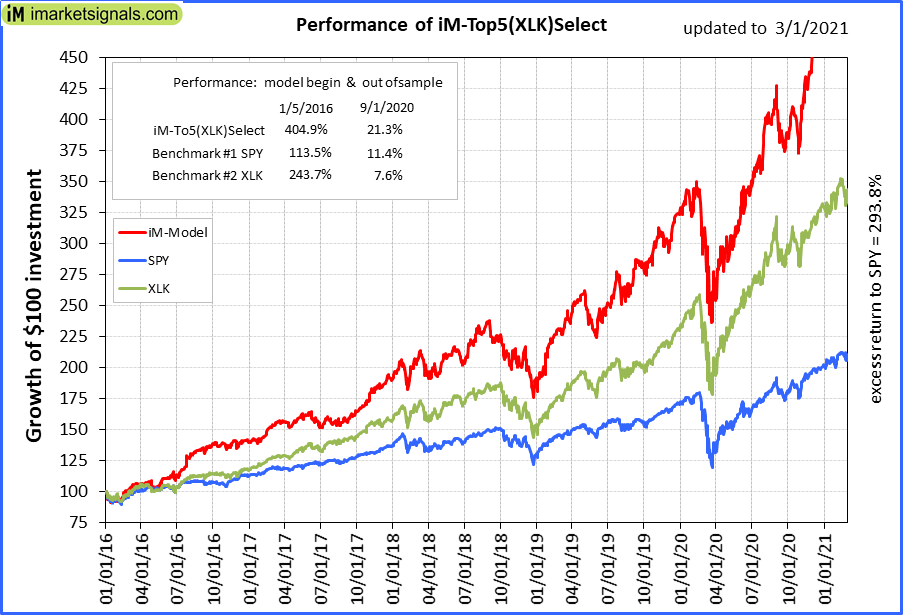 |
iM-Top5(XLK)Select: Since inception, on 1/5/2016, the model gained 404.24% while the benchmark SPY gained 110.47% over the same period. Over the previous week the market value of iM-Top5(XLK)Select gained -0.36% at a time when SPY gained 0.66%. A starting capital of $100,000 at inception on 1/5/2016 would have grown to $504,240 which includes $2,355 cash and excludes $1,573 spent on fees and slippage. |
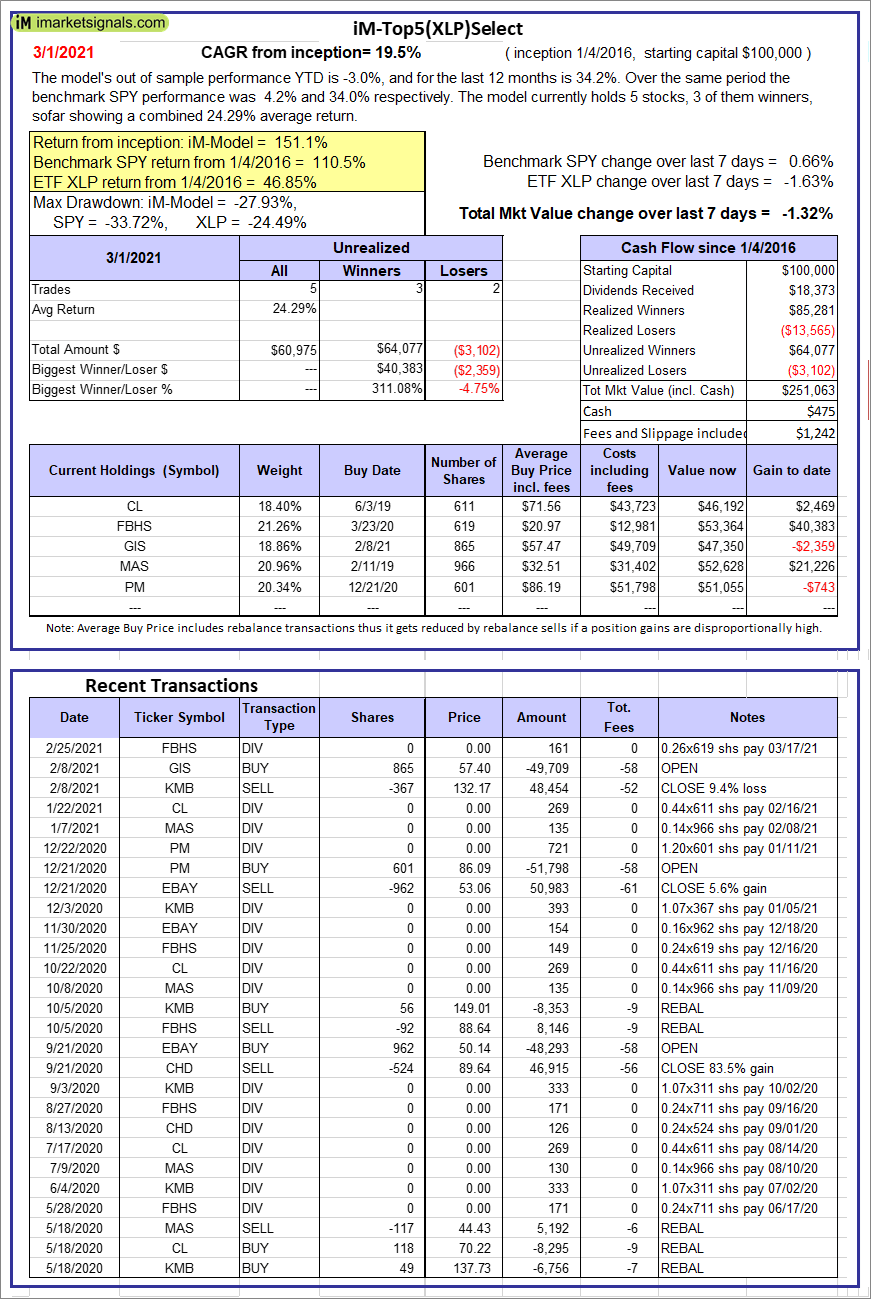 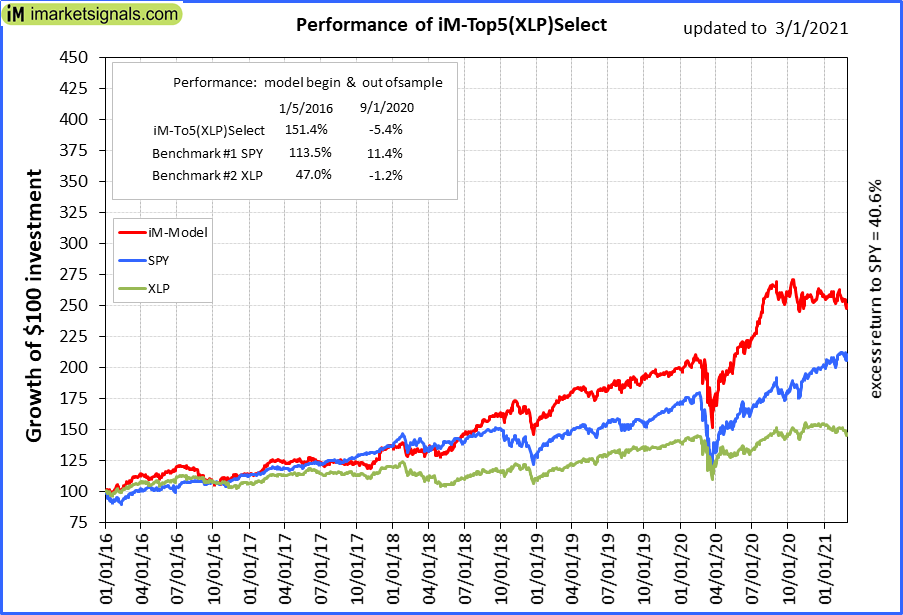 |
iM-Top5(XLP)Select: Since inception, on 1/5/2016, the model gained 151.06% while the benchmark SPY gained 110.47% over the same period. Over the previous week the market value of iM-Top5(XLP)Select gained -1.32% at a time when SPY gained 0.66%. A starting capital of $100,000 at inception on 1/5/2016 would have grown to $251,063 which includes $475 cash and excludes $1,242 spent on fees and slippage. |
 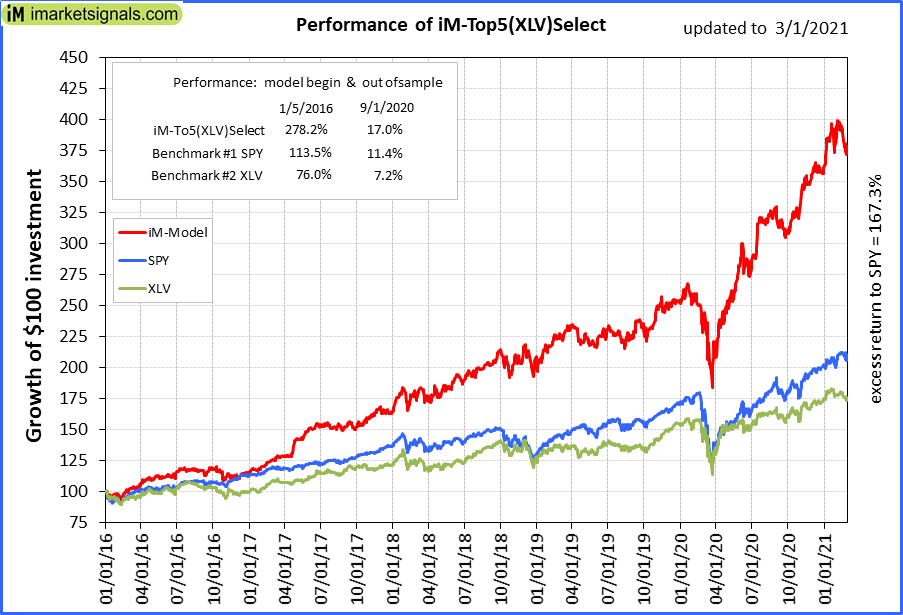 |
iM-Top5(XLV)Select: Since inception, on 1/5/2016, the model gained 277.75% while the benchmark SPY gained 110.47% over the same period. Over the previous week the market value of iM-Top5(XLV)Select gained -0.36% at a time when SPY gained 0.66%. A starting capital of $100,000 at inception on 1/5/2016 would have grown to $377,749 which includes $2,311 cash and excludes $5,042 spent on fees and slippage. |
 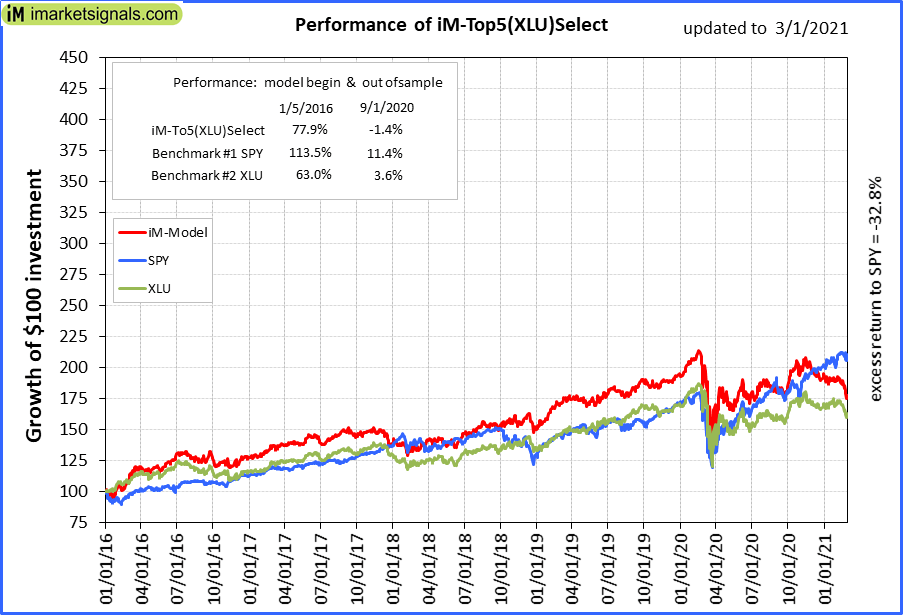 |
iM-Top5(XLU)Select: Since inception, on 1/5/2016, the model gained 77.65% while the benchmark SPY gained 110.47% over the same period. Over the previous week the market value of iM-Top5(XLU)Select gained -0.36% at a time when SPY gained 0.66%. A starting capital of $100,000 at inception on 1/5/2016 would have grown to $177,648 which includes $2,228 cash and excludes $6,781 spent on fees and slippage. |
 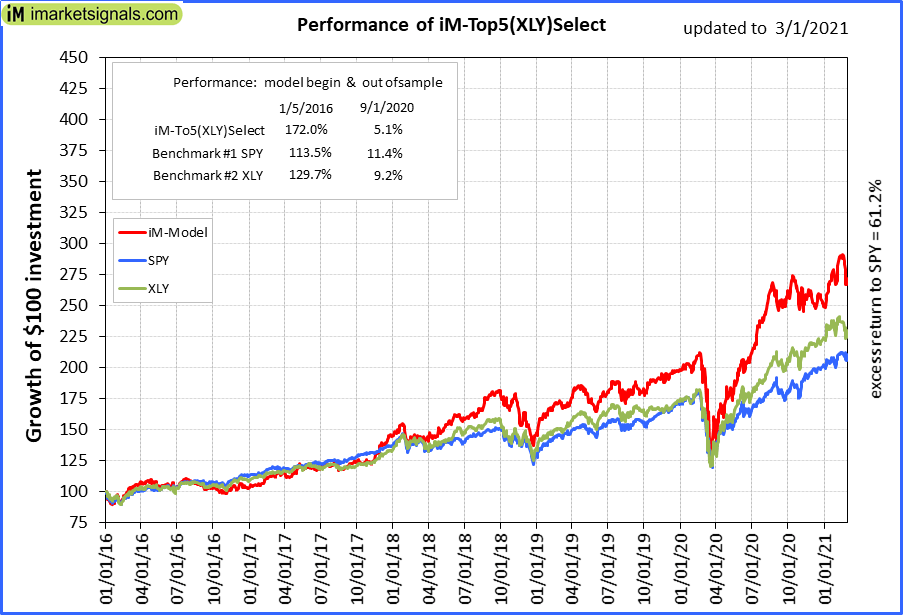 |
iM-Top5(XLY)Select: Since inception, on 1/5/2016, the model gained 171.69% while the benchmark SPY gained 110.47% over the same period. Over the previous week the market value of iM-Top5(XLY)Select gained -0.36% at a time when SPY gained 0.66%. A starting capital of $100,000 at inception on 1/5/2016 would have grown to $271,687 which includes $1,433 cash and excludes $2,742 spent on fees and slippage. |
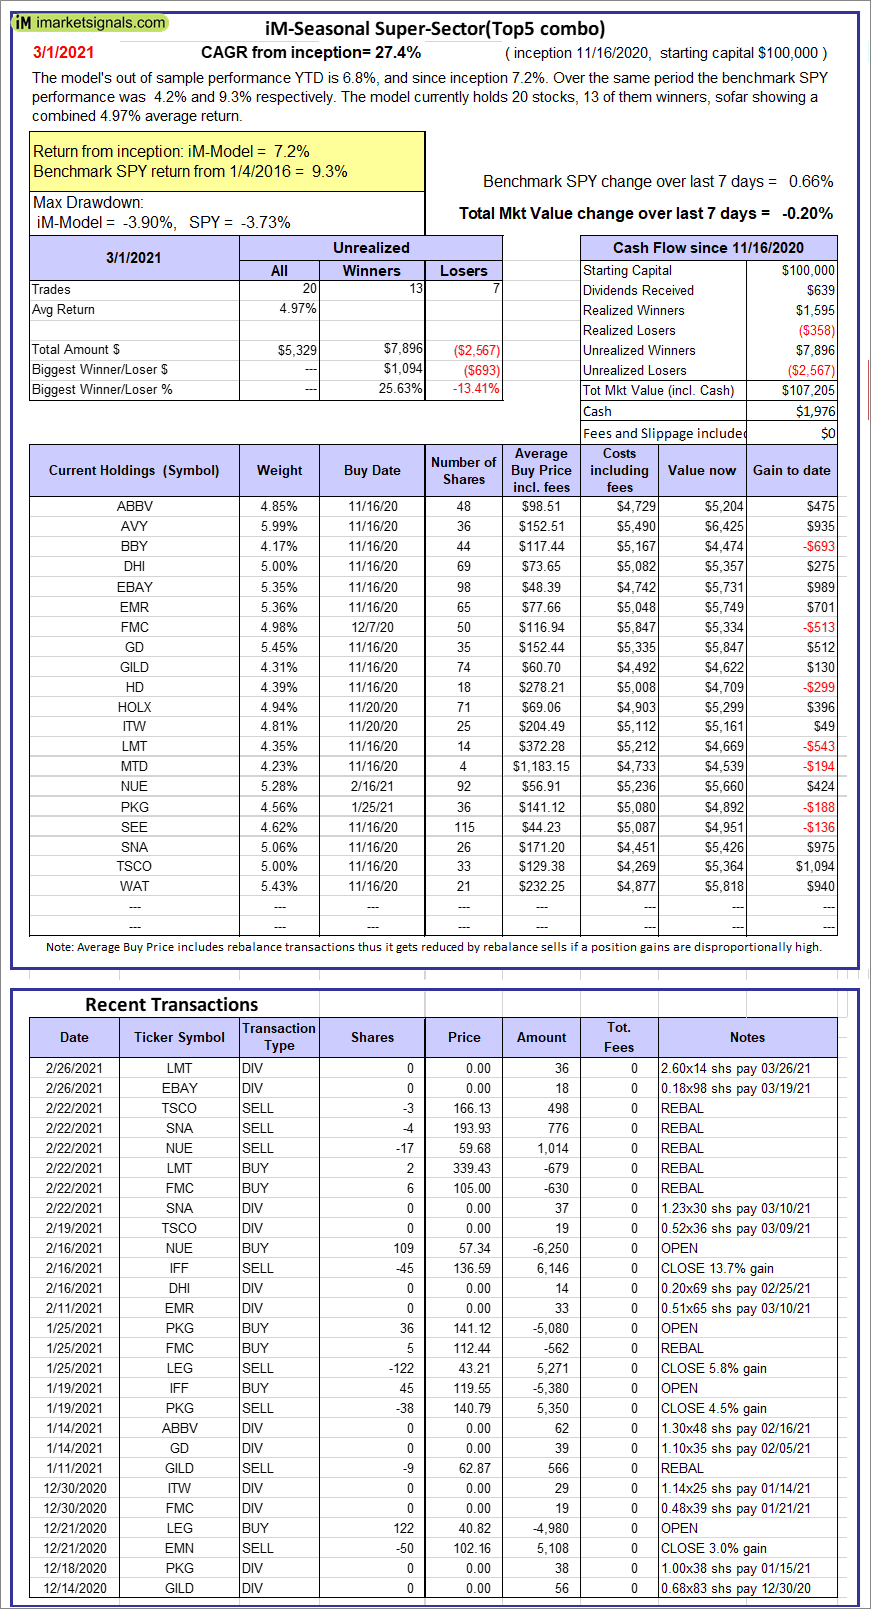 |
iM-Seasonal Super-Sectors (Top5 combo) : Since inception, on 11/17/2020, the model gained 7.20% while the benchmark SPY gained 9.25% over the same period. Over the previous week the market value of iM-Seasonal Super-Sectors (Top5 combo) gained -0.20% at a time when SPY gained 0.66%. A starting capital of $100,000 at inception on 11/17/2020 would have grown to $107,205 which includes $1,976 cash and excludes $00 spent on fees and slippage. |
 |
iM-Dividend Growth Portfolio: The model’s out of sample performance YTD is 7.7%, and for the last 12 months is 63.3%. Over the same period the benchmark SPY performance was 4.2% and 34.0% respectively. Over the previous week the market value of the iM-Dividend Growth Portfolio gained -0.93% at a time when SPY gained 0.66%. A starting capital of $100,000 at inception on 6/30/2016 would have grown to $364,734 which includes $499 cash and excludes $6,451 spent on fees and slippage. |
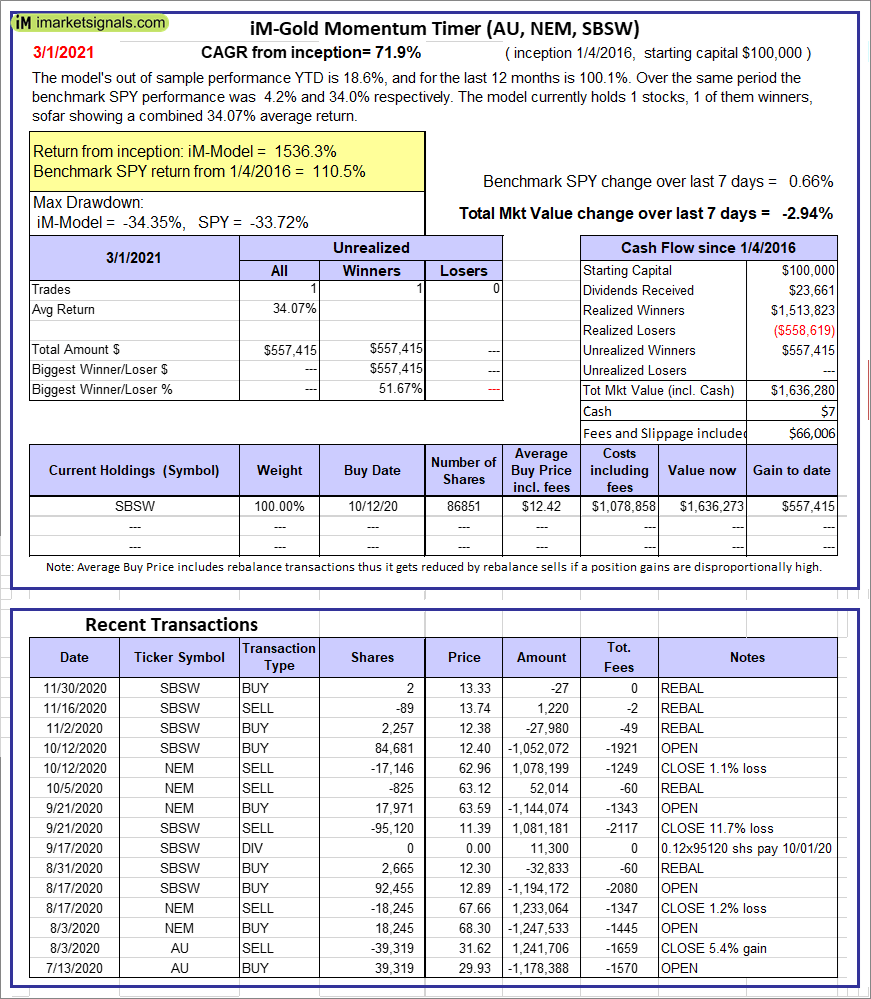 |
iM-Gold Momentum Timer (AU, NEM, SBSW): The model’s out of sample performance YTD is 18.6%, and for the last 12 months is 100.1%. Over the same period the benchmark SPY performance was 4.2% and 34.0% respectively. Over the previous week the market value of iM-Gold Momentum Timer (AU, NEM, SBSW) gained -2.94% at a time when SPY gained 0.66%. A starting capital of $100,000 at inception on 6/30/2016 would have grown to $07 which includes $66,006 cash and excludes Gain to date spent on fees and slippage. |
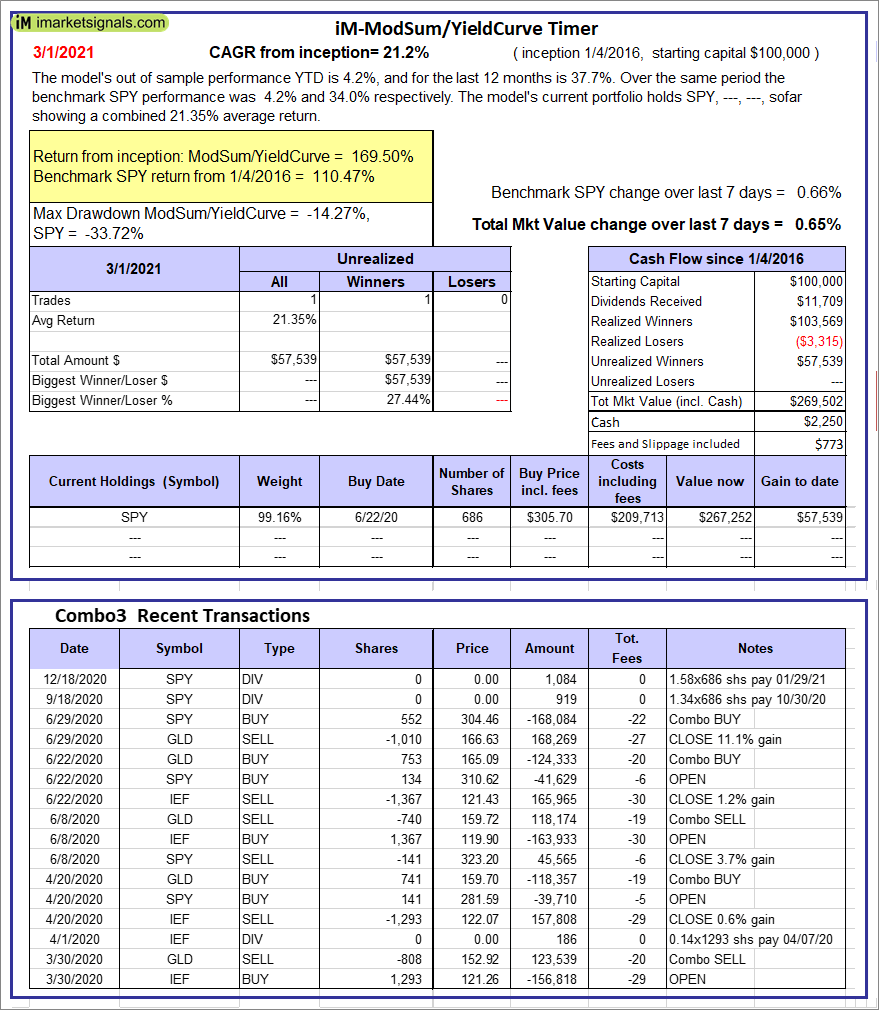 |
iM-ModSum/YieldCurve Timer: The model’s out of sample performance YTD is 4.2%, and for the last 12 months is 37.7%. Over the same period the benchmark SPY performance was 4.2% and 34.0% respectively. Over the previous week the market value of iM-PortSum/YieldCurve Timer gained 0.65% at a time when SPY gained 0.66%. A starting capital of $100,000 at inception on 1/1/2016 would have grown to $269,502 which includes $2,250 cash and excludes $773 spent on fees and slippage. |
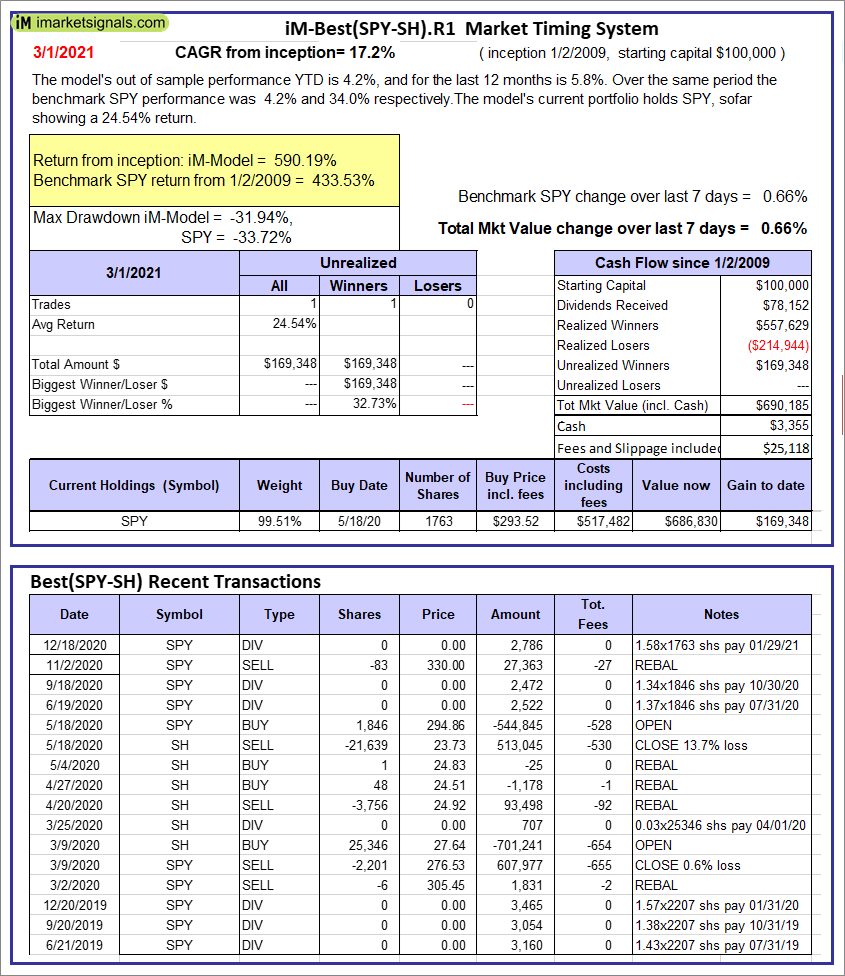 |
iM-Best(SPY-SH).R1: The model’s out of sample performance YTD is 4.2%, and for the last 12 months is 5.8%. Over the same period the benchmark SPY performance was 4.2% and 34.0% respectively. Over the previous week the market value of Best(SPY-SH) gained 0.66% at a time when SPY gained 0.66%. A starting capital of $100,000 at inception on 1/2/2009 would have grown to $690,185 which includes $3,355 cash and excludes $25,118 spent on fees and slippage. |
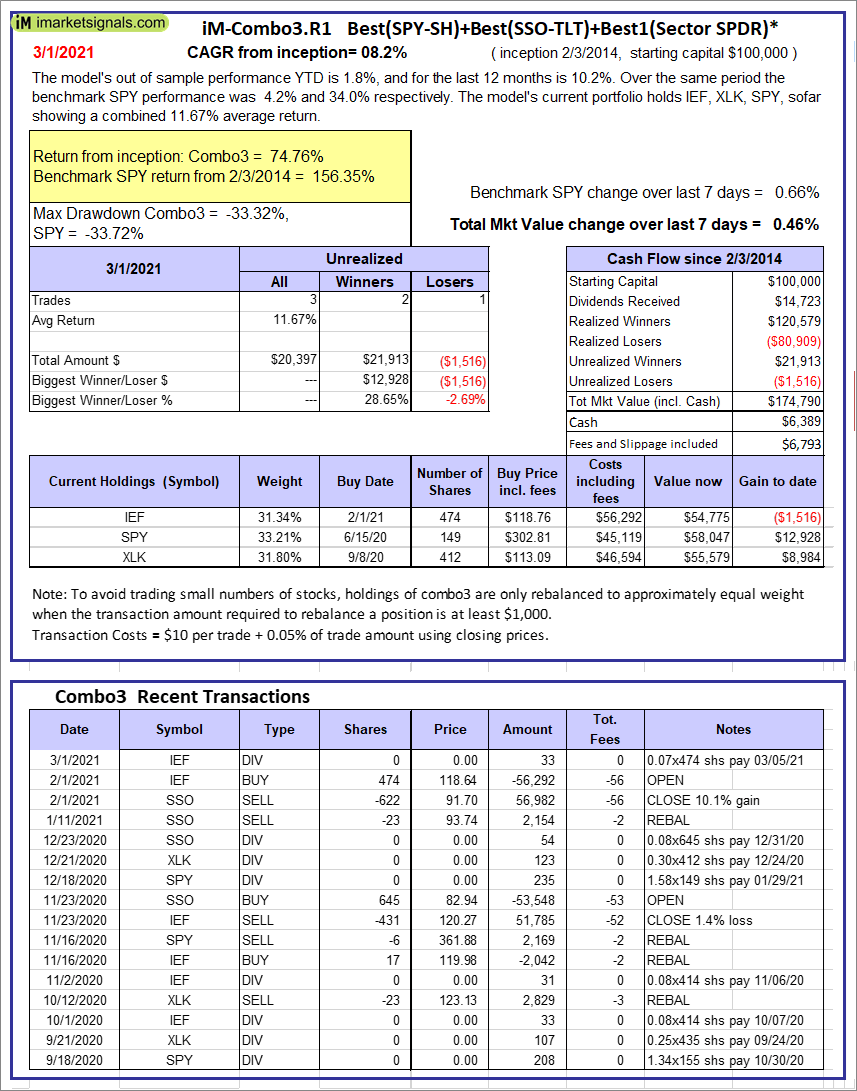 |
iM-Combo3.R1: The model’s out of sample performance YTD is 1.8%, and for the last 12 months is 10.2%. Over the same period the benchmark SPY performance was 4.2% and 34.0% respectively. Over the previous week the market value of iM-Combo3.R1 gained 0.46% at a time when SPY gained 0.66%. A starting capital of $100,000 at inception on 2/3/2014 would have grown to $174,790 which includes $6,389 cash and excludes $6,793 spent on fees and slippage. |
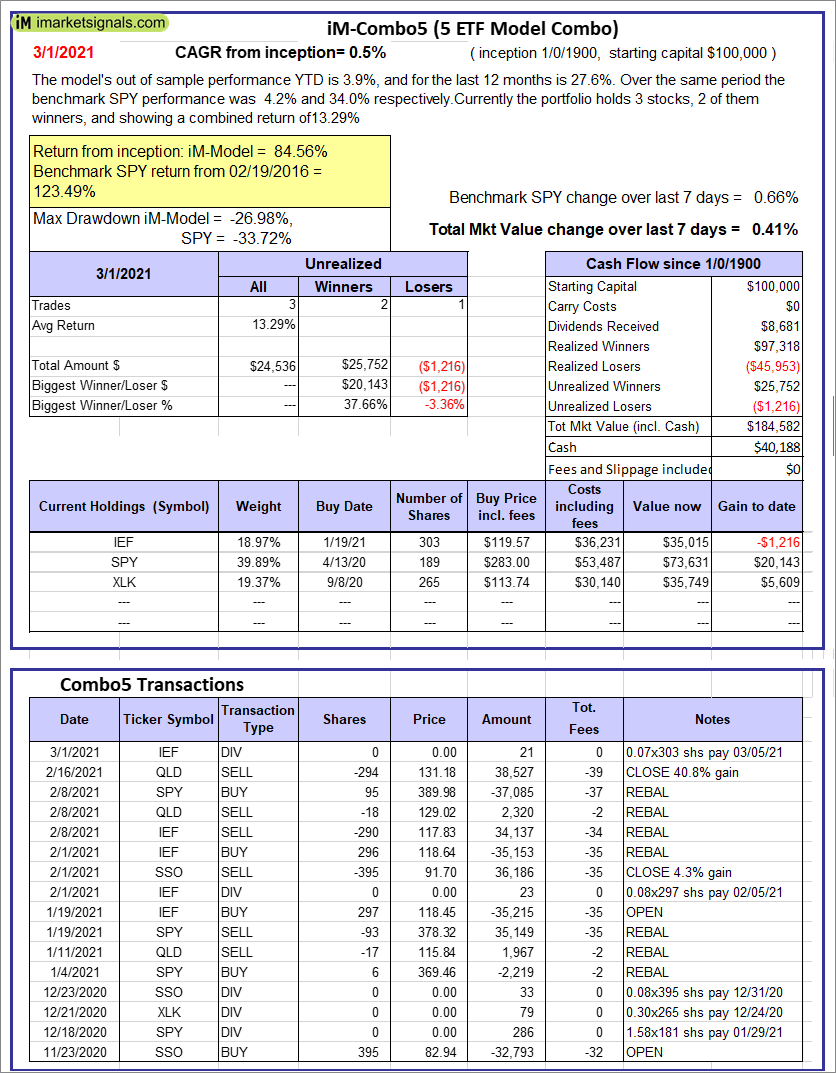 |
iM-Combo5: The model’s out of sample performance YTD is 3.9%, and for the last 12 months is 27.6%. Over the same period the benchmark SPY performance was 4.2% and 34.0% respectively. Over the previous week the market value of iM-Combo5 gained 0.41% at a time when SPY gained 0.66%. A starting capital of $100,000 at inception on 2/22/2016 would have grown to $184,582 which includes $40,188 cash and excludes $0 spent on fees and slippage. |
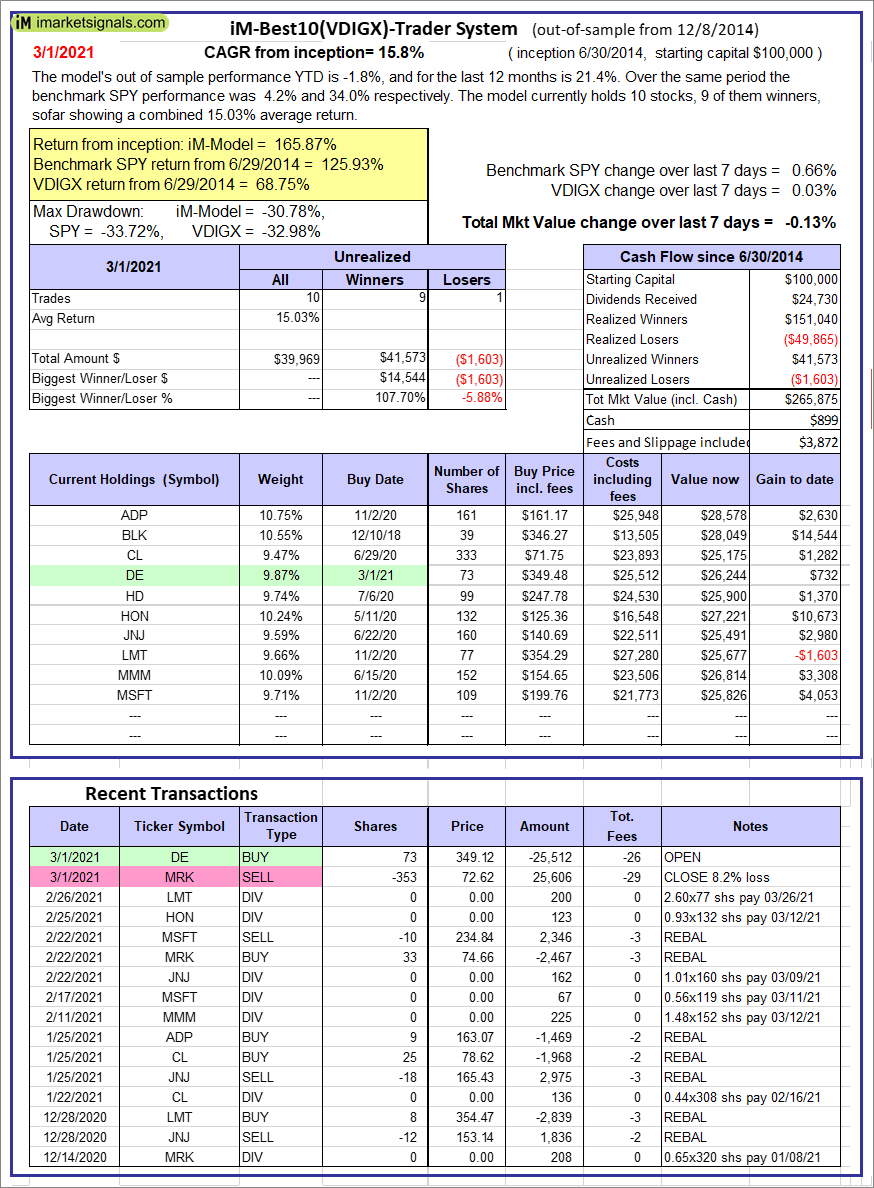 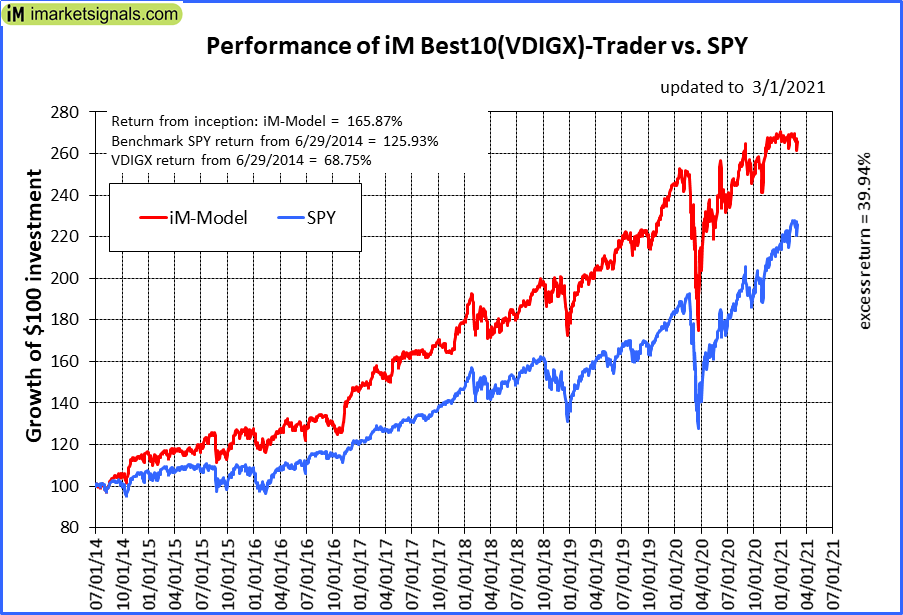 |
iM-Best10(VDIGX)-Trader: The model’s out of sample performance YTD is -1.8%, and for the last 12 months is 21.4%. Over the same period the benchmark SPY performance was 4.2% and 34.0% respectively. Since inception, on 7/1/2014, the model gained 165.87% while the benchmark SPY gained 125.93% and VDIGX gained 68.75% over the same period. Over the previous week the market value of iM-Best10(VDIGX) gained -0.13% at a time when SPY gained 0.66%. A starting capital of $100,000 at inception on 7/1/2014 would have grown to $265,875 which includes $899 cash and excludes $3,872 spent on fees and slippage. |
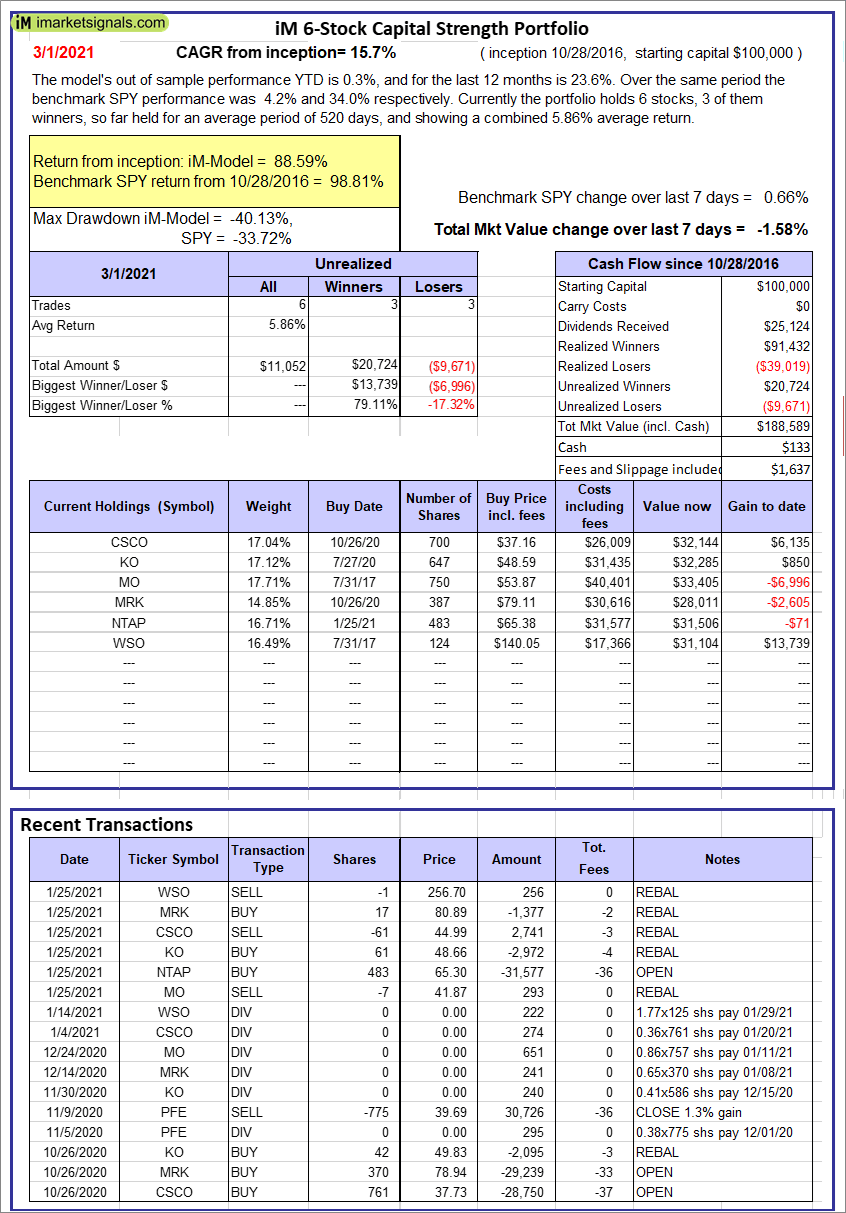 |
iM 6-Stock Capital Strength Portfolio: The model’s out of sample performance YTD is 0.3%, and for the last 12 months is 23.6%. Over the same period the benchmark SPY performance was 4.2% and 34.0% respectively. Over the previous week the market value of the iM 6-Stock Capital Strength Portfolio gained -1.58% at a time when SPY gained 0.66%. A starting capital of $100,000 at inception on 10/28/2016 would have grown to $188,589 which includes $133 cash and excludes $1,637 spent on fees and slippage. |
 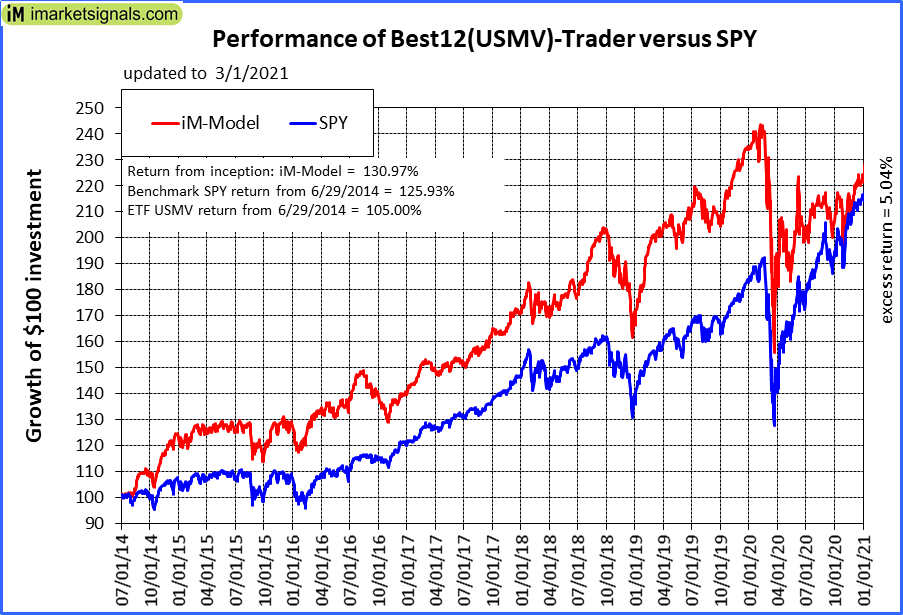 |
iM-Best12(USMV)-Trader: The model’s out of sample performance YTD is 3.0%, and for the last 12 months is 9.3%. Over the same period the benchmark SPY performance was 4.2% and 34.0% respectively. Since inception, on 6/30/2014, the model gained 130.97% while the benchmark SPY gained 125.93% and the ETF USMV gained 105.00% over the same period. Over the previous week the market value of iM-Best12(USMV)-Trader gained 0.82% at a time when SPY gained 0.66%. A starting capital of $100,000 at inception on 6/30/2014 would have grown to $230,969 which includes $398 cash and excludes $7,197 spent on fees and slippage. |
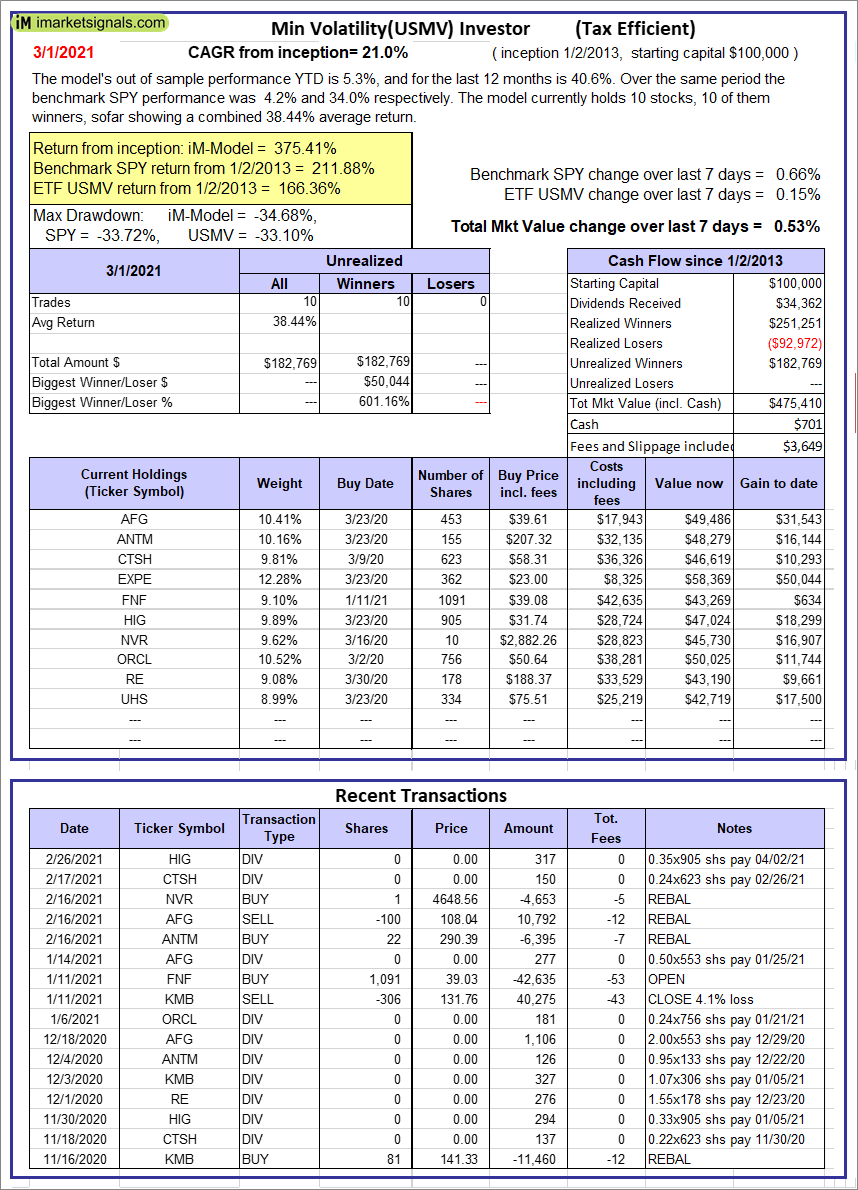 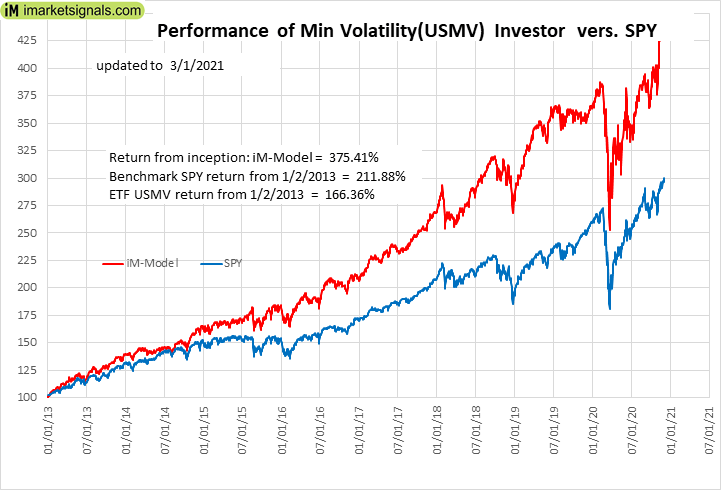 |
iM-Min Volatility(USMV) Investor (Tax Efficient): The model’s out of sample performance YTD is 5.3%, and for the last 12 months is 40.6%. Over the same period the benchmark SPY performance was 4.2% and 34.0% respectively. Since inception, on 1/3/2013, the model gained 375.41% while the benchmark SPY gained 211.88% and the ETF USMV gained 166.36% over the same period. Over the previous week the market value of iM-Best12(USMV)Q1 gained 0.53% at a time when SPY gained 0.66%. A starting capital of $100,000 at inception on 1/3/2013 would have grown to $475,410 which includes $701 cash and excludes $3,649 spent on fees and slippage. |
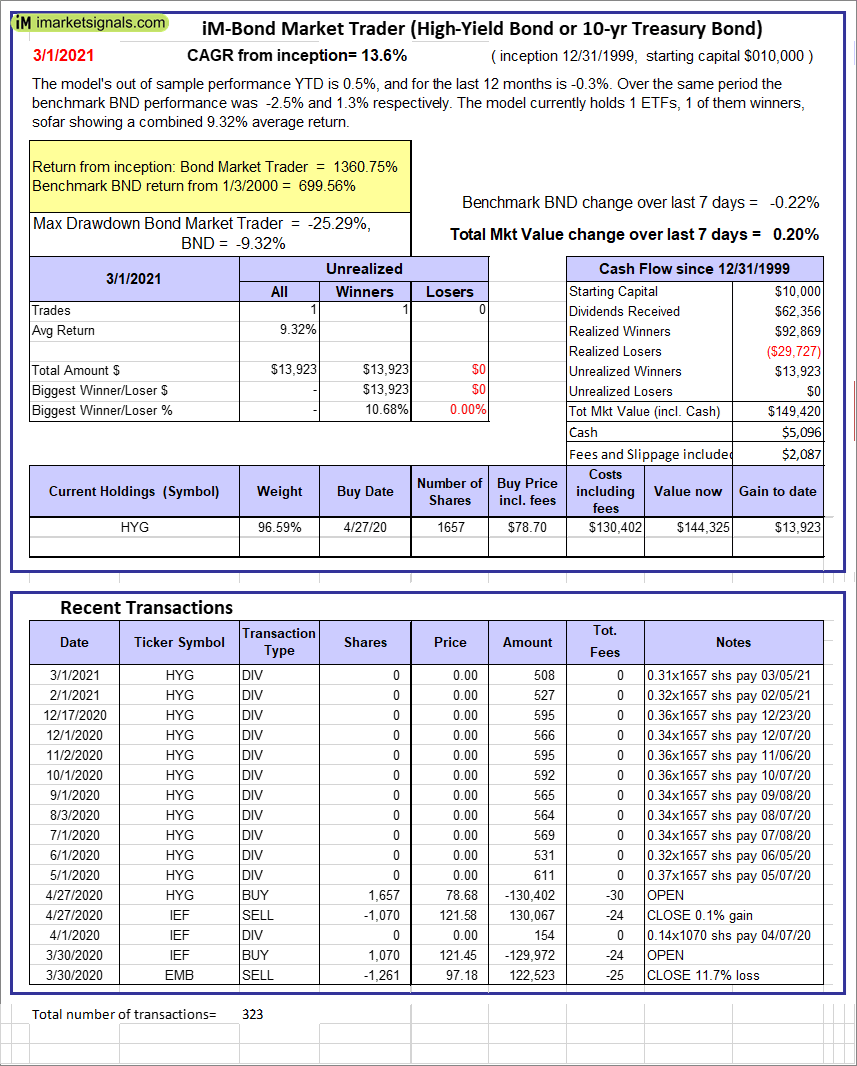 |
iM-Bond Market Trader (High-Yield Bond or 10-yr Treasury Bond): The model’s out of sample performance YTD is 0.5%, and for the last 12 months is -0.3%. Over the same period the benchmark BND performance was -2.5% and 1.3% respectively. Over the previous week the market value of the iM-Bond Market Trader (High-Yield Bond or 10-yr Treasury Bond) gained 0.20% at a time when BND gained -0.22%. A starting capital of $10,000 at inception on 1/3/2000 would have grown to $149,420 which includes $5,096 cash and excludes $2,087 spent on fees and slippage. |
|
|
iM-ModSum/YieldCurve Timer: The model’s out of sample performance YTD is 4.2%, and for the last 12 months is 37.7%. Over the same period the benchmark SPY performance was 4.2% and 34.0% respectively. Over the previous week the market value of iM-PortSum/YieldCurve Timer gained 0.65% at a time when SPY gained 0.66%. A starting capital of $100,000 at inception on 1/1/2016 would have grown to $269,502 which includes $2,250 cash and excludes $773 spent on fees and slippage. |
 |
iM-Best2 MC-Score ETF System: The model’s out of sample performance YTD is -3.3%, and for the last 12 months is 8.9%. Over the same period the benchmark SPY performance was 4.2% and 34.0% respectively. Over the previous week the market value of the iM-Best2 MC-Score ETF System gained -0.72% at a time when SPY gained 0.66%. A starting capital of $100,000 at inception on 6/30/2016 would have grown to $126,952 which includes $1,546 cash and excludes $1,386 spent on fees and slippage. |
 |
iM-Best4 MC-Score Vanguard System: The model’s out of sample performance YTD is 1.4%, and for the last 12 months is 15.2%. Over the same period the benchmark SPY performance was 4.2% and 34.0% respectively. Over the previous week the market value of the iM-Best4 MC-Score Vanguard System gained -0.83% at a time when SPY gained 0.66%. A starting capital of $100,000 at inception on 6/30/2016 would have grown to $136,321 which includes $2,385 cash and excludes $00 spent on fees and slippage. |
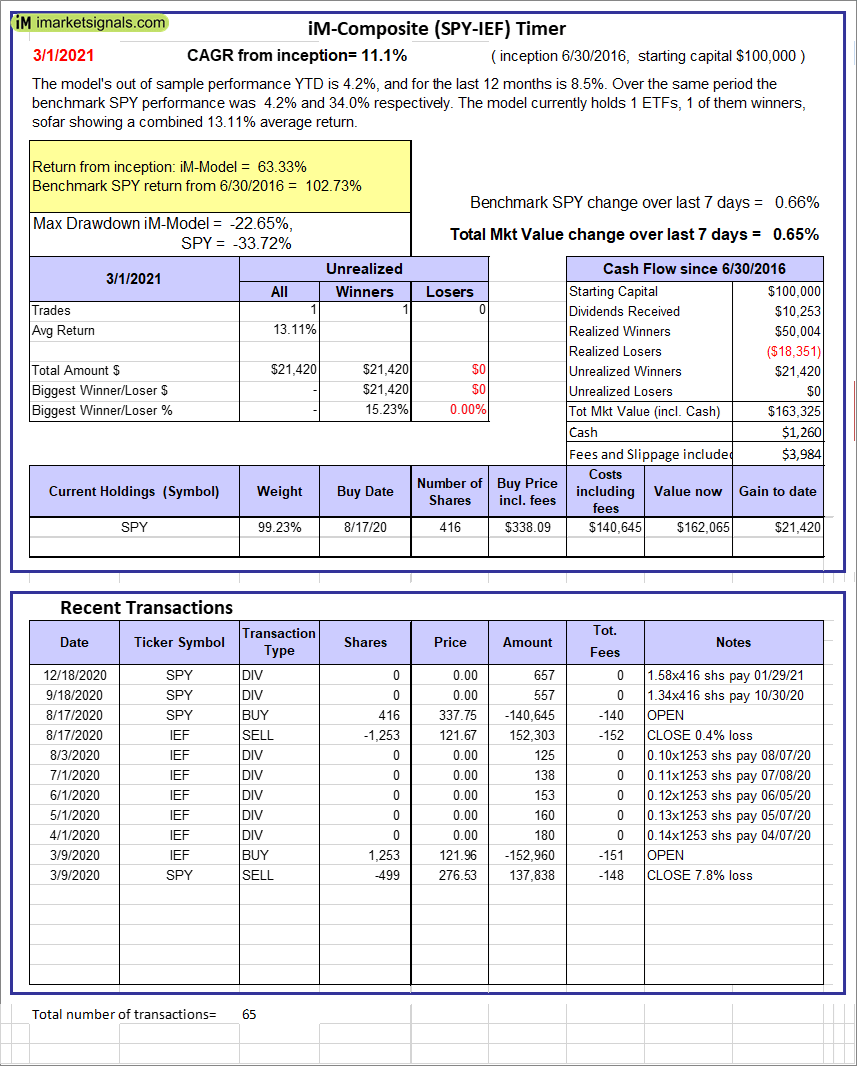 |
iM-Composite (SPY-IEF) Timer: The model’s out of sample performance YTD is 4.2%, and for the last 12 months is 8.5%. Over the same period the benchmark SPY performance was 4.2% and 34.0% respectively. Over the previous week the market value of the iM-Composite (SPY-IEF) Timer gained 0.65% at a time when SPY gained 0.66%. A starting capital of $100,000 at inception on 6/30/2016 would have grown to $163,325 which includes $1,260 cash and excludes $3,984 spent on fees and slippage. |
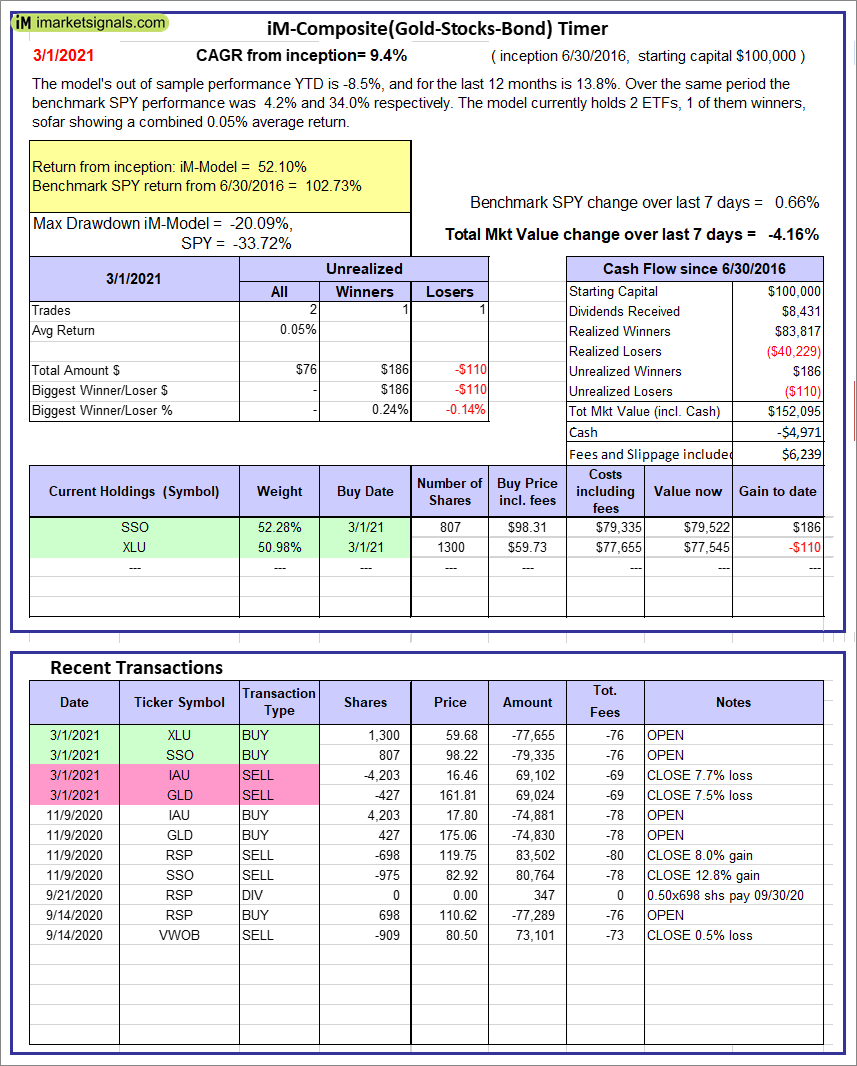 |
iM-Composite(Gold-Stocks-Bond) Timer: The model’s out of sample performance YTD is -8.5%, and for the last 12 months is 13.8%. Over the same period the benchmark SPY performance was 4.2% and 34.0% respectively. Over the previous week the market value of the iM-Composite(Gold-Stocks-Bond) Timer gained -4.16% at a time when SPY gained 0.66%. A starting capital of $100,000 at inception on 6/30/2016 would have grown to $152,095 which includes -$4,971 cash and excludes $6,239 spent on fees and slippage. |
iM-Best Reports – 3/1/21
Posted in pmp SPY-SH
Leave a Reply
You must be logged in to post a comment.