
- Goldman Sachs reported that only 25 stocks accounted for 58% of the index’s 2021 gains, including reinvested dividends, through Dec-9-2021.
- One can verify the accuracy of this list by ranking the S&P 500 stocks on the factor “Market Capitalization x 1-year Rate-of-Change”, with higher being better.
- Backtesting to Jan-2000 shows that buying the 25 highest ranked stocks every year at the end of December would have approximately matched the performance of SPY over the backtest period.
- However, investing similarly in the 25 highest ranked stocks of the lower two terciles of the ranked S&P 500 would have provided over 3-times the total return of SPY.
- The list of 25 S&P 500 stocks to hold during 2022 is given in Appendix-2, which is expected to provide higher returns to Dec-2022 than the Goldman Sachs list.
(Tercile is a third of a ranked population, the lower two terciles of the ranked S&P500 discards the top third)
The 25-stock Goldman Sachs list of Dec-9-2021 (GS-List) is reproduced in the first table of this article which hi-lights the heavy concentration of money in the largest tech companies, by market capitalization. Also read this relevant commentary by Kim Khan, senior news editor at Seeking Alpha.
A list similar to the GS-List can be created by ranking the S&P 500 stocks on the factor “Market Capitalization x 1-year Rate-of-Change” (the ranked S&P 500) and selecting the 25 highest ranked stocks.
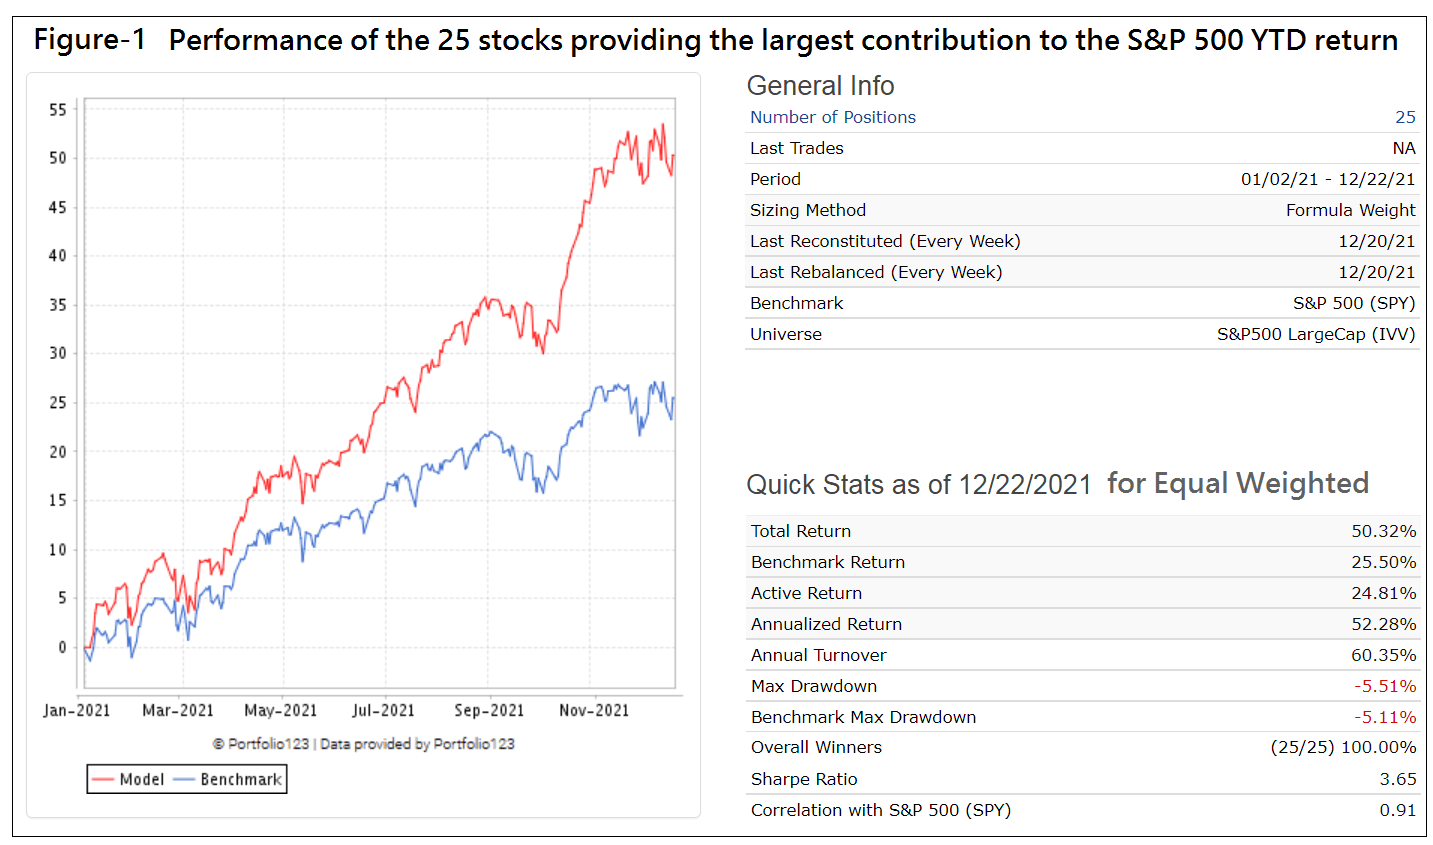
Performance of the Goldman Sachs list from Jan-2021 to Dec-2021
The analysis was performed on the online portfolio simulation platform Portfolio 123 which provides historic financial data for stocks, bonds and ETFs. All backtests in this article are for equal weighted stock holdings and a yearly management fee of 0.2% deducted from the returns.
Figure-1 is a plot of the performance since Jan-2-2021 of the GS-List of 25 stocks that have made the largest contribution to the index’s 2021 return. It shows the survivorship biased 50.3% year-to-date return, versus 25.5% for the benchmark SPY.
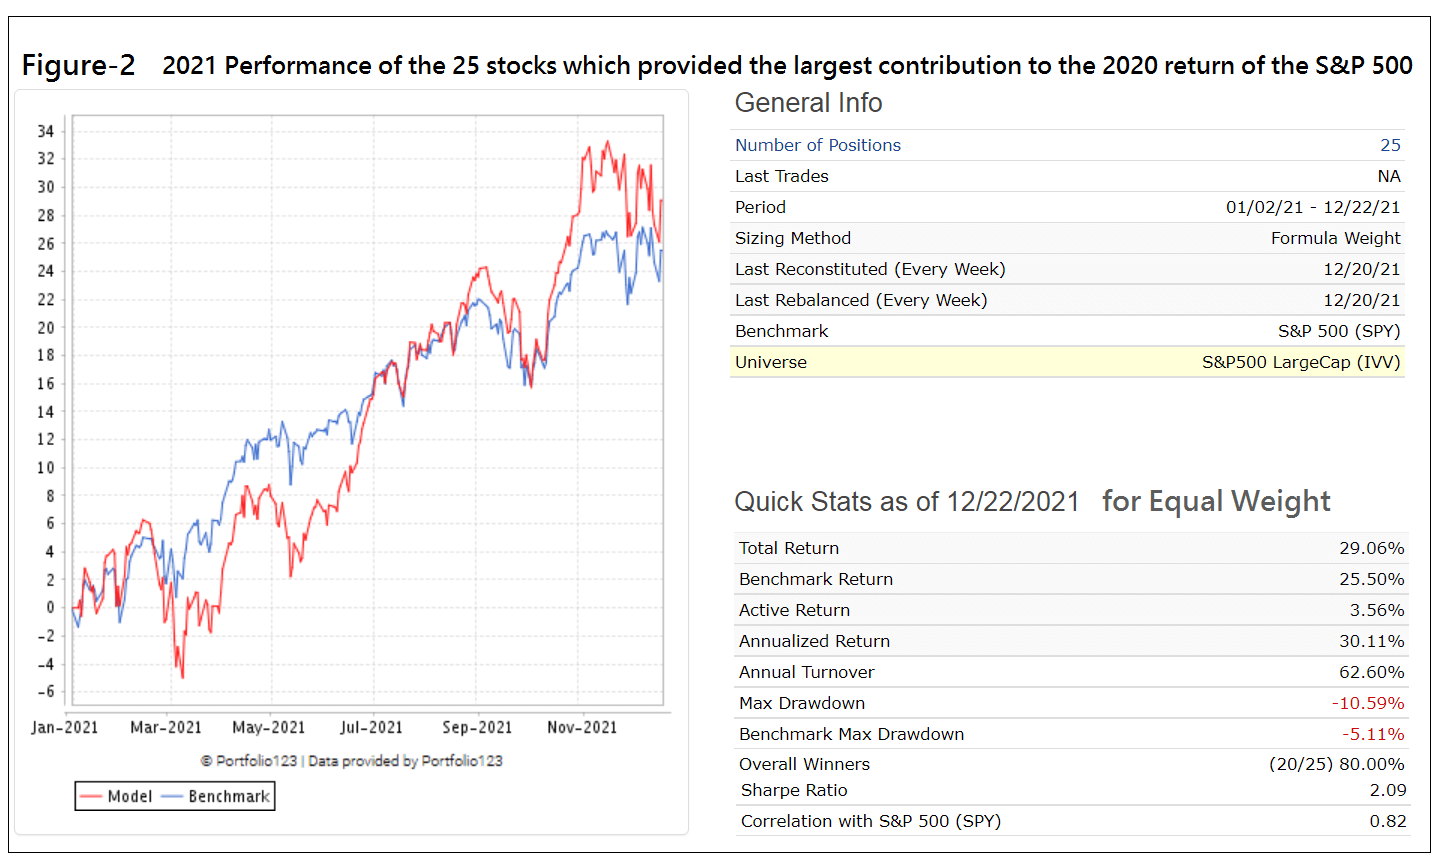
2021 Performance of the 25 stocks that made the largest contribution to the index’s 2020 return
The GS-List would have been different at the end 2020 as it would have contained the 25 highest ranked stocks of the ranked S&P 500 at the end of December 2020. The 2021 return of this list is not survivorship biased; 29.0% year-to-date, versus 25.5% for the benchmark SPY, as shown in Figure-2.
The listing is in Appendix-1 and contains 13 stocks of the GS-List of 12/9/2021 which accounted for 45% of the S&P 500’s YTD 2021 return, and included all the five stocks which accounted for most of the return, MSFT, GOOGL, AAPL, NVDA, and TSLA.
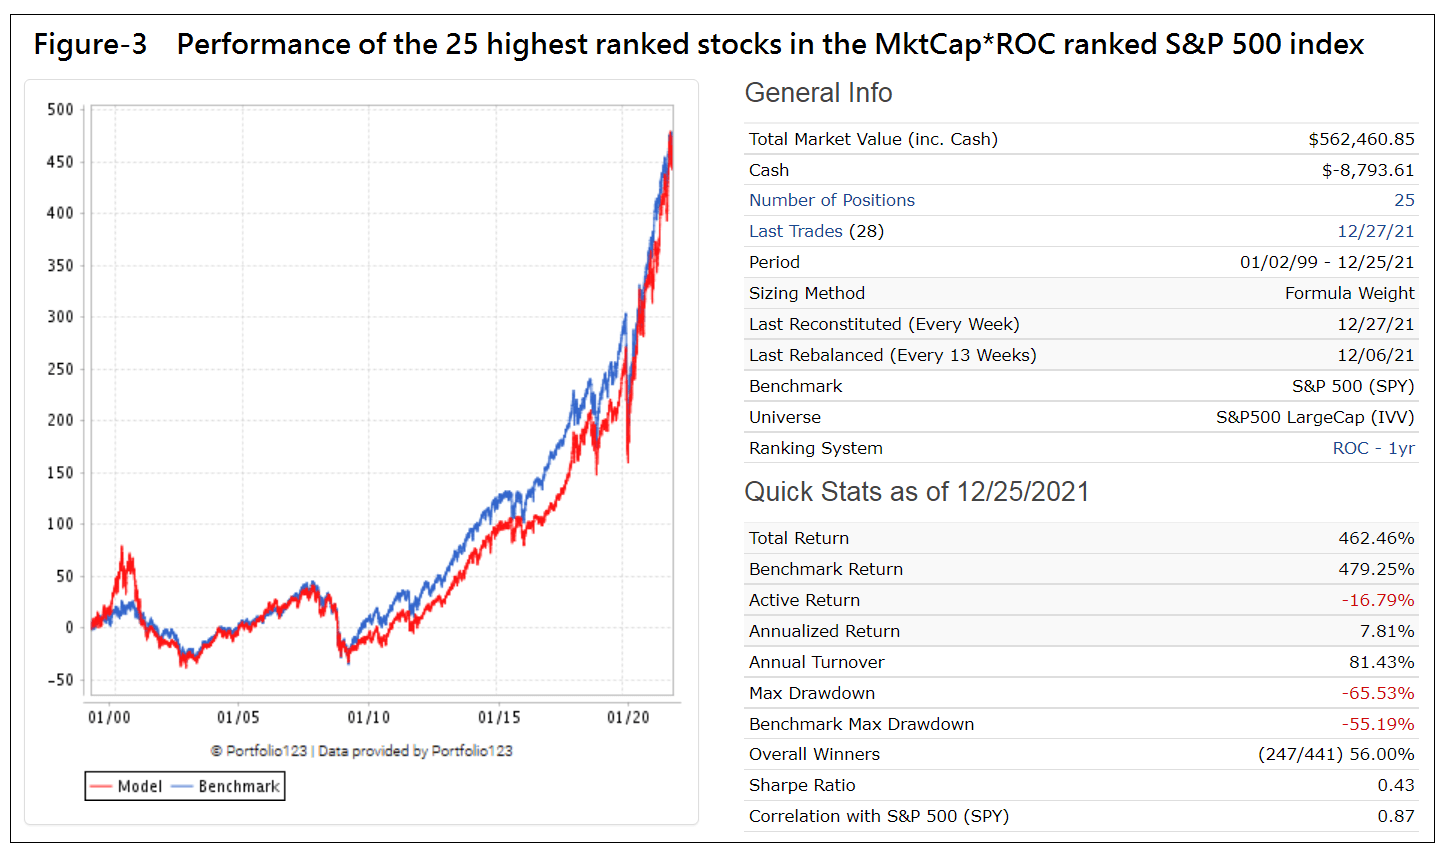
Performance from Jan-1999 to Dec-2021 of the 25 stocks that made the largest contribution to the index’s preceding year annual return
Figure-3 shows the simulated performance from 1/2/1999 to 12/23/2021 for a strategy that annually buys the 25 stocks that have made the largest contribution to the S&P 500 preceding one year return (on the first trading day of the fourth week of December) and simultaneously sells the stocks which are no longer in the top 25. Similar to the one year performance, this strategy would only have matched the performance of SPY over the last 23 years.
This is not a good investment strategy; the maximum drawdown would have been -65% and it would have been better to just hold SPY over this period.
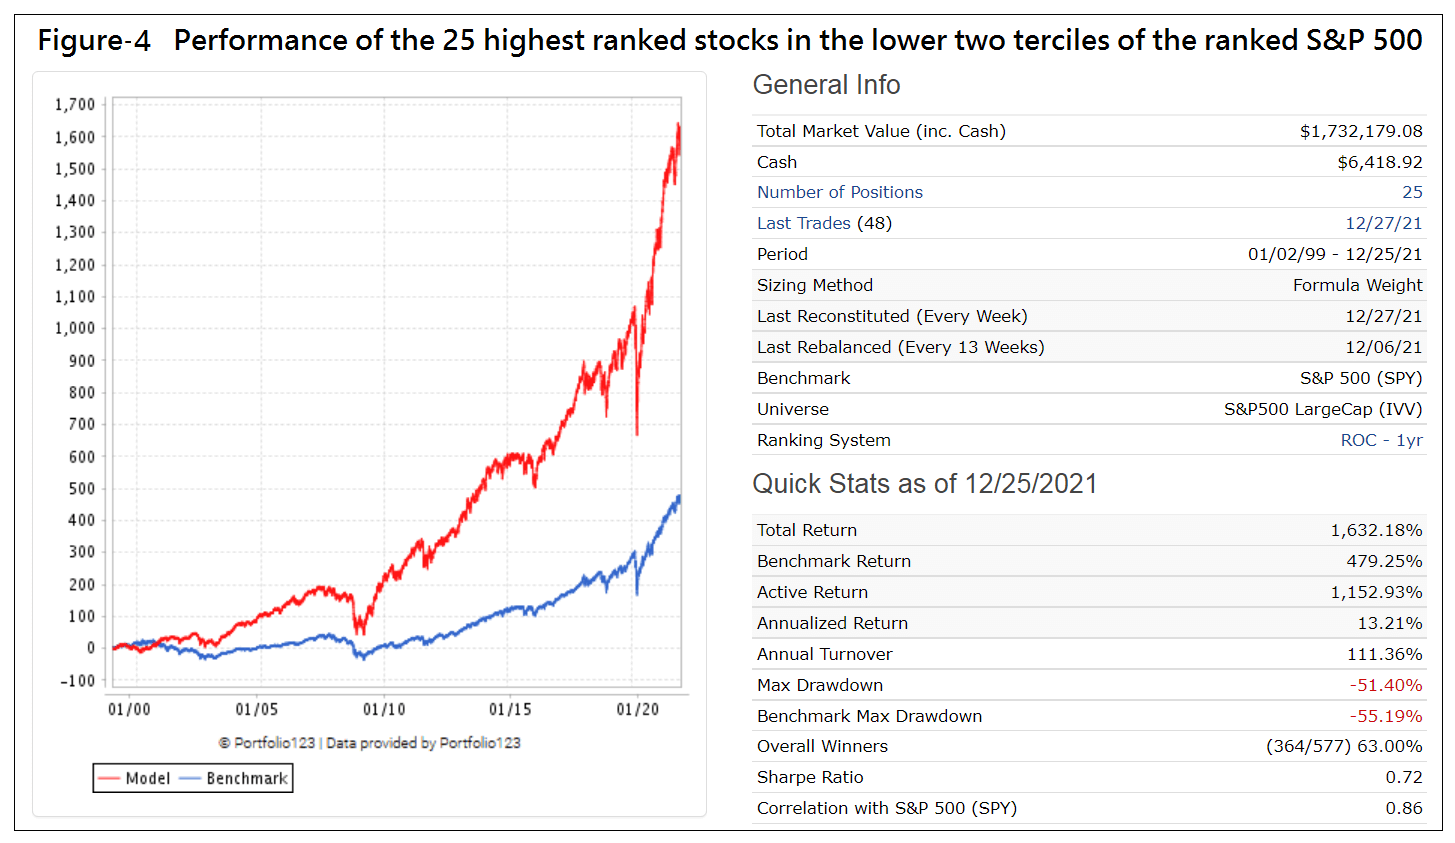
Performance from Jan-1999 to Dec-2021 of the 25 highest ranked stocks of the lower two terciles of the ranked S&P 500
Better returns are obtained by annually investing in the 25 highest ranked stocks of the lower two terciles of the ranked S&P 500, as shown in Figure-4. This would have, with trading only at the end of each year, provided a total return 3.4-times higher than that of SPY, or an annualized return of 13.2%, versus 7.9% for SPY.
This should be a much better investment strategy than buy-and-hold SPY.
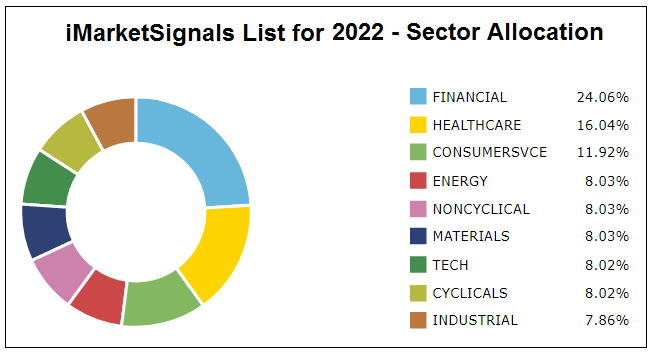
The current holdings as of 12/27/2021 are the 25 stocks the model will hold until the first trading day of the fourth week of December 2022. The listing is in Appendix-2, the iMarketSignals list for 2022, and the sector allocation is in the diagram below.
Conclusion
From the analysis it would appear that investing annually in the 25 highest ranked stocks of the lower two terciles of the ranked S&P 500 will produce far better returns than periodically investing in the group that has made the largest contribution to the twelve month return of the S&P 500.
Appendix-1:
The 25 stocks of the S&P 500 that have made the largest contribution to the index’s one year return to Jan-2-2021.
The 25 highest MktCap*ROC-ranked stocks of the S&P 500Generated on 1/2/2021. |
||||
| Ticker | Name | Rank | Pct YTD |
also in GS-List of Dec-9-2021 |
| TSLA | Tesla Inc | 99.8 | 38.24 | TSLA |
| AAPL | Apple Inc | 99.6 | 36.56 | AAPL |
| AMZN | Amazon.com Inc | 99.4 | 7.35 | AMZN |
| MSFT | Microsoft Corp | 99.2 | 54.34 | MSFT |
| NVDA | NVIDIA Corporation | 99.0 | 124.39 | NVDA |
| GOOGL | Alphabet Inc | 98.8 | 69.65 | GOOGL |
| PYPL | PayPal Holdings Inc | 98.6 | -17.35 | |
| FB | Meta Platforms Inc | 98.4 | 22.87 | FB |
| NFLX | Netflix Inc | 98.2 | 17.48 | |
| QCOM | QUALCOMM Inc. | 98.0 | 24.42 | |
| TMUS | T-Mobile US Inc | 97.8 | -8.96 | |
| ADBE | Adobe Inc | 97.6 | 16.2 | ADBE |
| AMD | Advanced Micro Devices Inc | 97.4 | 55.88 | |
| NOW | ServiceNow Inc | 97.2 | 22.23 | |
| WMT | Walmart Inc | 97.0 | -3.08 | |
| NKE | Nike Inc | 96.8 | 18.98 | |
| TMO | Thermo Fisher Scientific Inc | 96.6 | 38.4 | TMO |
| AVGO | Broadcom Inc | 96.4 | 58.66 | AVGO |
| DIS | Walt Disney Co (The) | 96.2 | -14.52 | |
| UNH | Unitedhealth Group Inc | 96.0 | 43.37 | UNH |
| UPS | United Parcel Service Inc | 95.8 | 29.99 | |
| V | Visa Inc | 95.6 | 0.71 | |
| DHR | Danaher Corp | 95.4 | 43.56 | DHR |
| HD | Home Depot Inc. (The) | 95.2 | 53.04 | HD |
| CRM | salesforce.com Inc | 95.0 | 14.75 | |
Appendix-2: iMarketSignals List for 2022
The 25 highest ranked stocks of the lower two terciles of the ranked S&P 500 index as of 12/27/2021 |
||||
| Ticker | Name | Rank | Market Cap $-B |
Sector |
| AFL | AFLAC Inc | 62.5 | 38.2 | Finance |
| ALB | Albemarle Corp | 63.5 | 26.7 | Non-Energy Materials |
| BKNG | Booking Holdings Inc | 63.3 | 98.6 | Consumer Services |
| BSX | Boston Scientific Corp | 63.9 | 60.9 | Healthcare |
| CDW | CDW Corp | 66.5 | 27.6 | Technology |
| CF | CF Industries Holdings Inc | 65.7 | 15.5 | Non-Energy Materials |
| DLR | Digital Realty Trust Inc | 62.3 | 48.2 | Finance |
| DRE | Duke Realty Corp | 65.3 | 23.8 | Finance |
| EQIX | Equinix Inc | 62.1 | 73.7 | Finance |
| ITW | Illinois Tool Works Inc. | 66.9 | 75.5 | Industrials |
| LEN | Lennar Corp | 64.5 | 34.7 | Consumer Cyclicals |
| LH | Laboratory Corp of America Holdings | 62.9 | 28.9 | Healthcare |
| MAR | Marriott International Inc | 64.7 | 53.8 | Consumer Services |
| MCHP | Microchip Technology Inc | 63.1 | 48.2 | Technology |
| MCK | McKesson Corp | 66.1 | 36.8 | Healthcare |
| MDLZ | Mondelez International Inc | 63.7 | 90.6 | Consumer Non-Cyclicals |
| OKE | ONEOK Inc | 65.9 | 25.9 | Energy |
| ROK | Rockwell Automation Inc. | 65.1 | 39.5 | Industrials |
| SBAC | SBA Communications Corp | 65.5 | 41.0 | Finance |
| SBUX | Starbucks Corp | 66.3 | 132.6 | Consumer Services |
| SLB | Schlumberger Ltd | 64.9 | 41.5 | Energy |
| SYK | Stryker Corp | 64.1 | 101.2 | Healthcare |
| TSCO | Tractor Supply Co | 64.3 | 26.0 | Consumer Cyclicals |
| WBA | Walgreens Boots Alliance Inc | 62.7 | 43.7 | Consumer Non-Cyclicals |
| WELL | Welltower Inc | 61.9 | 36.0 | Finance |
Hi Georg,
thanks for this model. Interesting concept, counterintuitive.
Can you provide numbers for NASDAQ oder NASDAQ 100 ?
Thanks.
For NASDAQ 100 = (ETF QQQ)
From 1999 to 2022 QQQ annualized return was 10.23% with a max D/D= -83%.
The top ranked 15 positions closely matched index return 9.43% with a max D/D= -84%.
When confining universe to the lower 2 terciles then the top ranked 15 positions’ annualized return would have been 14.33% with a max D/D= -83%.
Are the annual returns of the top 25 versus S&P available?
Calendar year (%)returns for model.
Year … Model … SPY
1999 … 2.73 … 20.39
2000 … 34.89 … -9.74
2001 … -1.33 … -11.76
2002 … -8.51 … -21.58
2003 … 38.11 … 28.18
2004 … 19.5 … 10.7
2005 … 10.79 … 4.83
2006 … 20.96 … 15.85
2007 … 5.25 … 5.15
2008 … -32.33 … -36.79
2009 … 67.8 … 26.35
2010 … 18.9 … 15.06
2011 … 4.1 … 1.89
2012 … 17.69 … 15.99
2013 … 34.73 … 32.31
2014 … 10.28 … 13.46
2015 … -0.99 … 1.23
2016 … 11.23 … 12
2017 … 24.69 … 21.71
2018 … -6.5 … -4.57
2019 … 28.84 … 31.22
2020 … 21.52 … 18.33
2021 … 28.83 … 28.73
Could you run this for the midcaps – MDY?
and how did this strategy work in 2022 vs the S&P500/