
  |
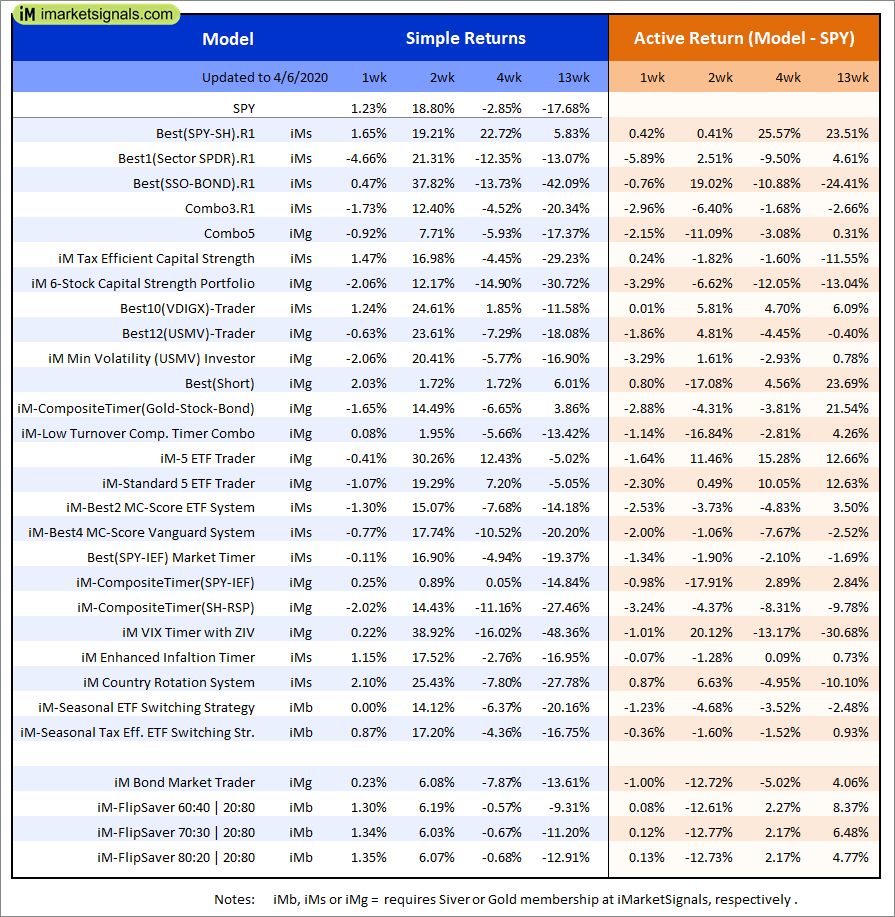
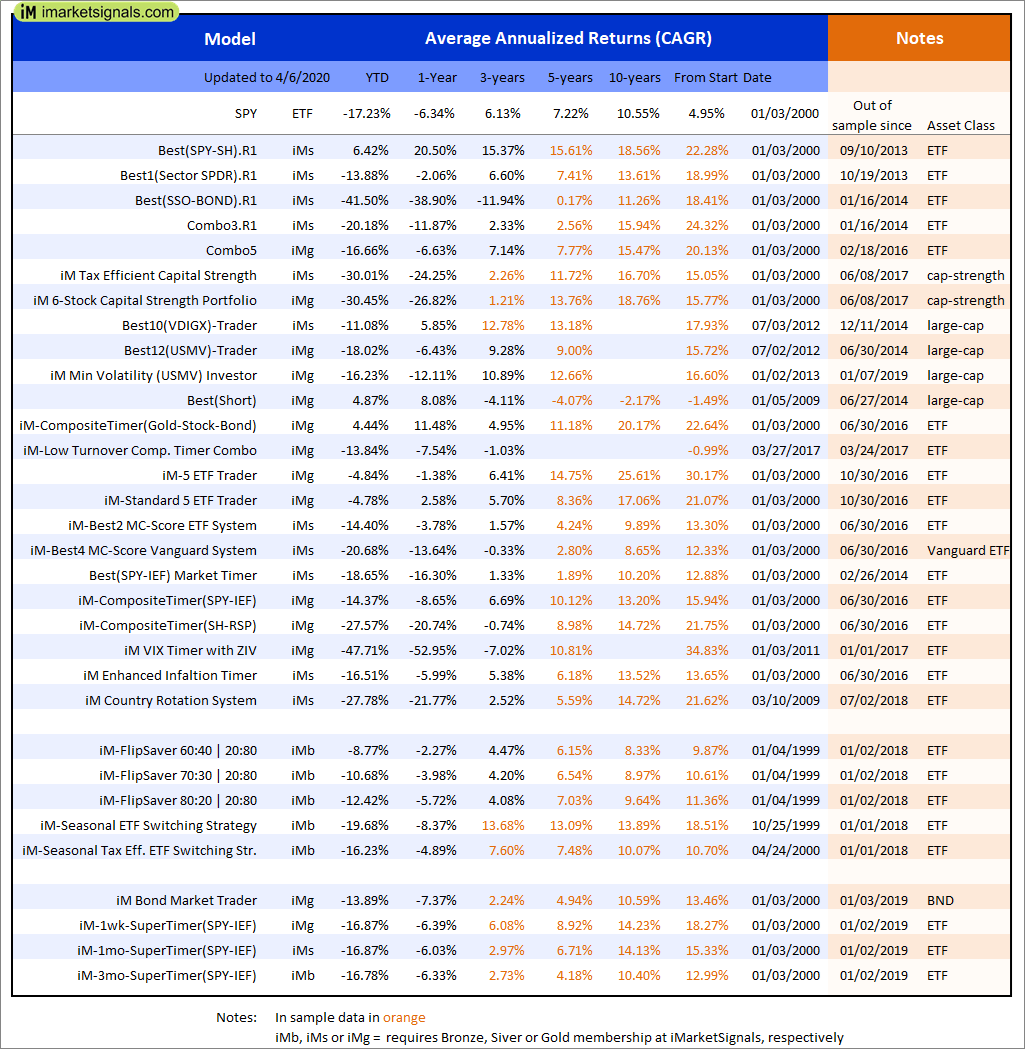
Out of sample performance summary of our models for the past 1, 2, 4 and 13 week periods. The active active return indicates how the models over- or underperformed the benchmark ETF SPY. Also the YTD, and the 1-, 3-, 5- and 10-year annualized returns are shown in the second table |
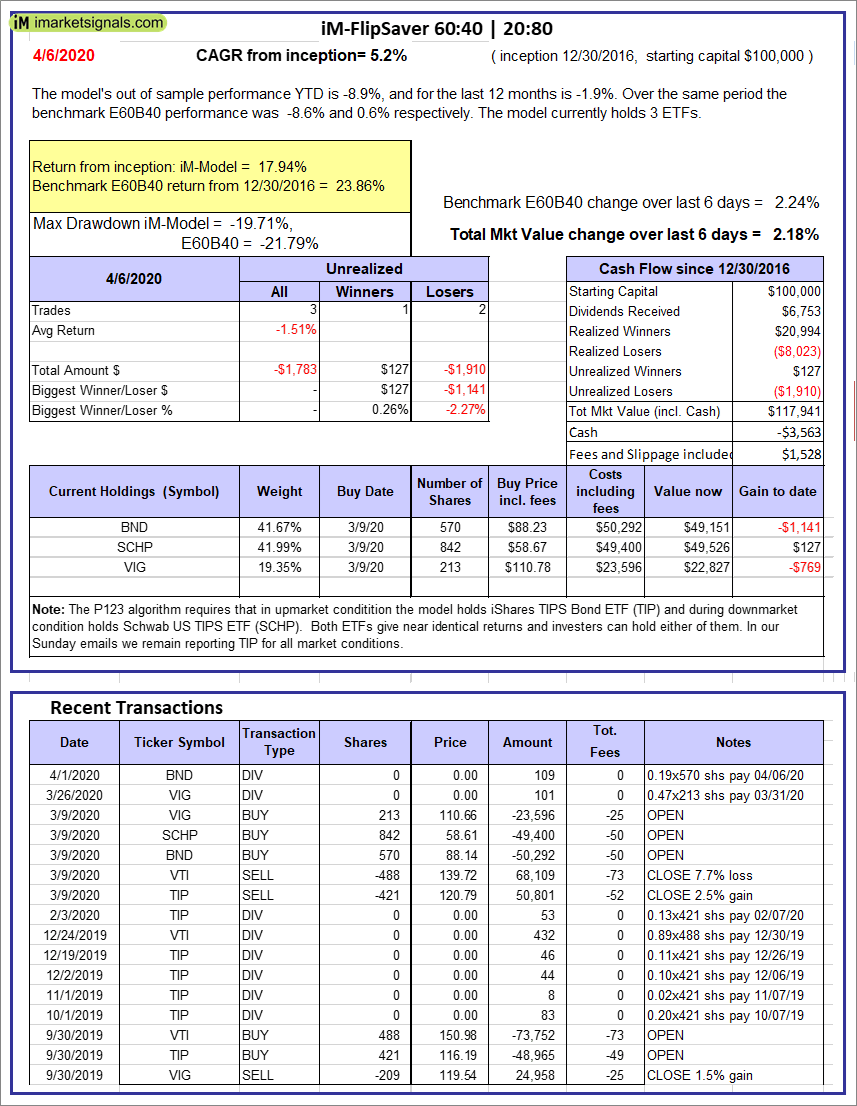 |
iM-FlipSaver 60:40 | 20:80 – 2017: The model’s out of sample performance YTD is -8.9%, and for the last 12 months is -1.9%. Over the same period the benchmark E60B40 performance was -8.6% and 0.6% respectively. Over the previous week the market value of iM-FlipSaver 80:20 | 20:80 gained 2.18% at a time when SPY gained 2.24%. A starting capital of $100,000 at inception on 7/16/2015 would have grown to $117,941 which includes -$3,563 cash and excludes $1,528 spent on fees and slippage. |
 |
iM-FlipSaver 70:30 | 20:80 – 2017: The model’s out of sample performance YTD is -10.7%, and for the last 12 months is -3.7%. Over the same period the benchmark E60B40 performance was -8.6% and 0.6% respectively. Over the previous week the market value of iM-FlipSaver 70:30 | 20:80 gained 2.20% at a time when SPY gained 2.24%. A starting capital of $100,000 at inception on 7/15/2015 would have grown to $118,457 which includes -$4,416 cash and excludes $1,661 spent on fees and slippage. |
 |
iM-FlipSaver 80:20 | 20:80 – 2017: The model’s out of sample performance YTD is -12.4%, and for the last 12 months is -5.4%. Over the same period the benchmark E60B40 performance was -8.6% and 0.6% respectively. Over the previous week the market value of iM-FlipSaver 80:20 | 20:80 gained 2.21% at a time when SPY gained 2.24%. A starting capital of $100,000 at inception on 1/2/2017 would have grown to $118,910 which includes -$5,224 cash and excludes $1,786 spent on fees and slippage. |
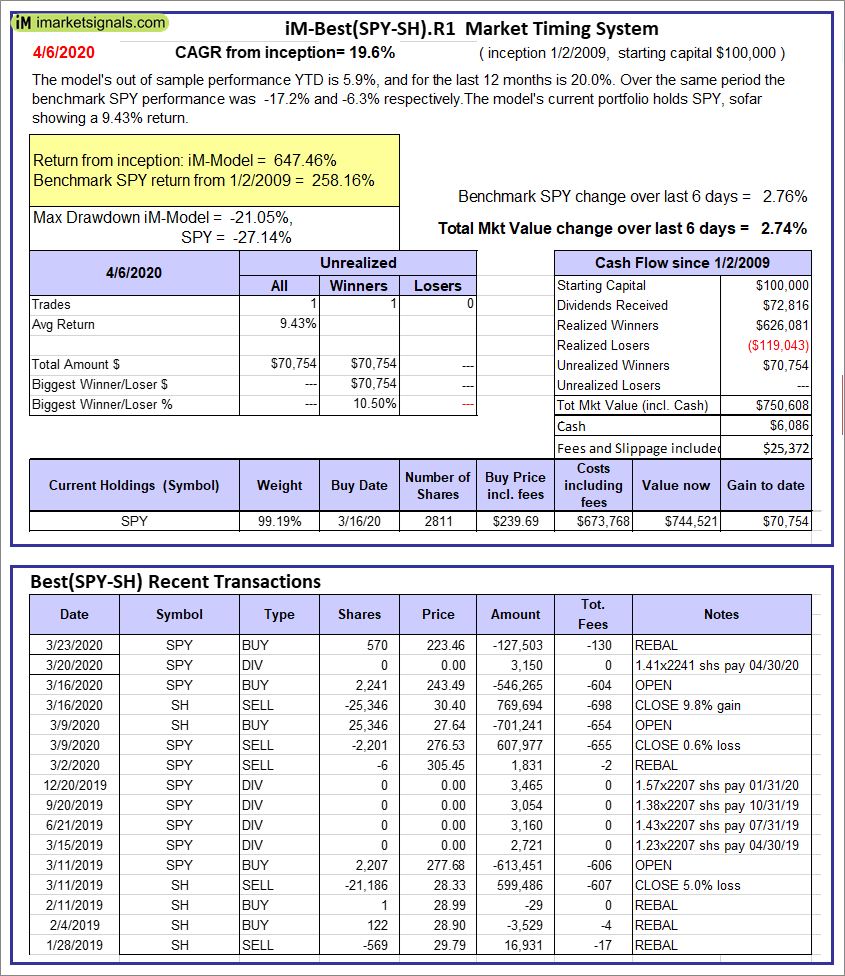 |
iM-Best(SPY-SH).R1: The model’s out of sample performance YTD is 5.9%, and for the last 12 months is 20.0%. Over the same period the benchmark SPY performance was -17.2% and -6.3% respectively. Over the previous week the market value of Best(SPY-SH) gained 2.74% at a time when SPY gained 2.76%. A starting capital of $100,000 at inception on 1/2/2009 would have grown to $750,608 which includes $6,086 cash and excludes $25,372 spent on fees and slippage. |
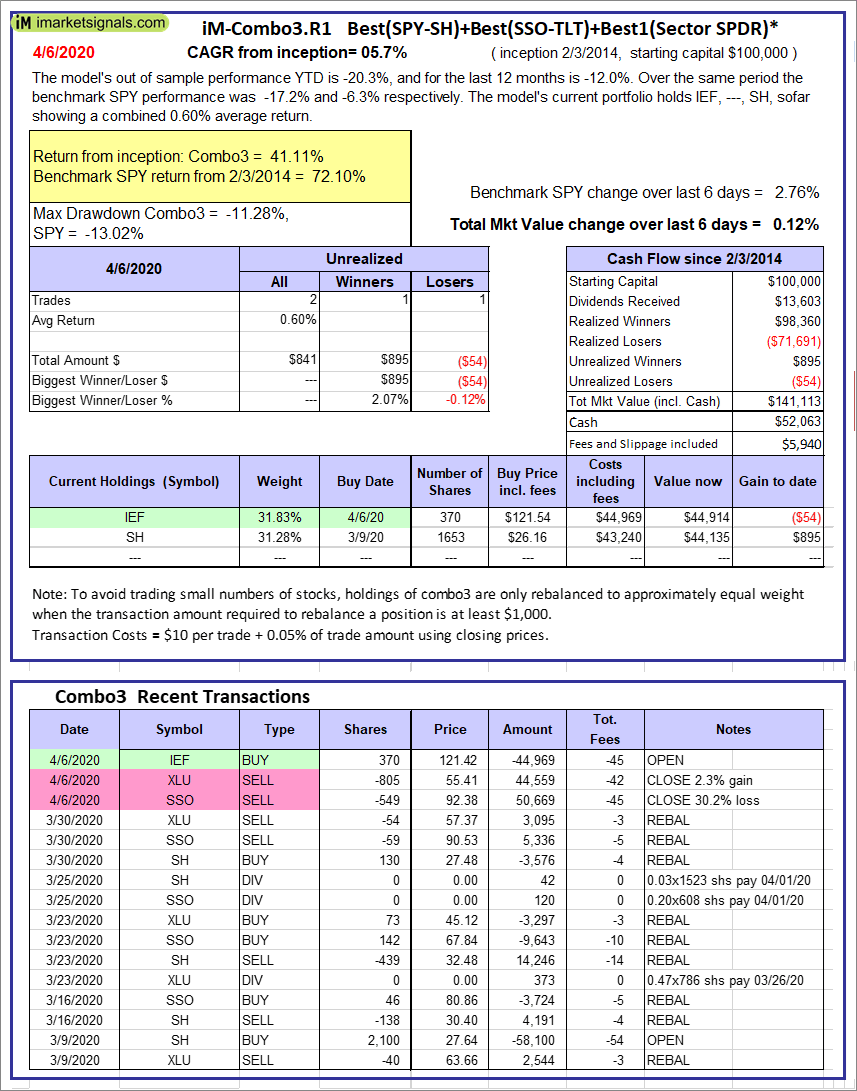 |
iM-Combo3.R1: The model’s out of sample performance YTD is -20.3%, and for the last 12 months is -12.0%. Over the same period the benchmark SPY performance was -17.2% and -6.3% respectively. Over the previous week the market value of iM-Combo3.R1 gained 0.12% at a time when SPY gained 2.76%. A starting capital of $100,000 at inception on 2/3/2014 would have grown to $141,113 which includes $52,063 cash and excludes $5,940 spent on fees and slippage. |
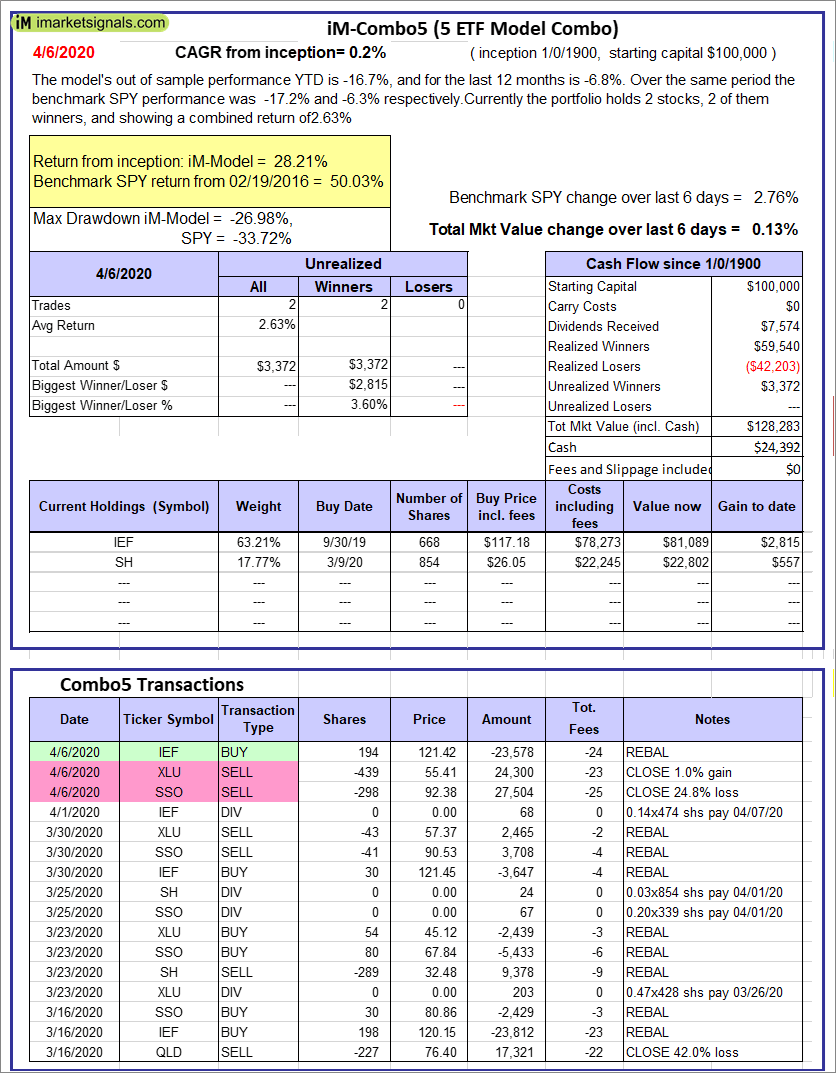 |
iM-Combo5: The model’s out of sample performance YTD is -16.7%, and for the last 12 months is -6.8%. Over the same period the benchmark SPY performance was -17.2% and -6.3% respectively. Over the previous week the market value of iM-Combo5 gained 0.13% at a time when SPY gained 2.76%. A starting capital of $100,000 at inception on 2/22/2016 would have grown to $128,283 which includes $24,392 cash and excludes $0 spent on fees and slippage. |
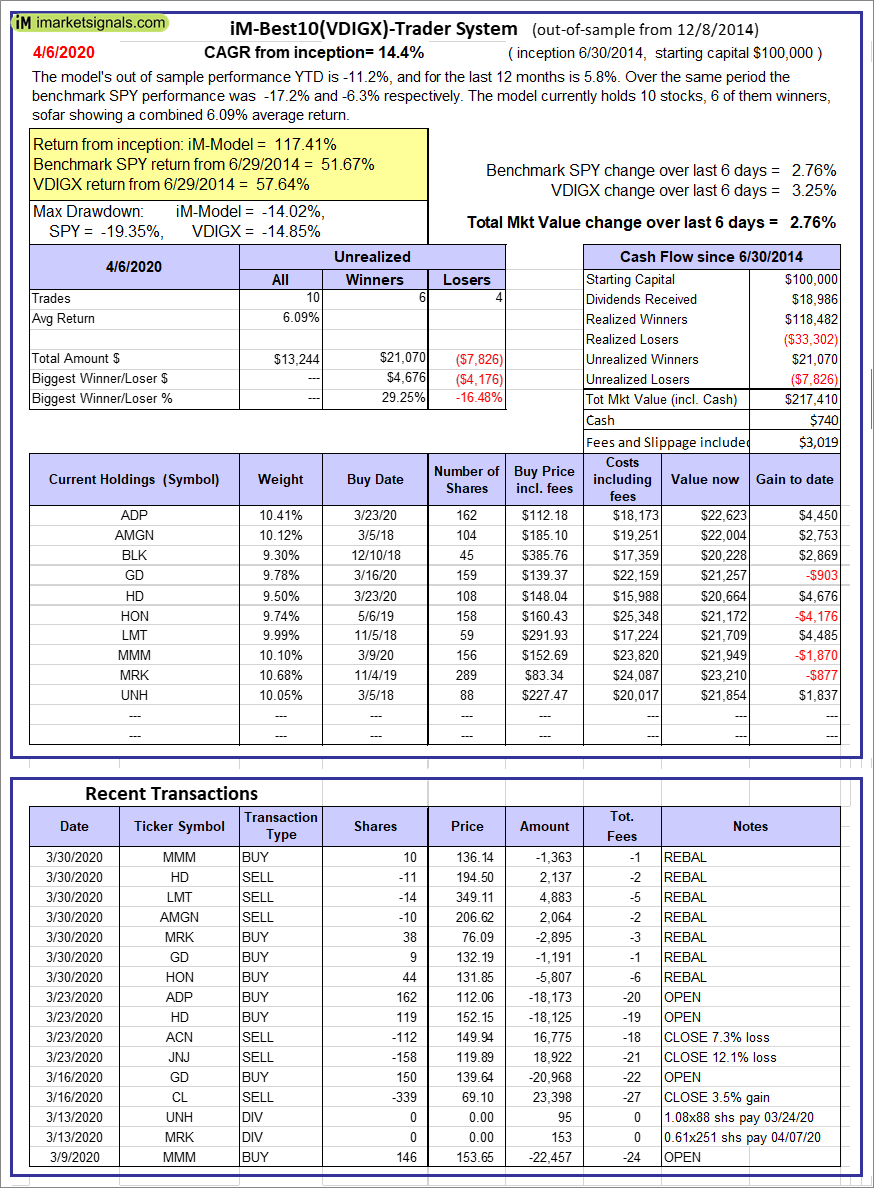 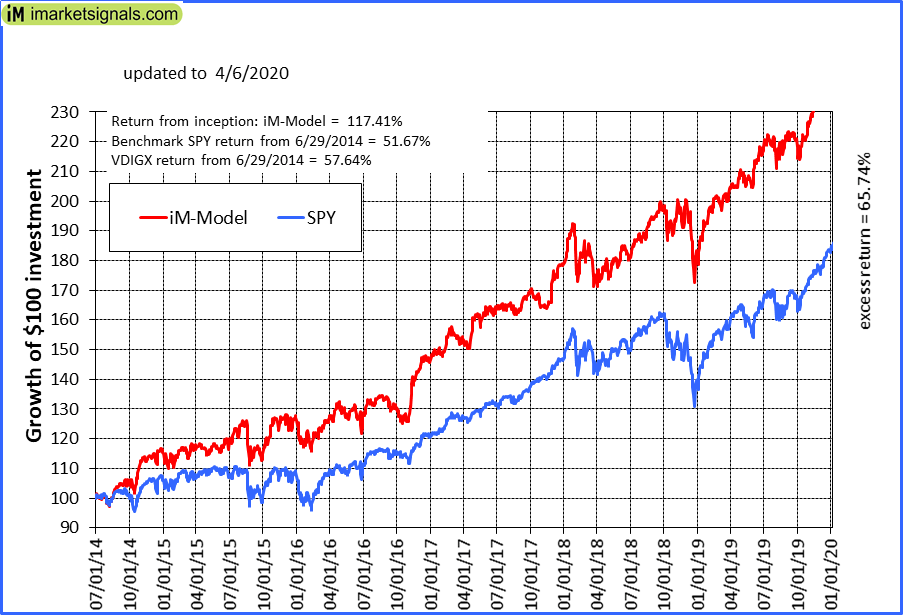 |
iM-Best10(VDIGX)-Trader: The model’s out of sample performance YTD is -11.2%, and for the last 12 months is 5.8%. Over the same period the benchmark SPY performance was -17.2% and -6.3% respectively. Since inception, on 7/1/2014, the model gained 117.41% while the benchmark SPY gained 51.67% and VDIGX gained 57.64% over the same period. Over the previous week the market value of iM-Best10(VDIGX) gained 2.76% at a time when SPY gained 2.76%. A starting capital of $100,000 at inception on 7/1/2014 would have grown to $217,410 which includes $740 cash and excludes $3,019 spent on fees and slippage. |
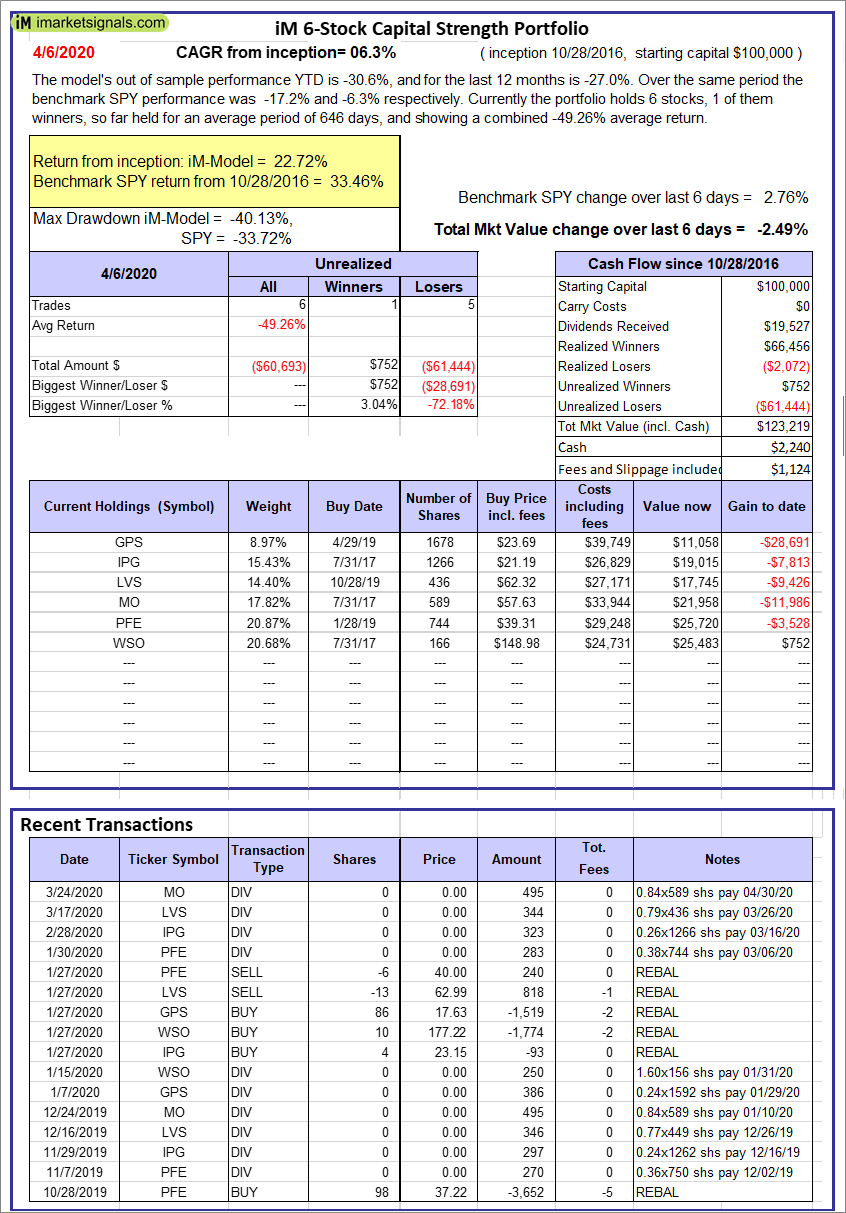 |
iM 6-Stock Capital Strength Portfolio: The model’s out of sample performance YTD is -30.6%, and for the last 12 months is -27.0%. Over the same period the benchmark SPY performance was -17.2% and -6.3% respectively. Over the previous week the market value of the iM 6-Stock Capital Strength Portfolio gained -2.49% at a time when SPY gained 2.76%. A starting capital of $100,000 at inception on 10/28/2016 would have grown to $123,219 which includes $2,240 cash and excludes $1,124 spent on fees and slippage. |
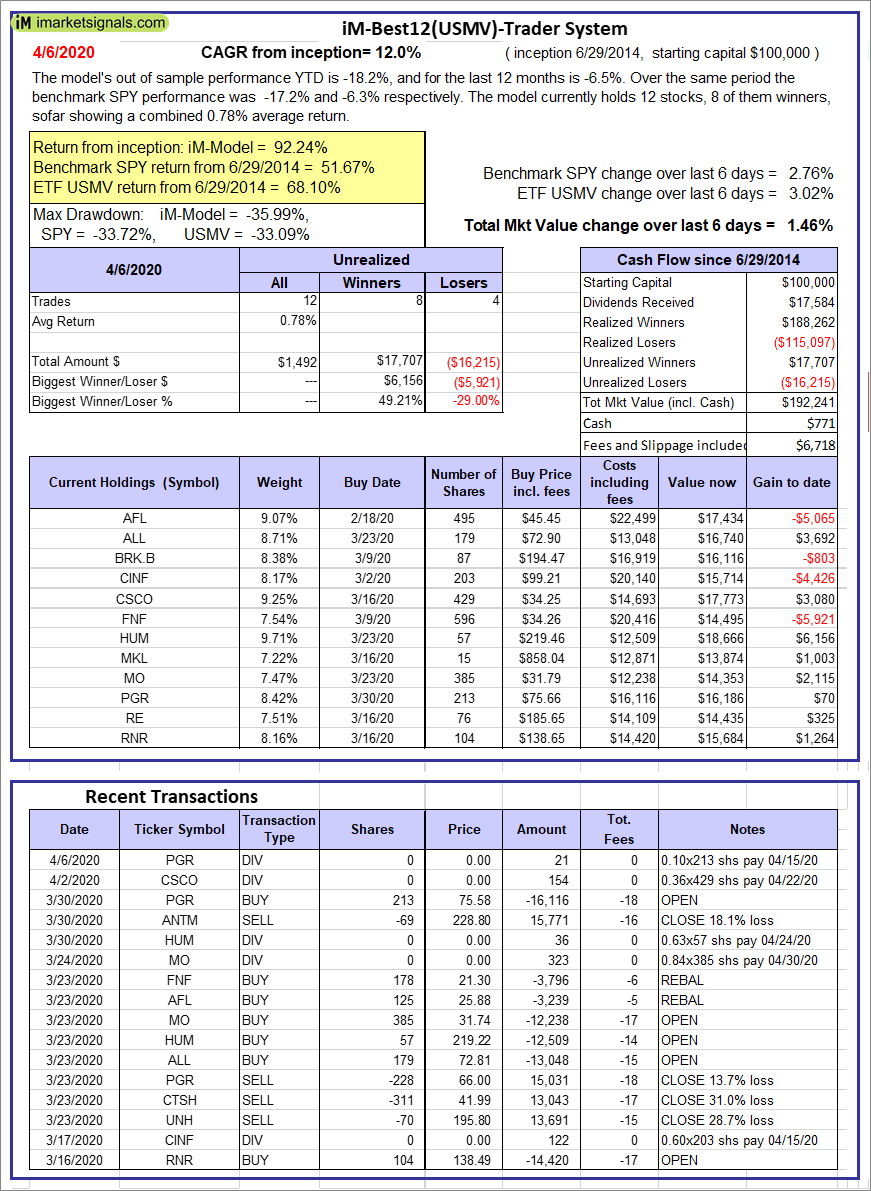 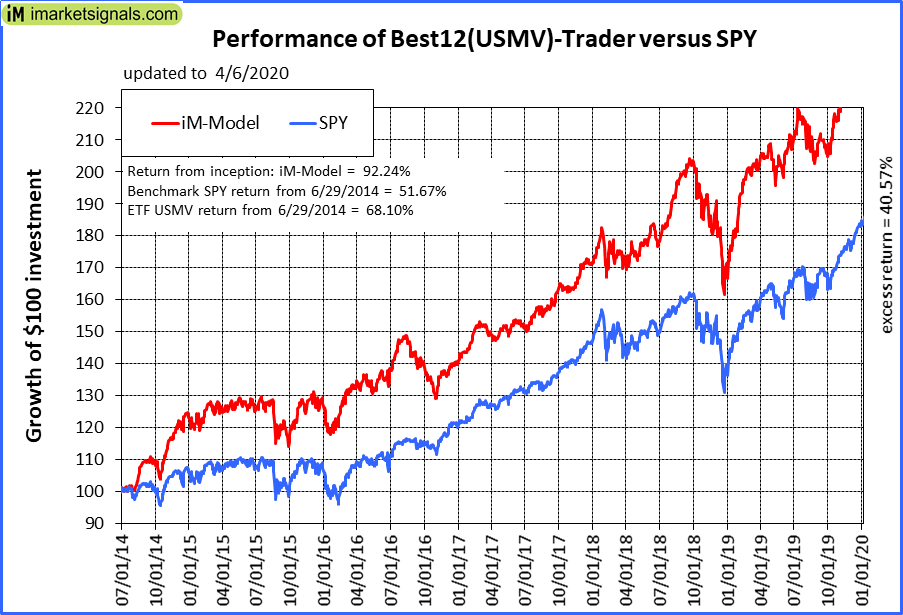 |
iM-Best12(USMV)-Trader: The model’s out of sample performance YTD is -18.2%, and for the last 12 months is -6.5%. Over the same period the benchmark SPY performance was -17.2% and -6.3% respectively. Since inception, on 6/30/2014, the model gained 92.24% while the benchmark SPY gained 51.67% and the ETF USMV gained 68.10% over the same period. Over the previous week the market value of iM-Best12(USMV)-Trader gained 1.46% at a time when SPY gained 2.76%. A starting capital of $100,000 at inception on 6/30/2014 would have grown to $192,241 which includes $771 cash and excludes $6,718 spent on fees and slippage. |
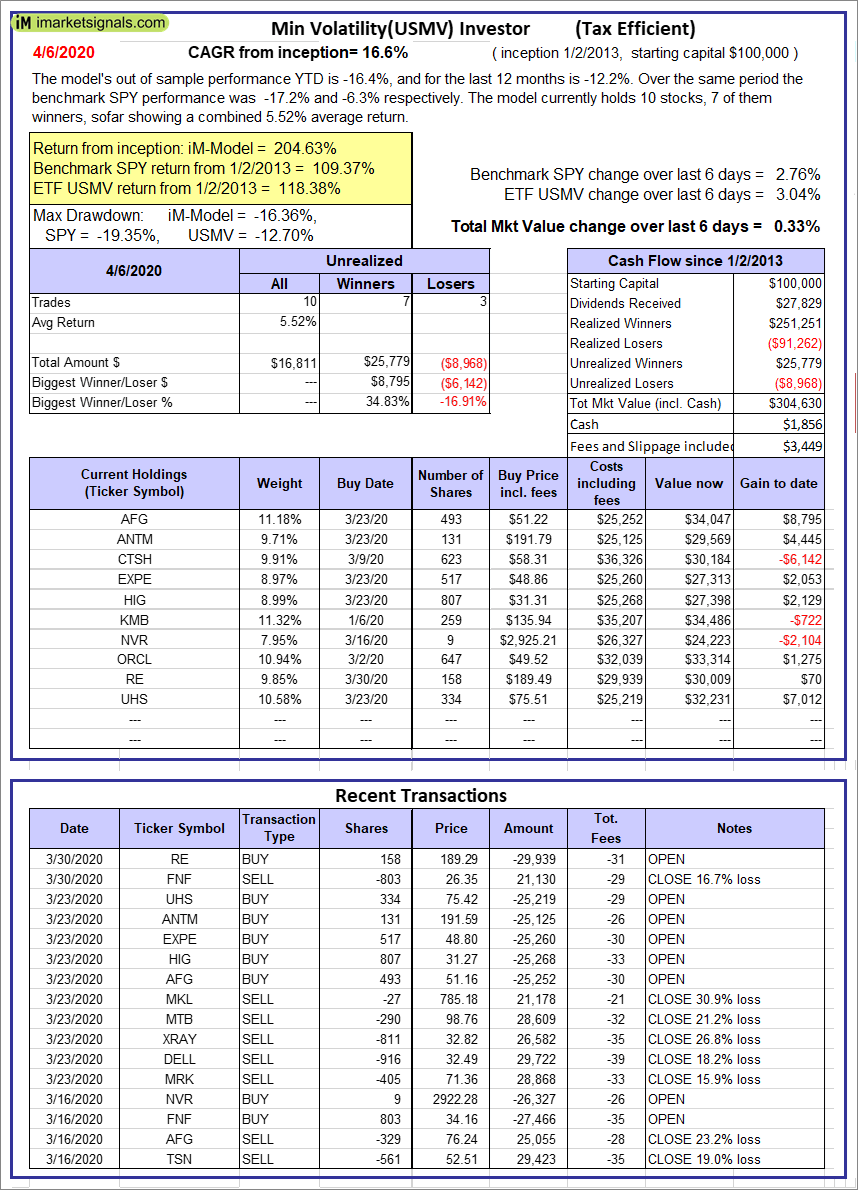 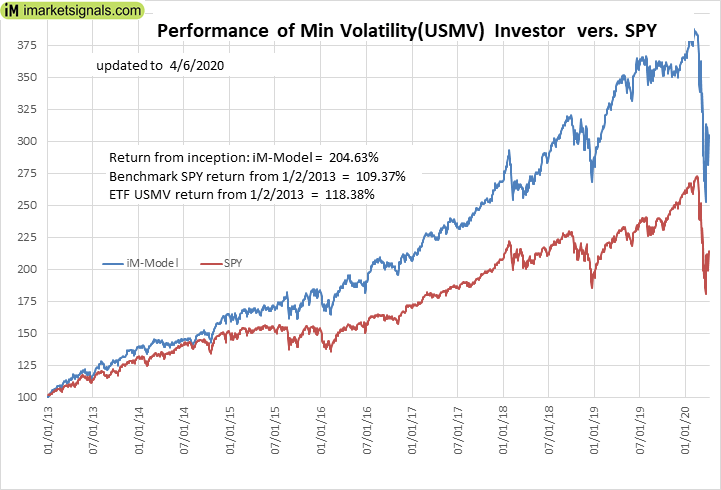 |
iM-Min Volatility(USMV) Investor (Tax Efficient): The model’s out of sample performance YTD is -16.4%, and for the last 12 months is -12.2%. Over the same period the benchmark SPY performance was -17.2% and -6.3% respectively. Since inception, on 1/3/2013, the model gained 204.63% while the benchmark SPY gained 109.37% and the ETF USMV gained 118.38% over the same period. Over the previous week the market value of iM-Best12(USMV)Q1 gained 0.33% at a time when SPY gained 2.76%. A starting capital of $100,000 at inception on 1/3/2013 would have grown to $304,630 which includes $1,856 cash and excludes $3,449 spent on fees and slippage. |
 |
iM-Bond Market Trader (High-Yield Bond or 10-yr Treasury Bond): The model’s out of sample performance YTD is -29.2%, and for the last 12 months is -27.3%. Over the same period the benchmark SPY performance was -17.2% and -6.3% respectively. Over the previous week the market value of the iM-Bond Market Trader (High-Yield Bond or 10-yr Treasury Bond) gained 0.04% at a time when BND gained 1.26%. A starting capital of $100,000 at inception on 10/30/2016 would have grown to $129,095 which includes -$793 cash and excludes $2,034 spent on fees and slippage. |
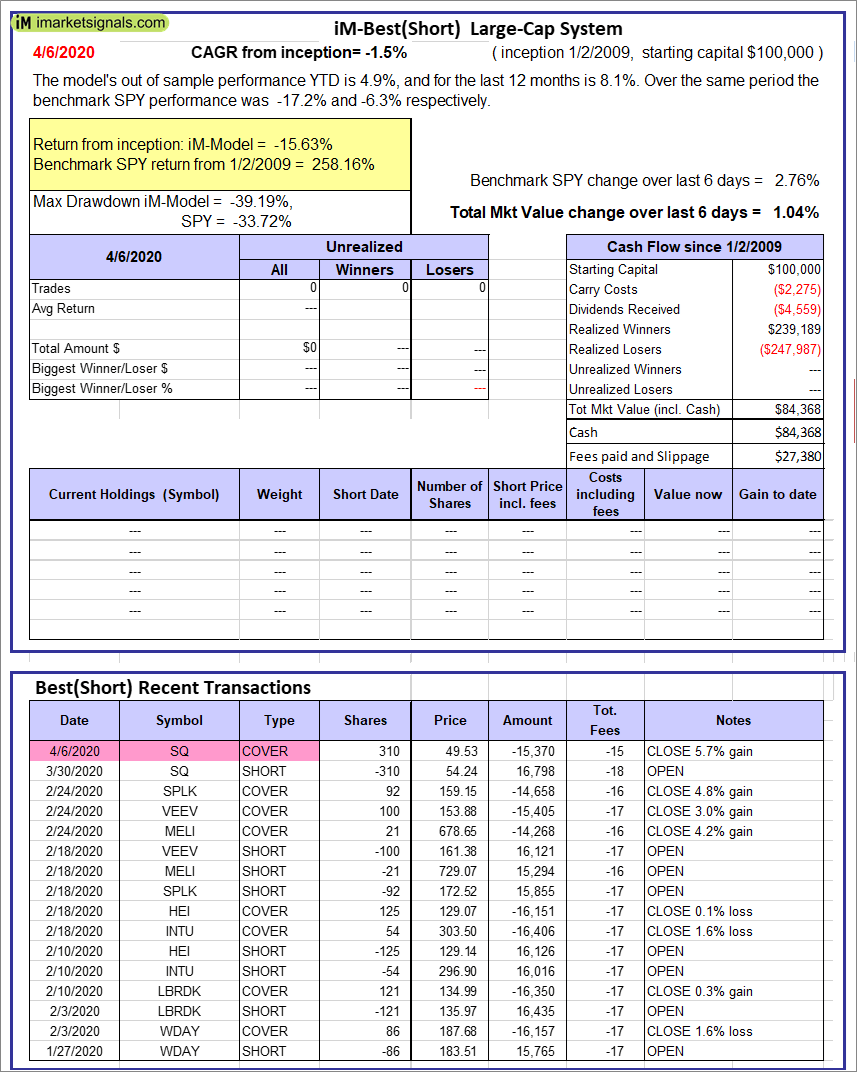 |
iM-Best(Short): The model’s out of sample performance YTD is 4.9%, and for the last 12 months is 8.1%. Over the same period the benchmark SPY performance was -17.2% and -6.3% respectively. Over the previous week the market value of iM-Best(Short) gained 1.04% at a time when SPY gained 2.76%. Over the period 1/2/2009 to 4/6/2020 the starting capital of $100,000 would have grown to $84,368 which includes $84,368 cash and excludes $27,380 spent on fees and slippage. |
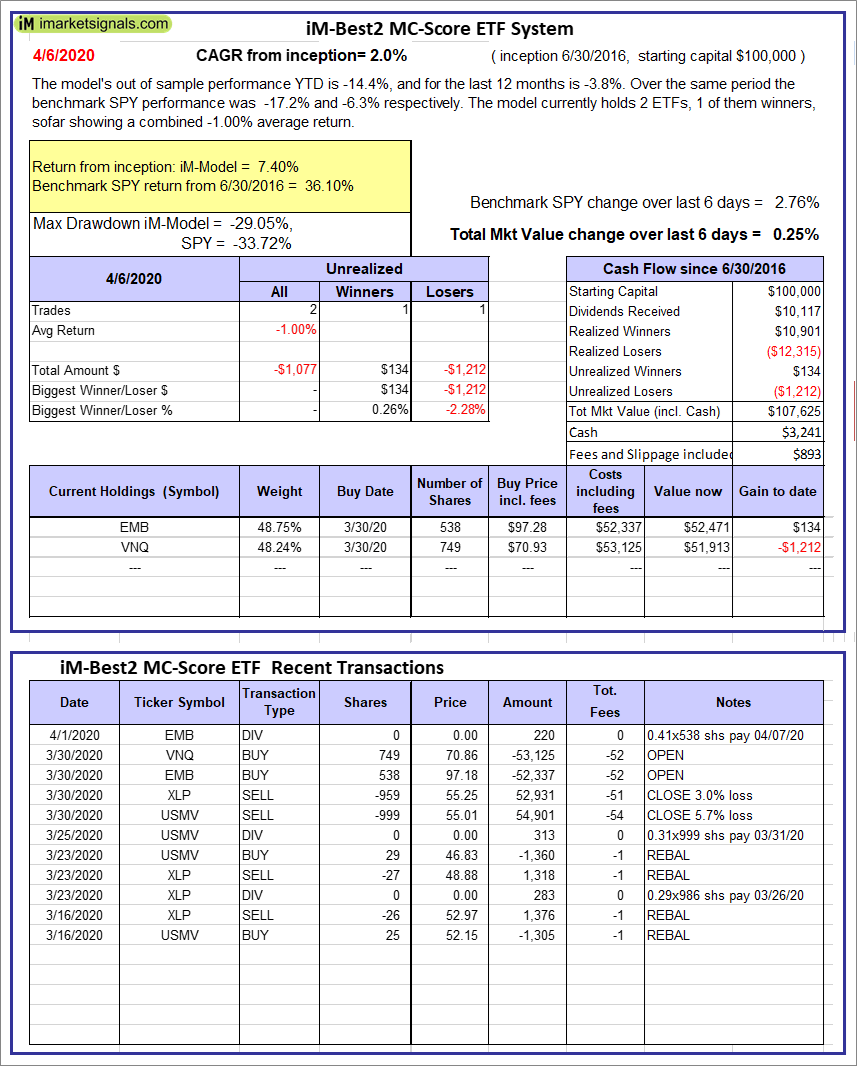 |
iM-Best2 MC-Score ETF System: The model’s out of sample performance YTD is -14.4%, and for the last 12 months is -3.8%. Over the same period the benchmark SPY performance was -17.2% and -6.3% respectively. Over the previous week the market value of the iM-Best2 MC-Score ETF System gained 0.25% at a time when SPY gained 2.76%. A starting capital of $100,000 at inception on 6/30/2016 would have grown to $107,625 which includes $3,241 cash and excludes $893 spent on fees and slippage. |
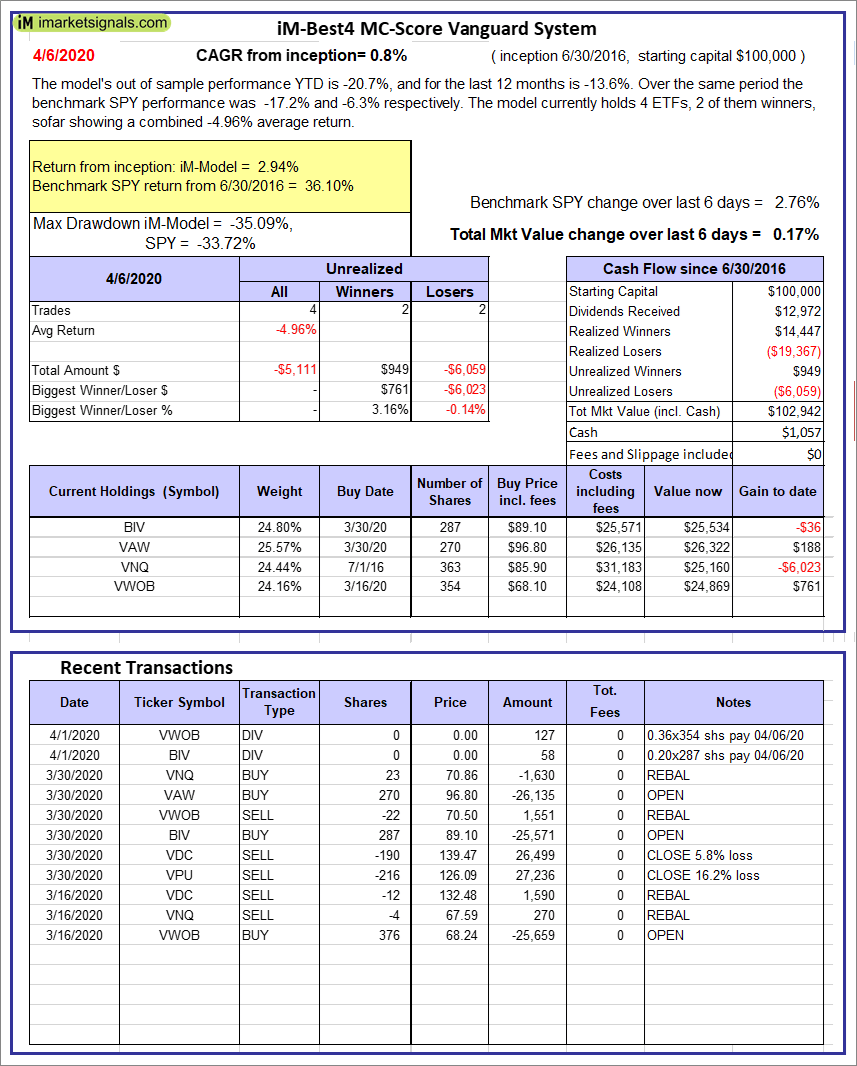 |
iM-Best4 MC-Score Vanguard System: The model’s out of sample performance YTD is -20.7%, and for the last 12 months is -13.6%. Over the same period the benchmark SPY performance was -17.2% and -6.3% respectively. Over the previous week the market value of the iM-Best4 MC-Score Vanguard System gained 0.17% at a time when SPY gained 2.76%. A starting capital of $100,000 at inception on 6/30/2016 would have grown to $102,942 which includes $1,057 cash and excludes $00 spent on fees and slippage. |
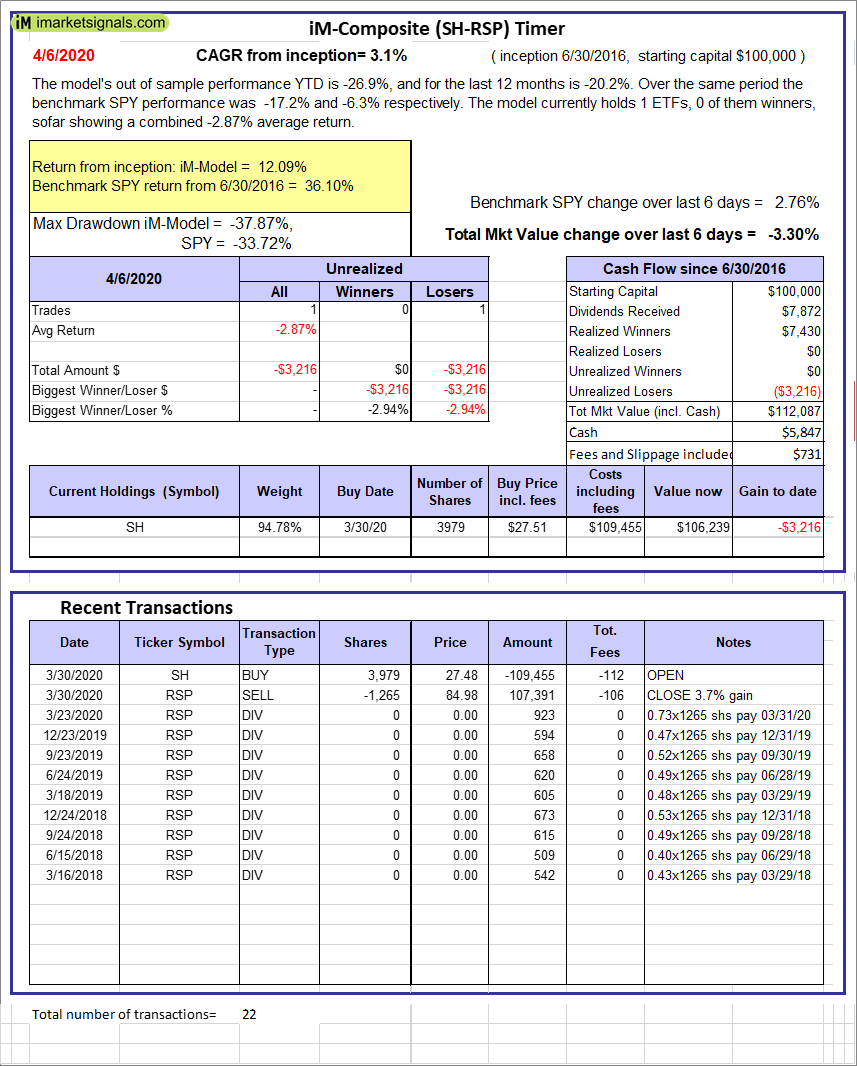 |
iM-Composite (SH-RSP) Timer: The model’s out of sample performance YTD is -26.9%, and for the last 12 months is -20.2%. Over the same period the benchmark SPY performance was -17.2% and -6.3% respectively. Over the previous week the market value of the iM-Composite (SH-RSP) Timer gained -3.30% at a time when SPY gained 2.76%. A starting capital of $100,000 at inception on 6/30/2016 would have grown to $112,087 which includes $5,847 cash and excludes $731 spent on fees and slippage. |
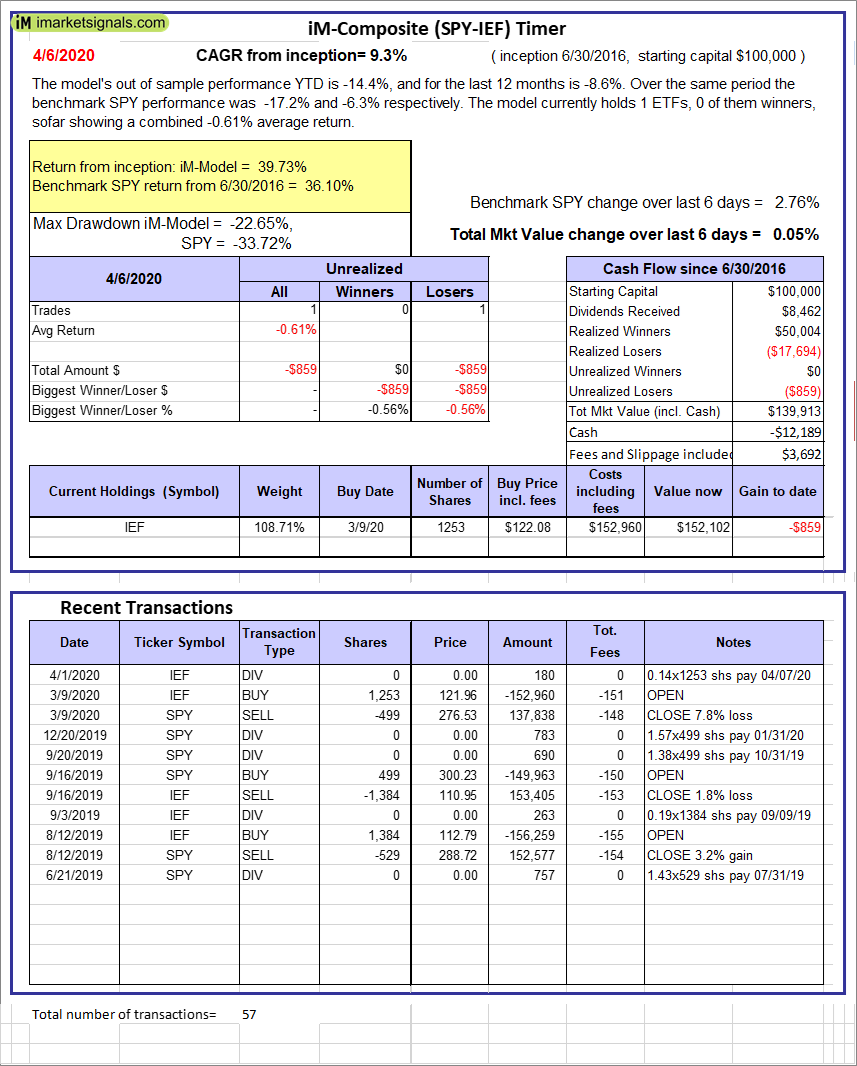 |
iM-Composite (SPY-IEF) Timer: The model’s out of sample performance YTD is -14.4%, and for the last 12 months is -8.6%. Over the same period the benchmark SPY performance was -17.2% and -6.3% respectively. Over the previous week the market value of the iM-Composite (SPY-IEF) Timer gained 0.05% at a time when SPY gained 2.76%. A starting capital of $100,000 at inception on 6/30/2016 would have grown to $139,913 which includes -$12,189 cash and excludes $3,692 spent on fees and slippage. |
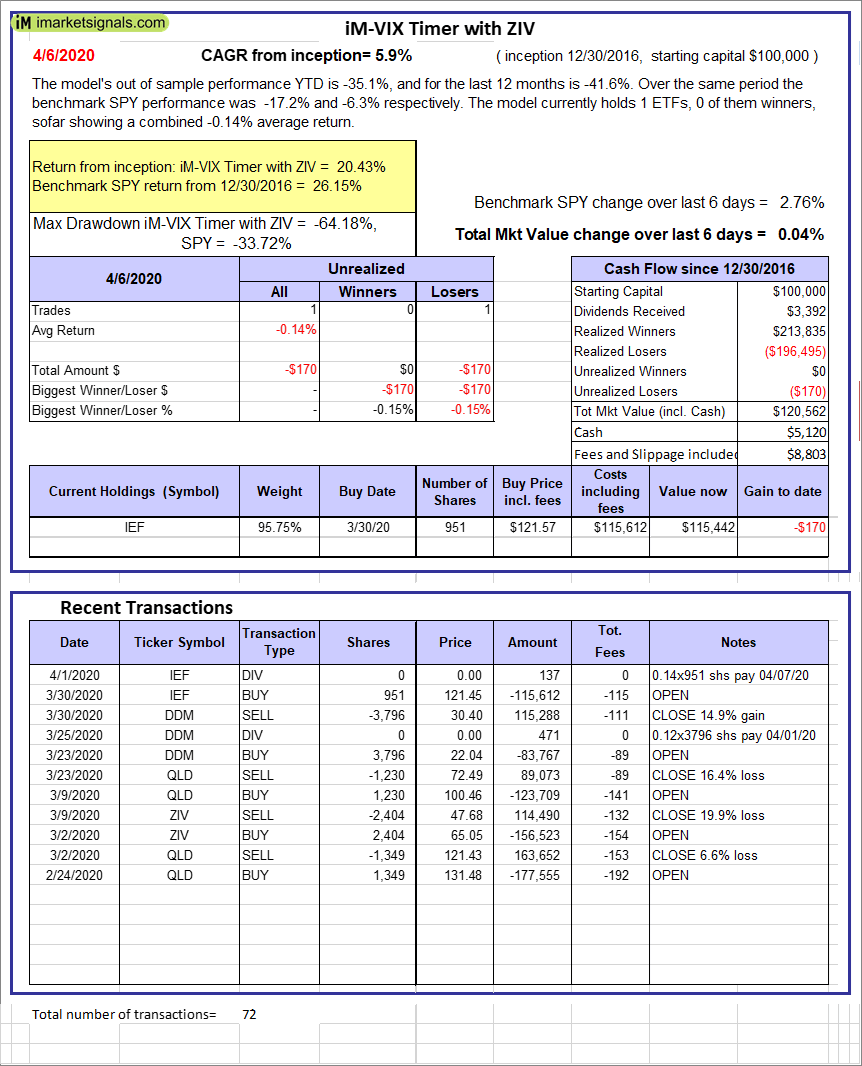 |
iM-VIX Timer with ZIV: The model’s out of sample performance YTD is -35.1%, and for the last 12 months is -41.6%. Over the same period the benchmark SPY performance was -17.2% and -6.3% respectively. Over the previous week the market value of the iM-VIX Timer with ZIV gained 0.04% at a time when SPY gained 2.76%. A starting capital of $100,000 at inception on 6/30/2016 would have grown to $120,562 which includes $5,120 cash and excludes $8,803 spent on fees and slippage. |
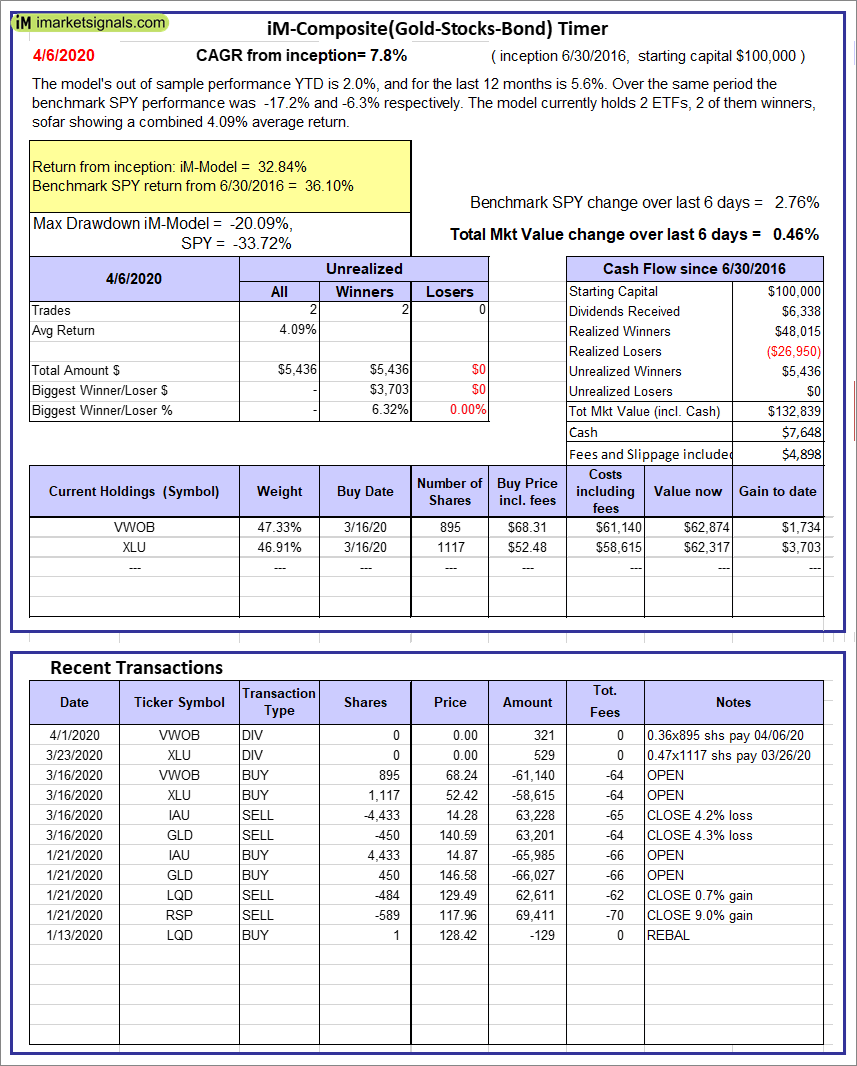 |
iM-Composite(Gold-Stocks-Bond) Timer: The model’s out of sample performance YTD is 2.0%, and for the last 12 months is 5.6%. Over the same period the benchmark SPY performance was -17.2% and -6.3% respectively. Over the previous week the market value of the iM-Composite(Gold-Stocks-Bond) Timer gained 0.46% at a time when SPY gained 2.76%. A starting capital of $100,000 at inception on 6/30/2016 would have grown to $132,839 which includes $7,648 cash and excludes $4,898 spent on fees and slippage. |
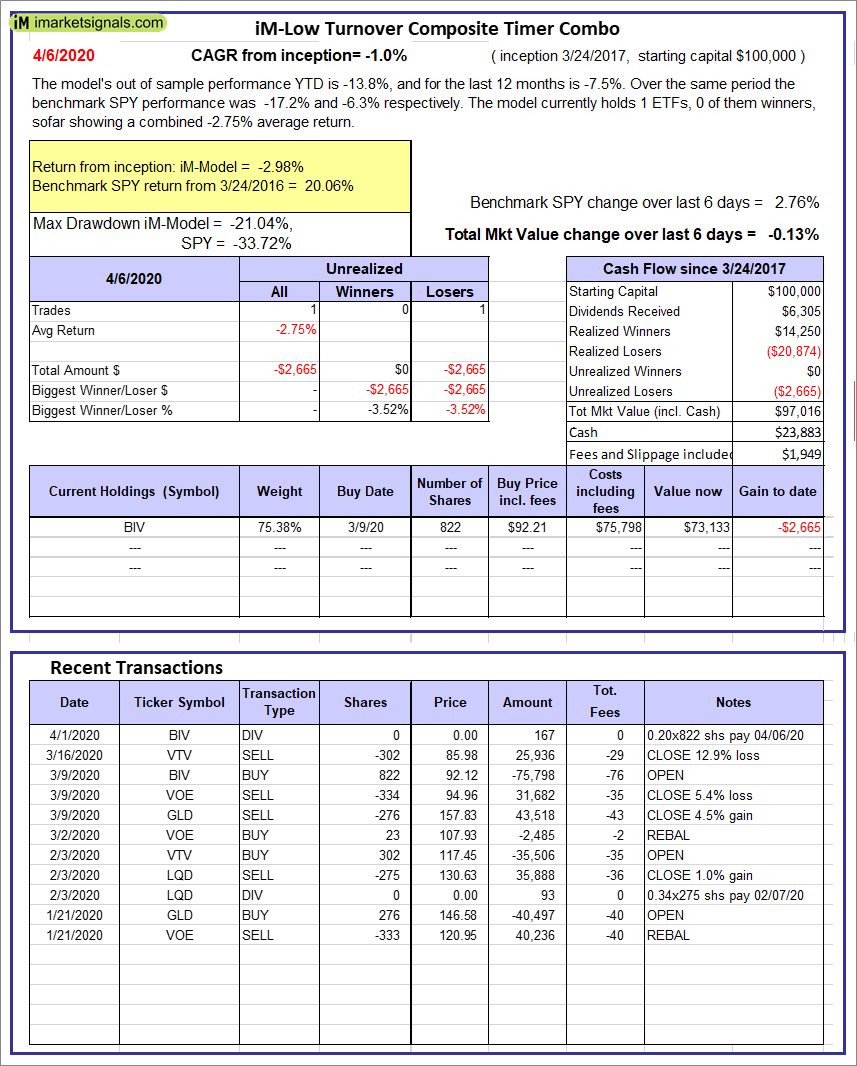 |
iM-Low Turnover Composite Timer Combo: The model’s out of sample performance YTD is -13.8%, and for the last 12 months is -7.5%. Over the same period the benchmark SPY performance was -17.2% and -6.3% respectively. Over the previous week the market value of the iM-Low Turnover Composite Timer Combo gained -0.13% at a time when SPY gained 2.76%. A starting capital of $100,000 at inception on 3/24/27 would have grown to $97,016 which includes $23,883 cash and excludes $1,949 spent on fees and slippage. |
 |
iM-5ETF Trader (includes leveraged ETFs): The model’s out of sample performance YTD is -29.2%, and for the last 12 months is -27.3%. Over the same period the benchmark SPY performance was -17.2% and -6.3% respectively. Over the previous week the market value of the iM-5ETF Trader (includes leveraged ETFs) gained -2.14% at a time when SPY gained 2.76%. A starting capital of $100,000 at inception on 10/30/2016 would have grown to $111,475 which includes $7,753 cash and excludes $3,972 spent on fees and slippage. |
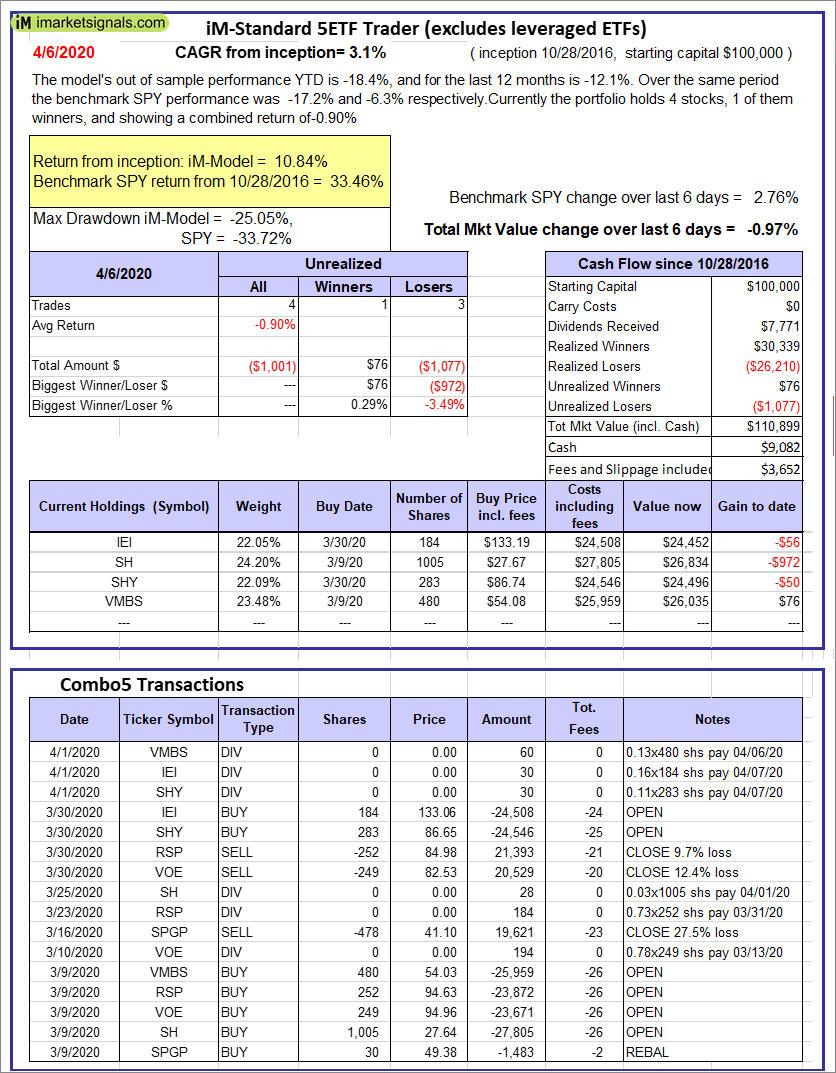 |
iM-Standard 5ETF Trader (excludes leveraged ETFs): The model’s out of sample performance YTD is -18.4%, and for the last 12 months is -12.1%. Over the same period the benchmark SPY performance was -17.2% and -6.3% respectively. Over the previous week the market value of the iM-Standard 5ETF Trader (excludes leveraged ETFs) gained -0.97% at a time when SPY gained 2.76%. A starting capital of $100,000 at inception on 10/30/2016 would have grown to $110,899 which includes $9,082 cash and excludes $3,652 spent on fees and slippage. |
iM-Best Reports – 4/7/2020
Posted in pmp SPY-SH
Leave a Reply
You must be logged in to post a comment.