
- A truer picture of the employment situation is extracted from the Unemployment Insurance Weekly Claims (UIWC) report.
- Persons receiving some form of unemployment benefit account for 12.6% of the labor force.
- Monitoring of the weekly insured unemployed could provide early indication of recovery from the COVID-19 crisis.
- The current UIWC report shows that the economic recovery from the COVID-19 crisis seems to improve.
The 11/26/2020 DOL Unemployment Insurance indicates a continued improvement in the insured employment situation even though the initial claims remain high and have increased over last week, but seemingly trending towards the long-term average.
The non-seasonal adjusted initial claims totaled totaled 827,710 in the week ending
November 21, an increase of 78,372 from the previous week.. This makes up 0.56% of the Covered Employment. The 50 year long-term average (January 1971 to today) is 0.38% and the average of the last business cycle (July 2009 to March 2020) is 0.24%.
The non-seasonal adjusted continuous insured unemployment totaled 5,911,965 a decrease of 167,617 from the preceding week.
Also, total number of people claiming benefits in all programs for the week ending November 7 was 20,452,223, an invrease of 135,297 from the preceding week.
These reported numbers, which are graphed below, indicate:
- A continued improvement in the return to work trend (continued decrease in the insured unemployed – green line) and the possible easing of the COVID-19 recession.
- That the lowest unemployment rate should be 12.7% (blue line), and if one added the historic 2.6% UER-PCR spread, then the actual unemployment rate should be 15.3%.
In the current COVID-19 situation we believe that the only meaningful figures from DOL’s weekly report are:
- The non-seasonal adjusted Insured Unemployed.
- The total of all persons claiming unemployment benefits in all programs, which includes persons receiving COVID-19 relief who would normally not fall into the insured employed, e.g. self-employed tech workers.
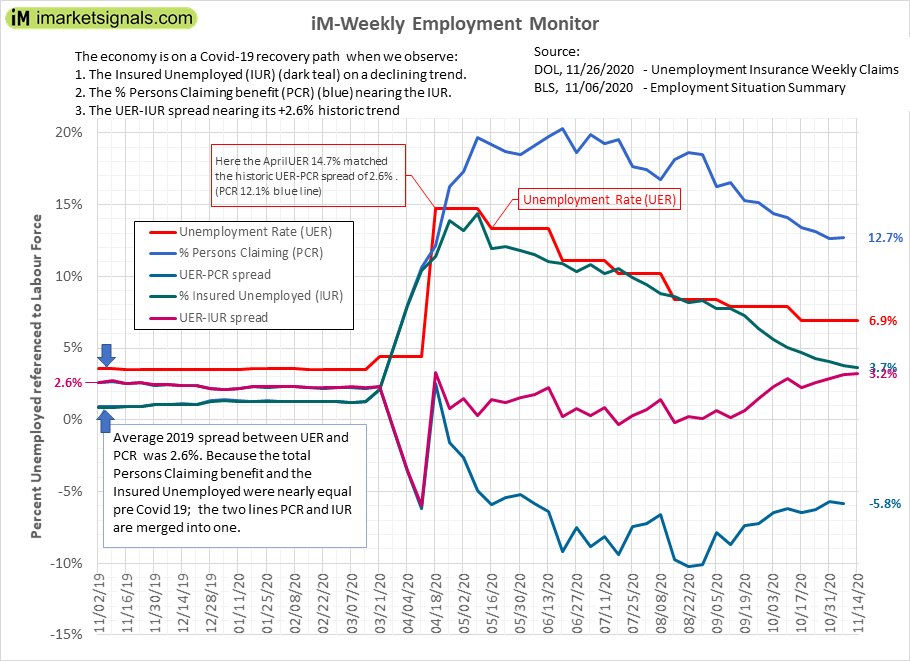
In the figure above we graph the following:
- The monthly unemployment rate (UER) as published by the BLS, plotted 2 weeks earlier from the reporting date. (The May UER which is published beginning June is plotted from mid-May to mid-June.
- The insured unemployed rate (IUR) is the percentage of insured unemployed persons (not seasonally adjusted) of the labor force. (The number of insured unemployed is published every Thursday, looking back 2 weeks in the DOL’s weekly Unemployment Insurance Weekly Claims report. The labor force is published monthly by the BLS with the Employment Situation Summary.)
- The unemployed persons claiming rate (PCR) is the percentage of persons of the labor force claiming UI benefits in all programs, including the insured unemployed. (The total number of persons claiming benefit is published weekly looking three weeks back.)
- The spread UER-IUR, historically at 2.6% (2019 average)
- The spread UER-PCR, also historically at 2.6%, as the majority of persons claiming benefit were the insured unemployed.
A recovery would be indicated by the following:
- Significant and continuous decline in the insured unemployment rate, together with a
- significant decline of total persons claiming benefit, which implies
- the spread UER-PCR approaching its historic value of 2.6%.
Leave a Reply
You must be logged in to post a comment.