
- A truer picture of the employment situation is extracted from the Unemployment Insurance Weekly Claims (UIWC) report.
- Persons receiving some form of unemployment benefit account for 18.6% of the labor force, which is way above the 13.3% official unemployment rate.
- Monitoring of the weekly insured unemployed can provide early indication of recovery from the Covid-19 crisis.
- No meaningful economic recovery is identified yet from the current UIWC report.
The May 2020 U.S. Employment Situation report, published June 5, showed much uncertainty in the current employment situation, especially after the Bureau of Labor Statistics (BLS) explained that were it not for a misclassification error the unemployment rate would have topped 16%, much higher than the official published 13.3%.
Every Thursday the Department of Labor (DOL) publishes the Weekly Insured Unemployment Claims. In the current Covid-19 situation we believe that the only meaningful figures from this weekly report are:
- The non-seasonal adjusted Insured Unemployed.
- The total of all persons claiming unemployment benefits in all programs, which includes persons receiving Covid-19 relief who would normally not fall into the insured employed, e.g. self-employed tech workers.
- The monthly unemployment rate (UER) as published by the BLS, plotted 2 weeks earlier from the reporting date. (The May UER which is published beginning June is plotted from mid May to mid June}.
- The insured unemployed rate (IUR) is the percentage of insured unemployed persons (not seasonally adjusted) of the labor force. (The number of insured unemployed is published every Thursday, looking back 2 weeks in the DOL’s weekly Unemployment Insurance Weekly Claims report. The labor force is published monthly by the BLS with the Employment Situation Summary.)
- The unemployed persons claiming rate (PCR) is the percentage of persons of the labor force claiming UI benefits in all programs, including the insured unemployed. (The total number of persons claiming benefit is published weekly looking three weeks back.)
- The spread UER-IUR, historically at 2.6% (2019 average)
- The spread UER-PCR, also historically at 2.6%, as the majority of persons claiming benefit were the insured unemployed.
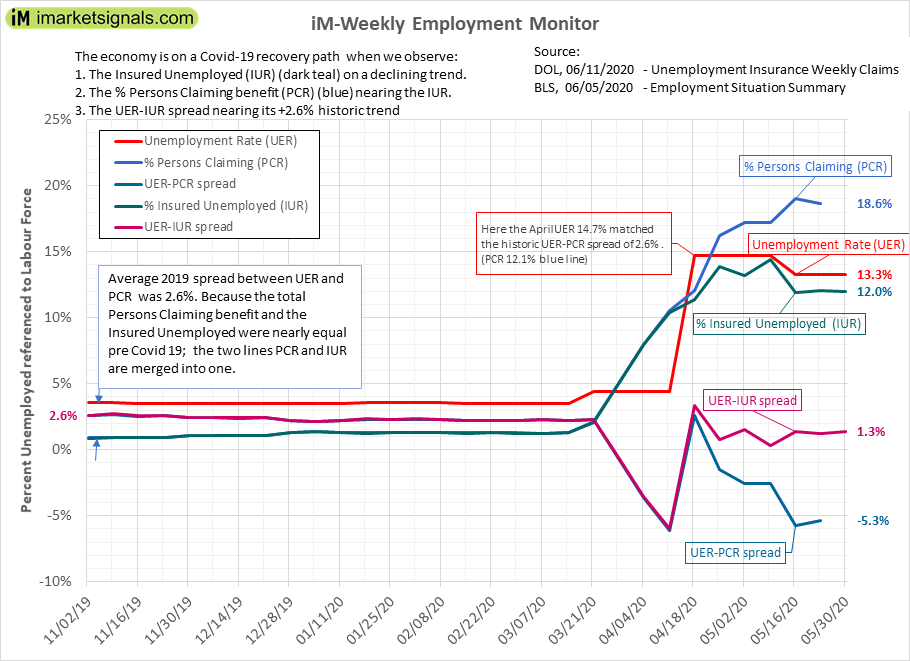
The figure shows that currently the lowest unemployment rate should be 18.6%, and if one added the historic 2.6% UCR-PCR spread then the actual unemployment rate should be 21.2%.
Our intention is not to try and explain the significance of the difference between the 18.6% unemployment rate calculated from actual DOL figures and the 13.3% calculated from a BLS telephonic survey. Rather our intention is to use this graph to assess the economic recovery from the Covid-19 crisis.
A recovery would be indicated by the following:
- Significant and continues decline in the insured unemployment rate, together with a
- significant decline of total persons claiming benefit, which implies
- the spread UER-PCR approaching its historic value of 2.6%.
What is already encouraging from this graph is that the IUR has not increased over the last 6 weeks, despite over the same period nearly 17 million people having made initial claims. This could be indicative of a return to work of the same proportion. However, discouraging is the huge uptick in persons outside the insured unemployed who receive Covid-19 assistance.
We will update this graph every Thursday.
I thought this was going to be updated weekly?
I was going to ask the same question. Would be helpful to have a second source of information.