- Seeking Alpha publishes a dynamic list of 250 popular tickers that haven’t had recent coverage, mainly small-caps. Ranking and periodically selecting 50 of these undercovered stocks should provide good returns.
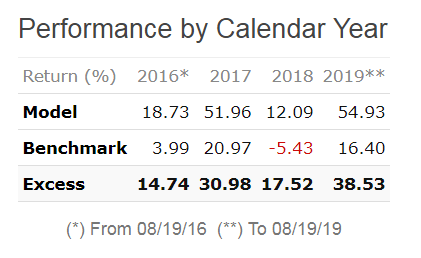
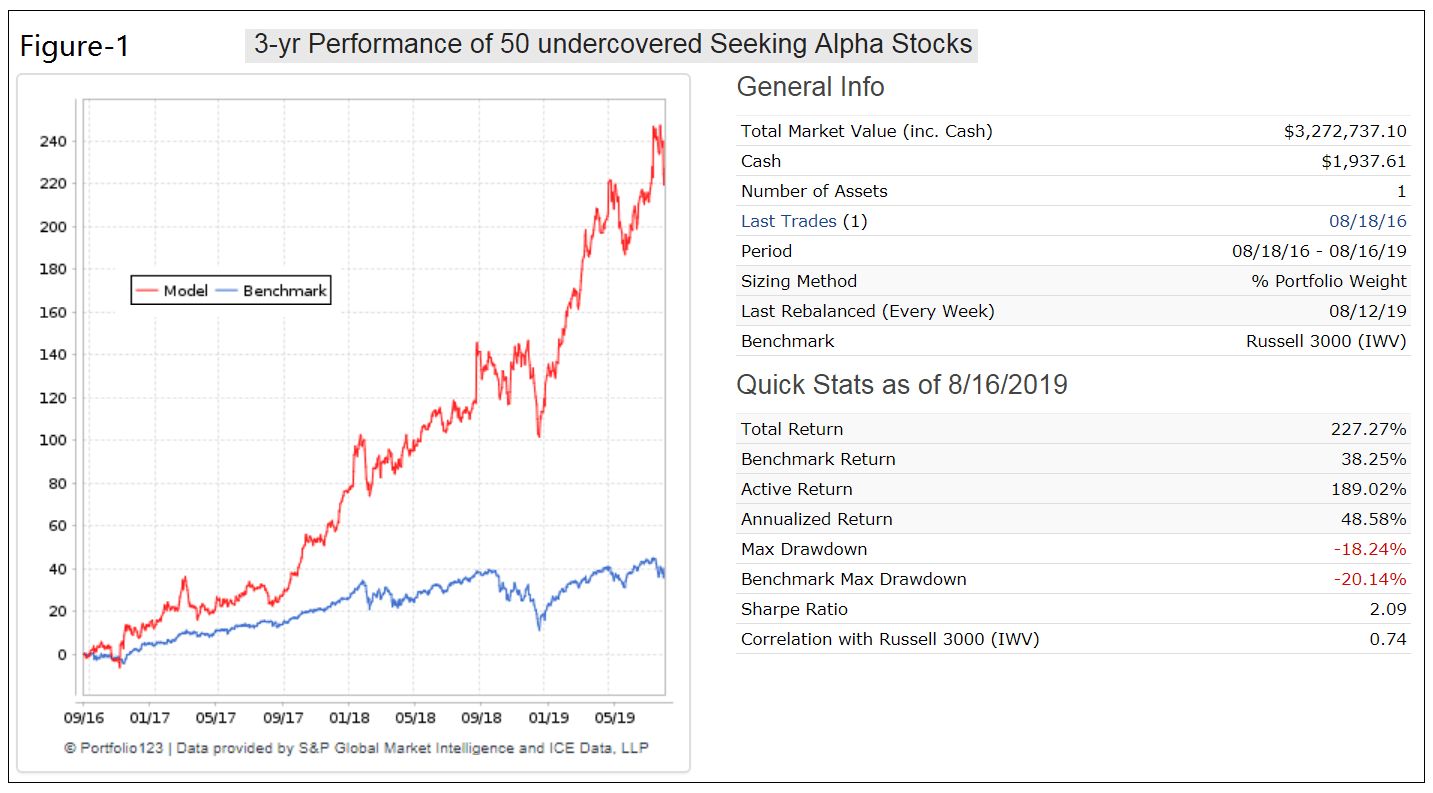
- A trading strategy, backtested over the preceding three years, showed a simulated annualized return of 48% with a maximum drawdown of -18%..
- Although the portfolio is relatively large, the annual turnover is only 140%.
For the analysis the recent Seeking Alpha listing of June-2019 was used. The backtest to Aug-2019 was performed on the online simulation platform Portfolio 123 with transaction costs and slippage taken into account.
The current listing of the undercovered stocks should not be tainted by survivorship bias since it is a listing of ignored stocks, not one of stocks that have necessarily performed well in the past. It is unknown if these stocks were also undercovered over the backtest period, and as an experiment going forward we will update the stock universe for the model on a periodic basis using the Seeking Alpha’s listing of undercovered stocks.
3-Year Performance Backtest
The strategy selects 50 stocks from a universe consisting of approximately 250 stocks which are undercovered on Seeking Alpha. Stocks from the sectors Real Estate, Financial, and Energy were not considered for selection.
The benchmark chosen is the Russell 3000 Index as represented by the iShares Russell 3000 ETF (IWV) because the market capitalization of the undercovered stocks ranges from Micro- to Large-Caps.
Performance over three years is shown in Figure-1. The total return and annualized return would have been 227% and 48%, respectively, with a maximum drawdown of -18%. Over the same period the benchmark produced an annualized return of 11.3% with a maximum drawdown of -20%.
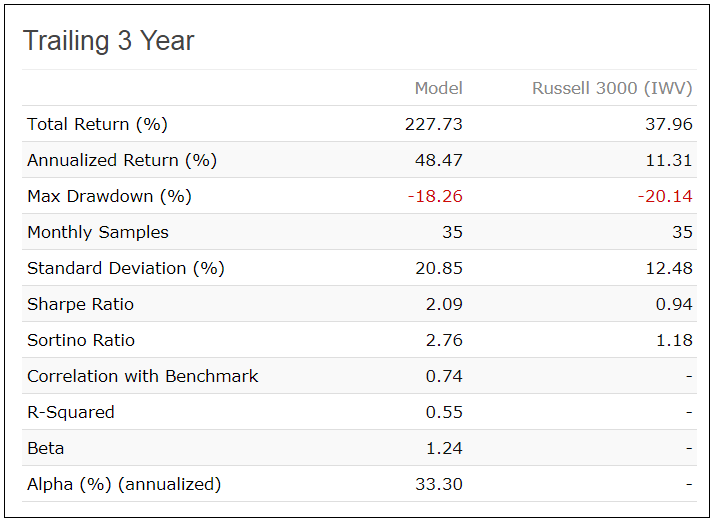
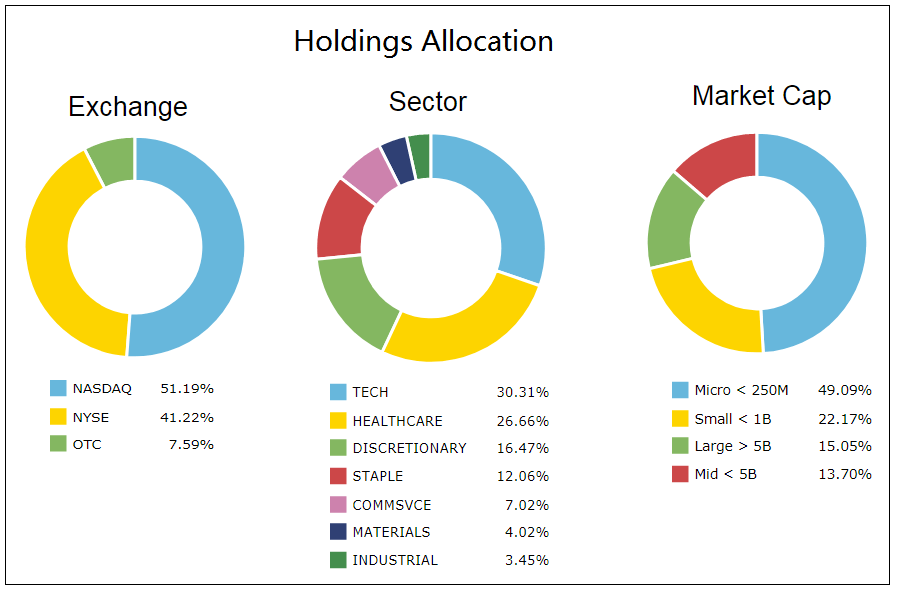
Risk measurements are shown below Figure-1 and the current holdings and their allocation are in the Appendix.

Risk Measurements
Conclusion
From the analysis it would appear that investing in the undercovered Seeking Alpha stocks according to a suitable trading strategy should produce good returns.
Periodic updates of this model will be posted on our website, imarketsignals.com and/or on Seeking Alpha.
Appendix
Model’s current holdings of undercovered stocks |
|||
| Ticker | Name | Weight (%) | |
| 1 | A | Agilent Technologies Inc | 0.61 |
| 2 | ABEV | Ambev SA | 2.19 |
| 3 | AFMD | Affimed NV | 4.02 |
| 4 | AKBA | Akebia Therapeutics Inc | 2.43 |
| 5 | ALXN | Alexion Pharmaceuticals Inc | 0.51 |
| 6 | AMNF | Armanino Foods of Distinction Inc | 5.34 |
| 7 | APPS | Digital Turbine Inc | 3.26 |
| 8 | AVID | Avid Technology Inc. | 1.65 |
| 9 | BAX | Baxter International Inc | 0.69 |
| 10 | BITA | Bitauto Holdings Ltd | 1.91 |
| 11 | BMRN | Biomarin Pharmaceutical Inc | 0.48 |
| 12 | BT | BT Group PLC | 0.67 |
| 13 | CE | Celanese Corp | 0.77 |
| 14 | CODA | Coda Octopus Group Inc | 5.01 |
| 15 | CROX | Crocs Inc | 1.33 |
| 16 | CVSI | CV Sciences Inc | 2.24 |
| 17 | CYH | Community Health Systems Inc | 3.59 |
| 18 | DGX | Quest Diagnostics Inc | 1.19 |
| 19 | DRRX | Durect Corp | 6.87 |
| 20 | GRVY | GRAVITY Co Ltd | 2.5 |
| 21 | HLT | Hilton Worldwide Holdings Inc | 0.51 |
| 22 | HUN | Huntsman Corp | 1.01 |
| 23 | INGR | Ingredion Inc | 0.98 |
| 24 | IQV | Iqvia Holdings Inc | 1.19 |
| 25 | JAZZ | Jazz Pharmaceuticals Plc | 0.59 |
| 26 | KODK | Eastman Kodak Co | 5.1 |
| 27 | LDOS | Leidos Holdings Inc | 0.63 |
| 28 | LIN | Linde Plc | 0.46 |
| 29 | NCLH | Norwegian Cruise Line Holdings Ltd | 0.92 |
| 30 | NCR | NCR Corp | 0.69 |
| 31 | NUS | Nu Skin Enterprises Inc. | 1.29 |
| 32 | OPK | Opko Health Inc | 1.26 |
| 33 | QRTEA | Qurate Retail Inc | 0.59 |
| 34 | RFP | Resolute Forest Products Inc | 1.78 |
| 35 | RUBI | Rubicon Project Inc (The) | 4.77 |
| 36 | SCOR | comScore Inc | 1.94 |
| 37 | SGH | SMART Global Holdings Inc | 1.8 |
| 38 | SHSP | SharpSpring Inc | 7.09 |
| 39 | SSYS | Stratasys Ltd | 0.95 |
| 40 | SUP | Superior Industries International Inc. | 7.6 |
| 41 | SYNA | Synaptics Inc | 1.66 |
| 42 | TEL | TE Connectivity Ltd | 0.5 |
| 43 | TENB | Tenable Holdings Inc | 1.19 |
| 44 | TMO | Thermo Fisher Scientific Inc | 0.65 |
| 45 | VCYT | Veracyte Inc | 1.82 |
| 46 | VICR | Vicor Corp. | 1.13 |
| 47 | VRNT | Verint Systems Inc | 0.77 |
| 48 | WPRT | Westport Fuel Systems Inc | 2.32 |
| 49 | YUM | YUM! Brands Inc. | 0.74 |
| 50 | ZTS | Zoetis Inc | 0.74 |


Hi Georg,
thanks for this new model. Another innovate approach of yours.
Two questions:
1. What is the ranking based on (in broad terms)?
2. 50 stocks is a lot to buy. Can you run this model with buying only 25 stocks or even/uneven numbers, which is then a more managable number?
3. How often are the stocks replaced (average holding period)?
Thanks.
1.Ranking system is based on growth, quality, value, sentiment, and technical factors.
2.We will not feature this model on iM. 50 positions is far too high for our members, and also holdings are not equal weight. We have it on P123 as a designer model which should become live end of Nov-2019.
The idea is to demonstrate that there is value to be had from Seeking Alpha’s listings. You can download the list from SA and design your own model with fewer positions. Hint: You can even do better by having a universe consisting of the under- and overcovered stocks.
3. Avg Days Held = 393. Very low turnover.
i’m bummed to see that this model will not be available on iM.
regardless, the high number of stocks is not unmanageable these days. there are some brokerages out there that offer free trades, such as robinhood and M1. M1, in particular, does the trading for you. instituting a 50-position portfolio of equal weight such as this would take about 5-10 minutes of setup.
We will try and reduce the number of positions for this model and possibly we have something we can use at iM. The current model’s positions are also not equal weighted.
re: equal weighting — oops, my bad. it would, however, still be easily manageable in that M1 brokerage i mentioned.
re: a model for iM — sounds good! hoping for the best
Hi Georg,
thank you for the numbers above.
Yes, a more manageable 20-25 stock portfolio here on IM would be great.
Looking forward to it !
Hello Georg and Anton,
Just in case you’re looking for any projects, there is a growing interest in private equity investments these days, and on that note I thought it might be interesting to see if there’s a way to time the stocks of publicly-traded asset managers whose portfolios are comprised mostly of private investments. The big ones that I know of are APO, CG, KKR and AB. These companies’ cash flows seem to be quite stable, but the stock prices not so much, so I thought there might be something from a fundamental or technical perspective that would allow a robust timing strategy to exist for the stocks.
Thanks a bunch,
John
John,
You can use the 1-wk SuperTimer to time the asset managers. When the 1-wk SuperTimer holds SPY invest in asset managers stocks, otherwise go to fixed income ETF.