
  |
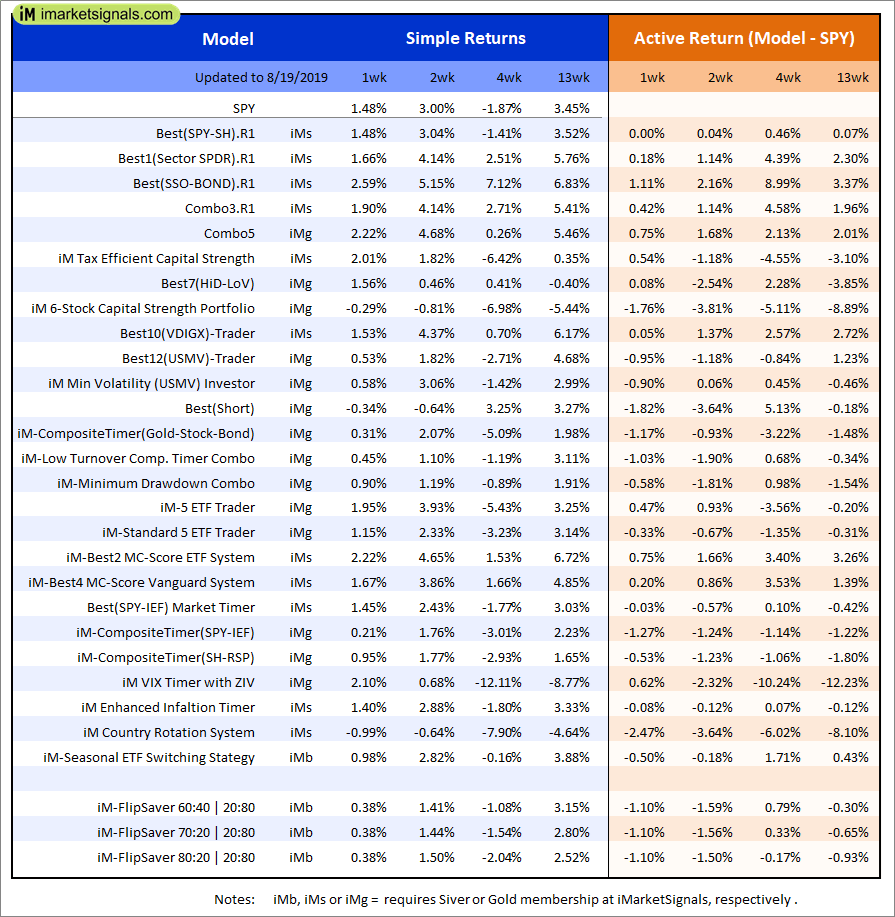
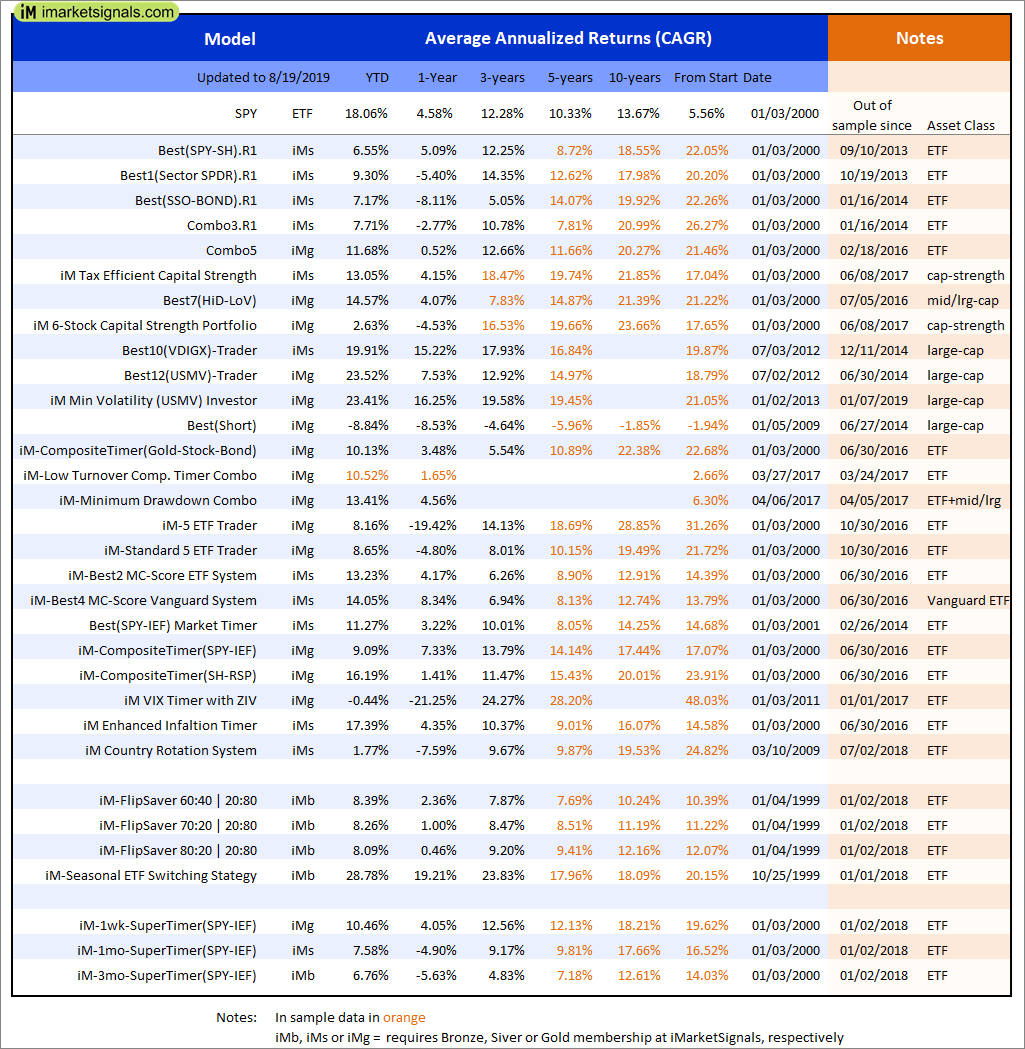
Out of sample performance summary of our models for the past 1, 2, 4 and 13 week periods. The active active return indicates how the models over- or underperformed the benchmark ETF SPY. Also the YTD, and the 1-, 3-, 5- and 10-year annualized returns are shown in the second table |
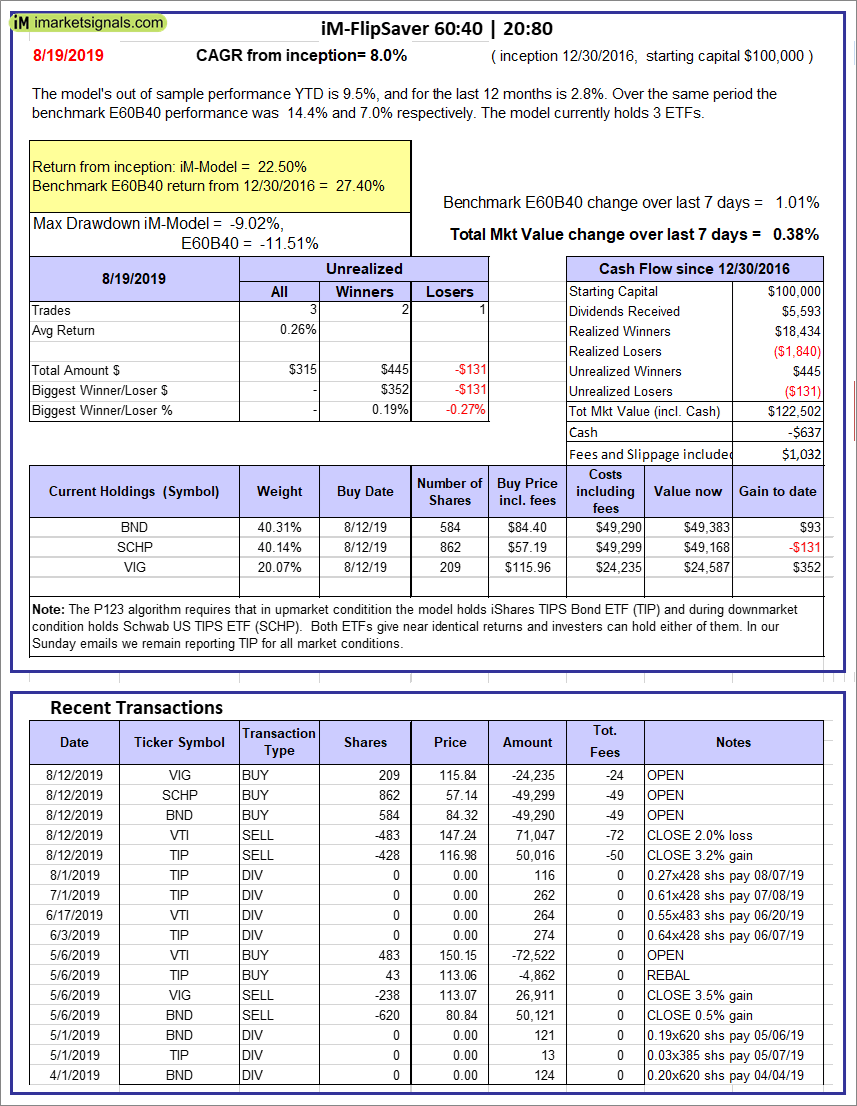 |
iM-FlipSaver 60:40 | 20:80 – 2017: The model’s out of sample performance YTD is 9.5%, and for the last 12 months is 2.8%. Over the same period the benchmark E60B40 performance was 14.4% and 7.0% respectively. Over the previous week the market value of iM-FlipSaver 80:20 | 20:80 gained 0.38% at a time when SPY gained 1.01%. A starting capital of $100,000 at inception on 7/16/2015 would have grown to $122,502 which includes -$637 cash and excludes $1,032 spent on fees and slippage. |
 |
iM-FlipSaver 70:30 | 20:80 – 2017: The model’s out of sample performance YTD is 9.3%, and for the last 12 months is 2.0%. Over the same period the benchmark E60B40 performance was 14.4% and 7.0% respectively. Over the previous week the market value of iM-FlipSaver 70:30 | 20:80 gained 0.38% at a time when SPY gained 1.01%. A starting capital of $100,000 at inception on 7/15/2015 would have grown to $124,497 which includes -$955 cash and excludes $1,158 spent on fees and slippage. |
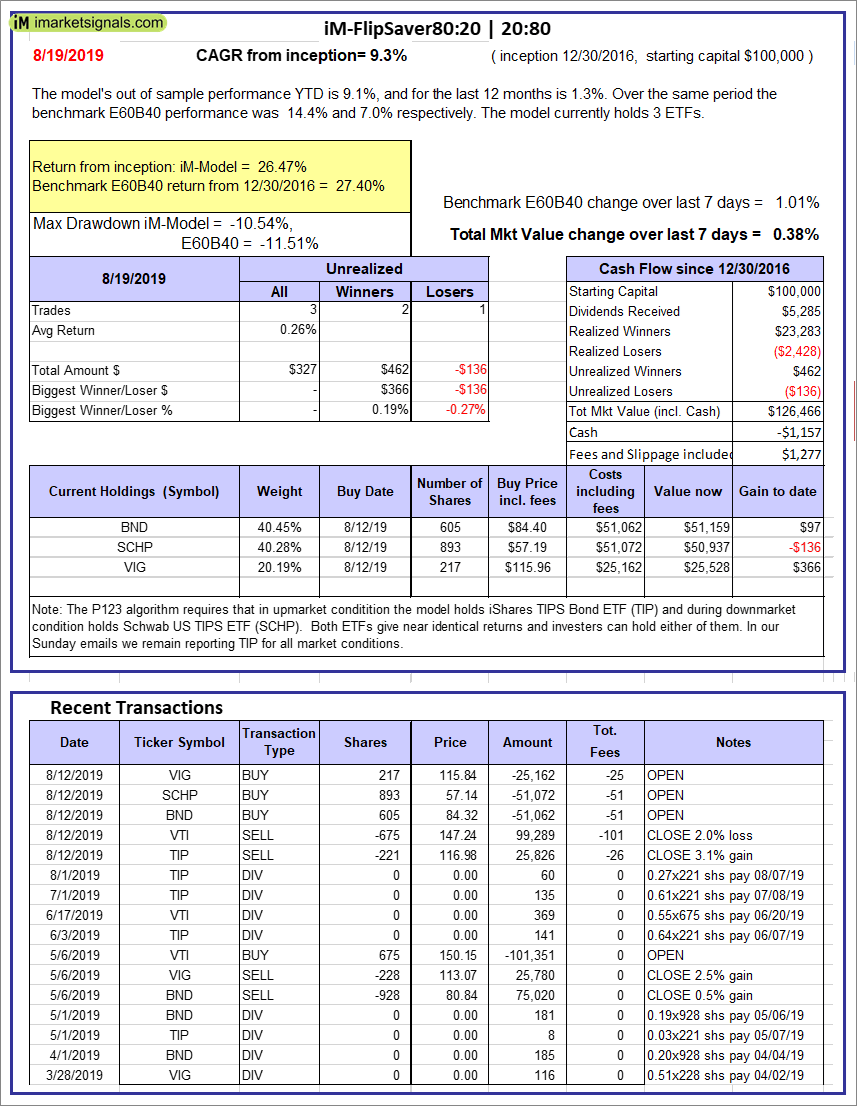 |
iM-FlipSaver 80:20 | 20:80 – 2017: The model’s out of sample performance YTD is 9.1%, and for the last 12 months is 1.3%. Over the same period the benchmark E60B40 performance was 14.4% and 7.0% respectively. Over the previous week the market value of iM-FlipSaver 80:20 | 20:80 gained 0.38% at a time when SPY gained 1.01%. A starting capital of $100,000 at inception on 1/2/2017 would have grown to $126,466 which includes -$1,157 cash and excludes $1,277 spent on fees and slippage. |
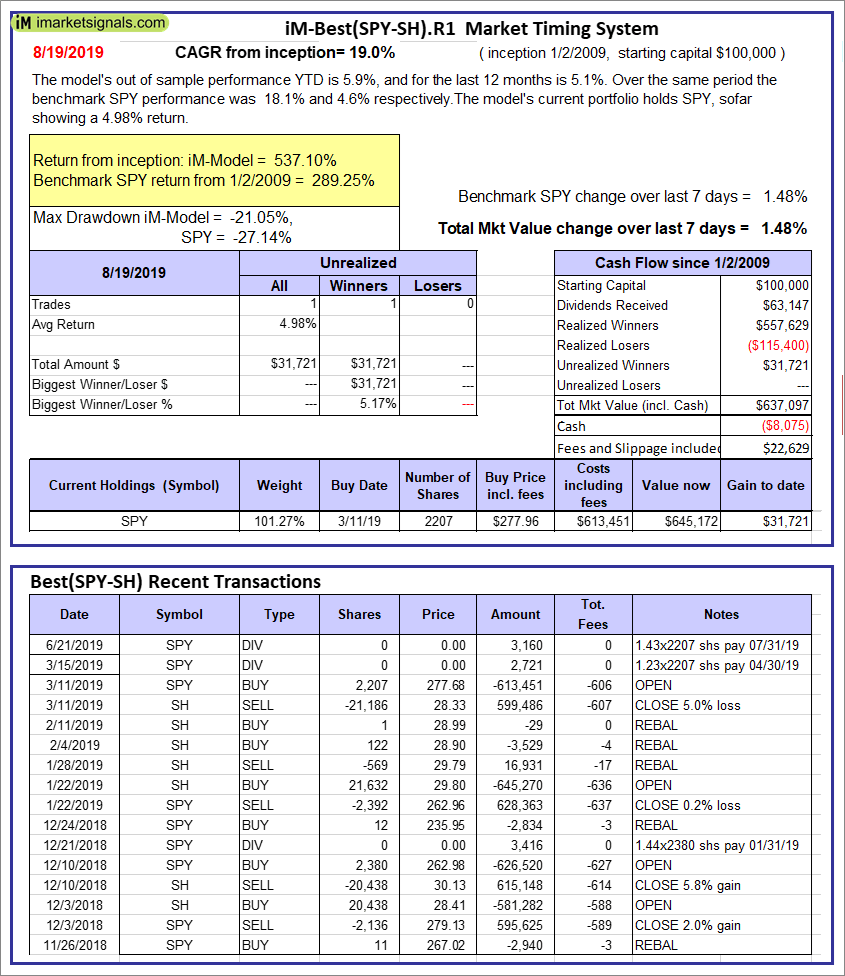 |
iM-Best(SPY-SH).R1: The model’s out of sample performance YTD is 5.9%, and for the last 12 months is 5.1%. Over the same period the benchmark SPY performance was 18.1% and 4.6% respectively. Over the previous week the market value of Best(SPY-SH) gained 1.48% at a time when SPY gained 1.48%. A starting capital of $100,000 at inception on 1/2/2009 would have grown to $637,097 which includes -$8,075 cash and excludes $22,629 spent on fees and slippage. |
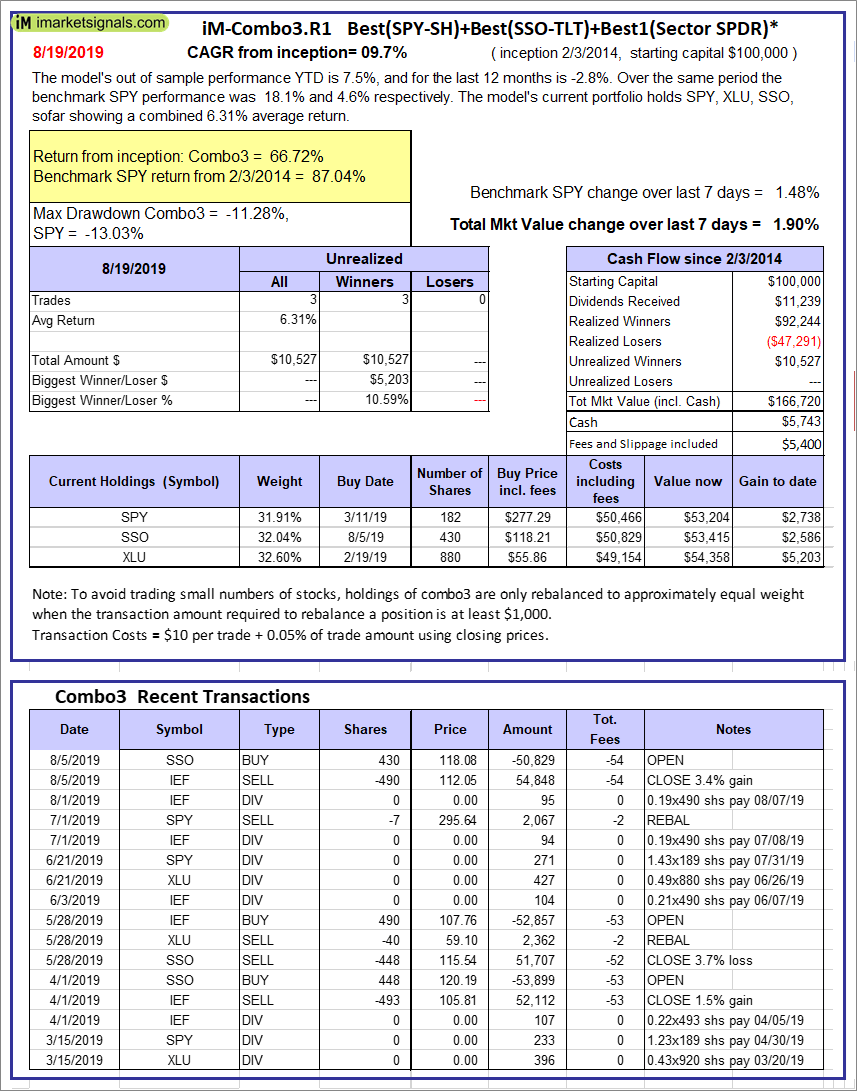 |
iM-Combo3.R1: The model’s out of sample performance YTD is 7.5%, and for the last 12 months is -2.8%. Over the same period the benchmark SPY performance was 18.1% and 4.6% respectively. Over the previous week the market value of iM-Combo3.R1 gained 1.90% at a time when SPY gained 1.48%. A starting capital of $100,000 at inception on 2/3/2014 would have grown to $166,720 which includes $5,743 cash and excludes $5,400 spent on fees and slippage. |
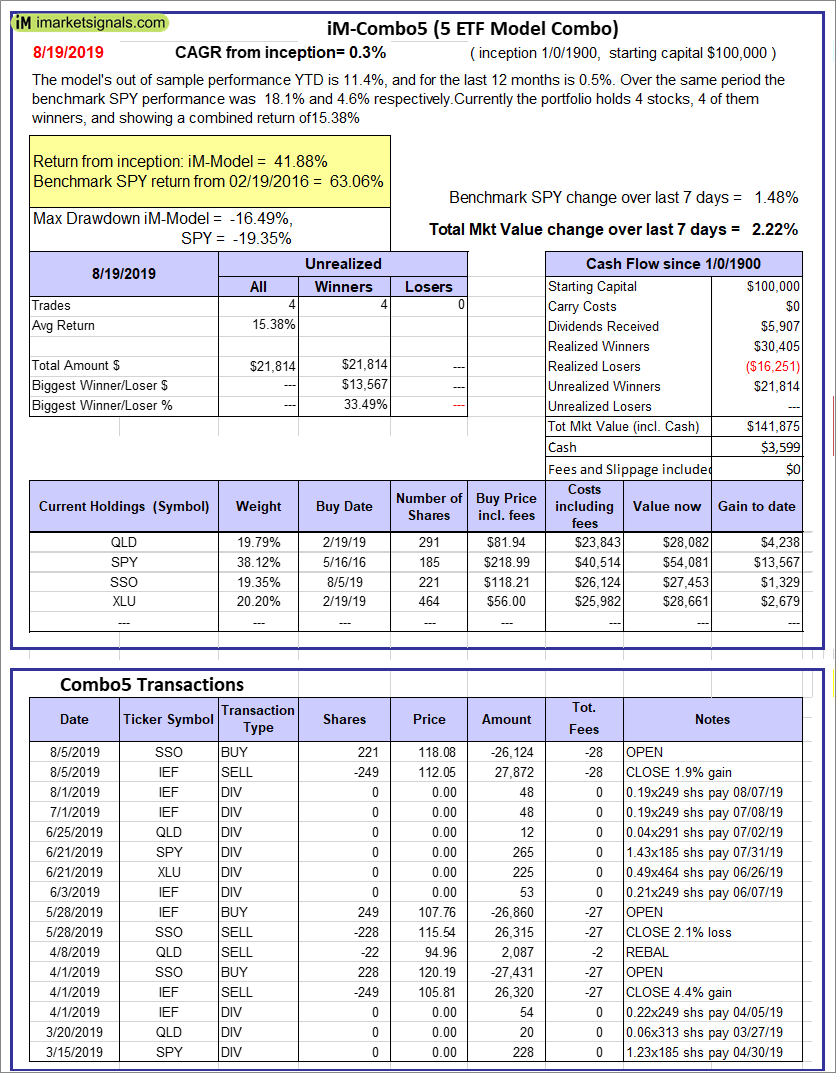 |
iM-Combo5: The model’s out of sample performance YTD is 11.4%, and for the last 12 months is 0.5%. Over the same period the benchmark SPY performance was 18.1% and 4.6% respectively. Over the previous week the market value of iM-Combo5 gained 2.22% at a time when SPY gained 1.48%. A starting capital of $100,000 at inception on 2/22/2016 would have grown to $141,875 which includes $3,599 cash and excludes $0 spent on fees and slippage. |
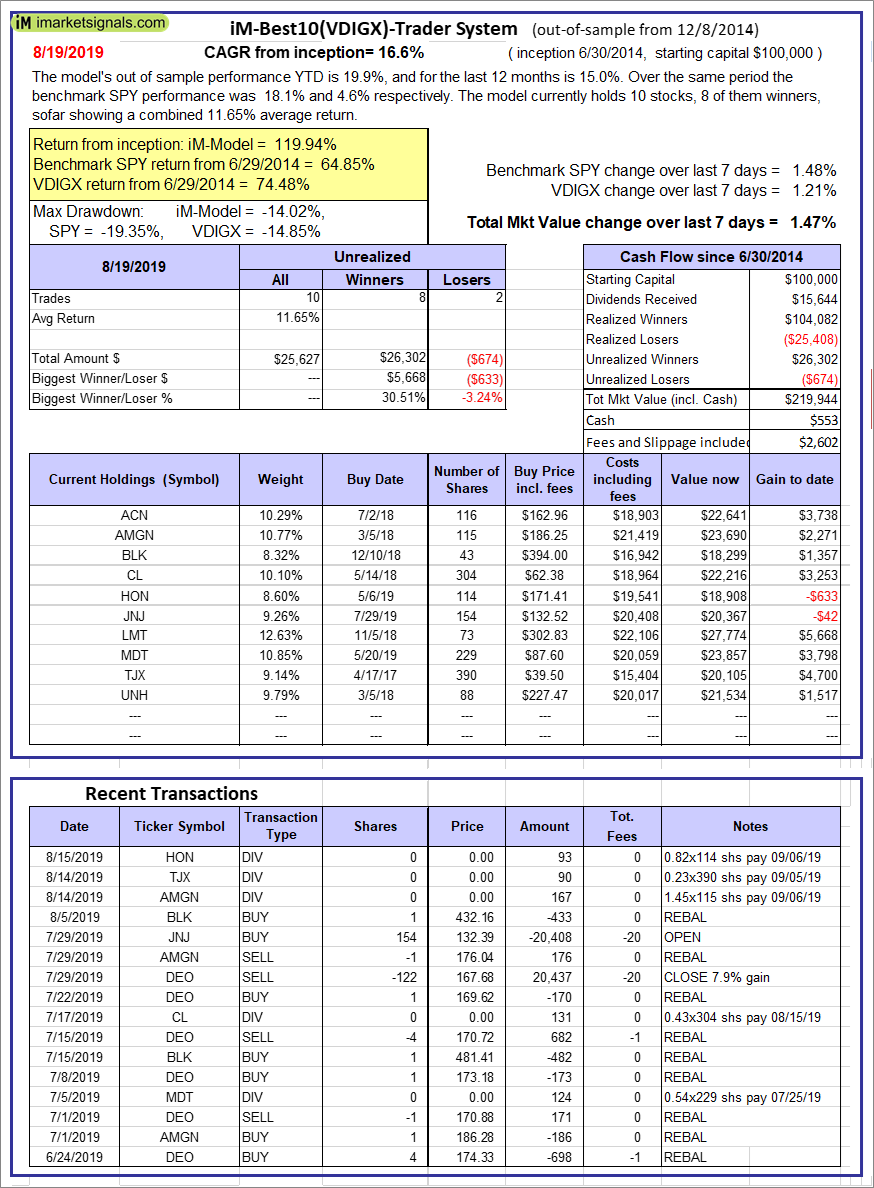 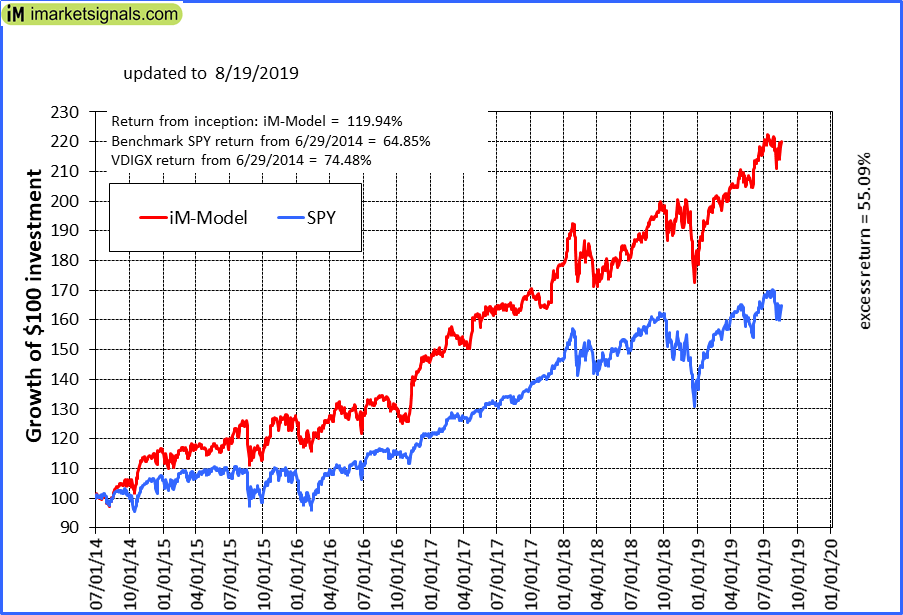 |
iM-Best10(VDIGX)-Trader: The model’s out of sample performance YTD is 19.9%, and for the last 12 months is 15.0%. Over the same period the benchmark SPY performance was 18.1% and 4.6% respectively. Since inception, on 7/1/2014, the model gained 119.94% while the benchmark SPY gained 64.85% and VDIGX gained 74.48% over the same period. Over the previous week the market value of iM-Best10(VDIGX) gained 1.47% at a time when SPY gained 1.48%. A starting capital of $100,000 at inception on 7/1/2014 would have grown to $219,944 which includes $553 cash and excludes $2,602 spent on fees and slippage. |
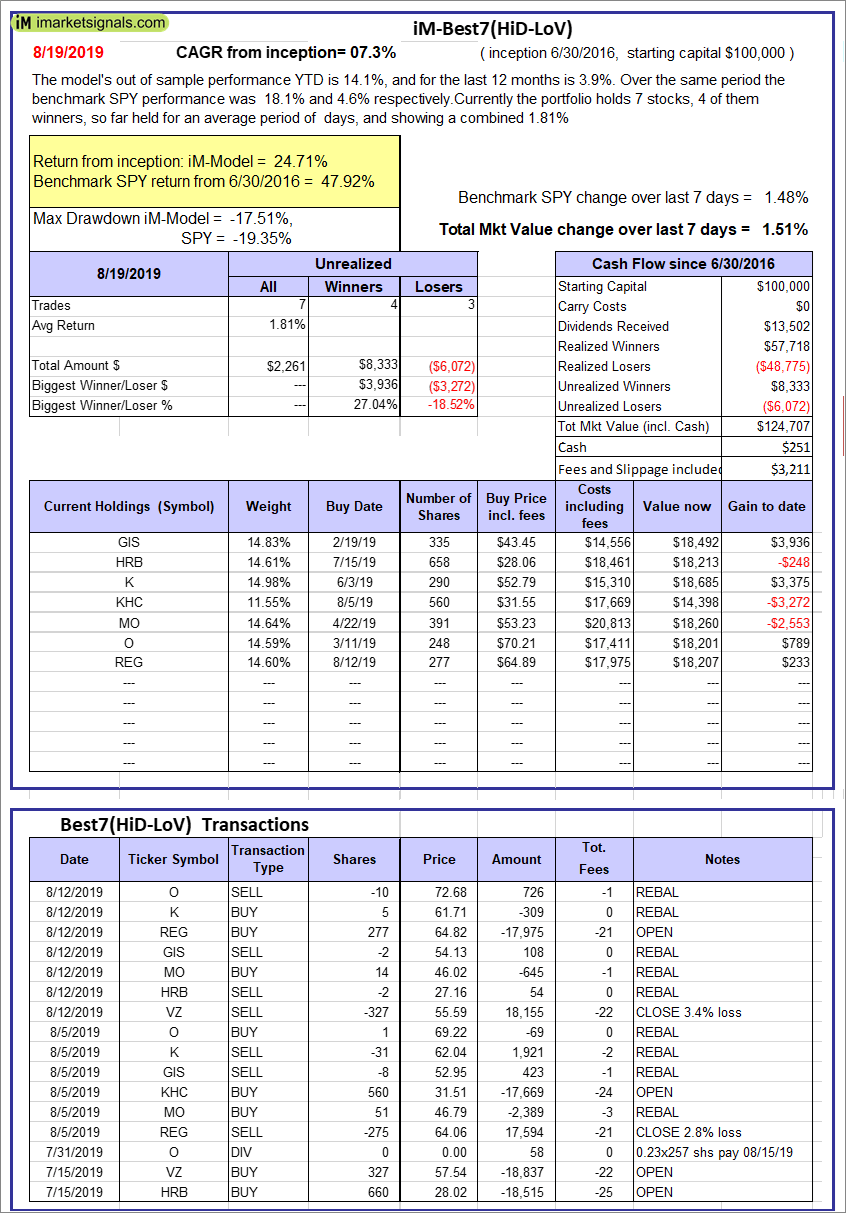 |
iM-Best7(HiD-LoV): The model’s out of sample performance YTD is 14.1%, and for the last 12 months is 3.9%. Over the same period the benchmark SPY performance was 18.1% and 4.6% respectively. Over the previous week the market value of iM-Best7(HiD-LoV) gained 1.51% at a time when SPY gained 1.48%. A starting capital of $100,000 at inception on 6/30/2016 would have grown to $124,707 which includes $251 cash and excludes $3,211 spent on fees and slippage. |
 |
iM 6-Stock Capital Strength Portfolio: The model’s out of sample performance YTD is 2.2%, and for the last 12 months is -4.8%. Over the same period the benchmark SPY performance was 18.1% and 4.6% respectively. Over the previous week the market value of the iM 6-Stock Capital Strength Portfolio gained -0.44% at a time when SPY gained 1.48%. A starting capital of $100,000 at inception on 10/28/2016 would have grown to $154,020 which includes $1,051 cash and excludes $1,037 spent on fees and slippage. |
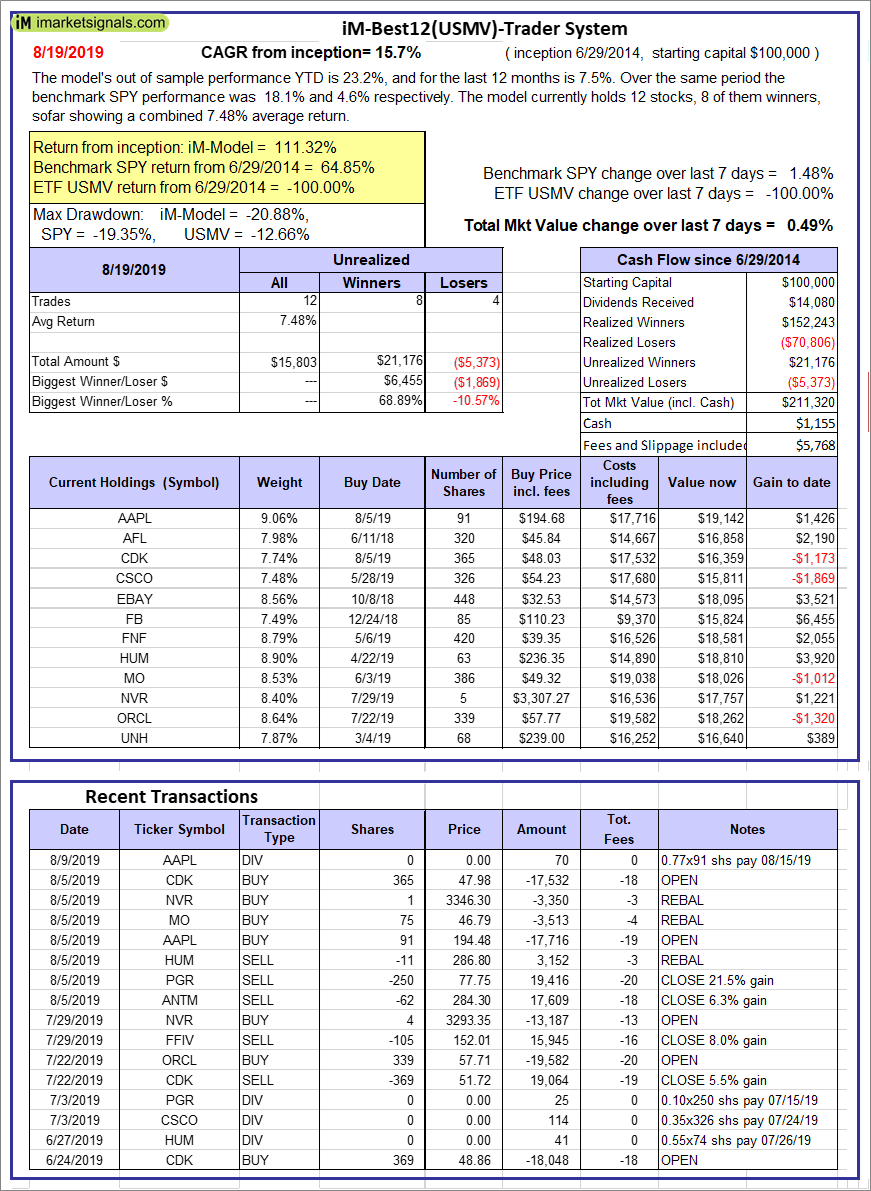 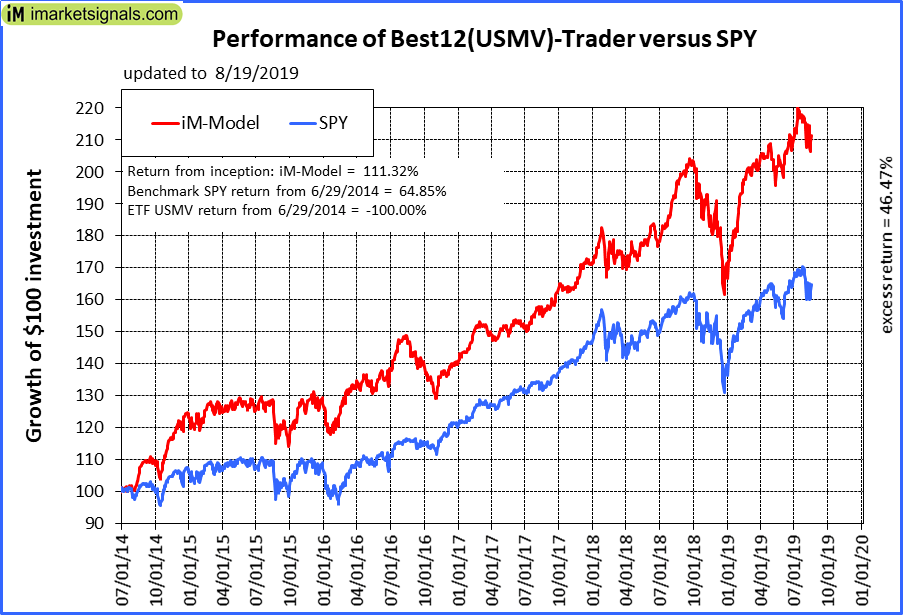 |
iM-Best12(USMV)-Trader: The model’s out of sample performance YTD is 23.2%, and for the last 12 months is 7.5%. Over the same period the benchmark SPY performance was 18.1% and 4.6% respectively. Since inception, on 6/30/2014, the model gained 111.32% while the benchmark SPY gained 64.85% and the ETF USMV gained -100.00% over the same period. Over the previous week the market value of iM-Best12(USMV)-Trader gained 0.49% at a time when SPY gained 1.48%. A starting capital of $100,000 at inception on 6/30/2014 would have grown to $211,320 which includes $1,155 cash and excludes $5,768 spent on fees and slippage. |
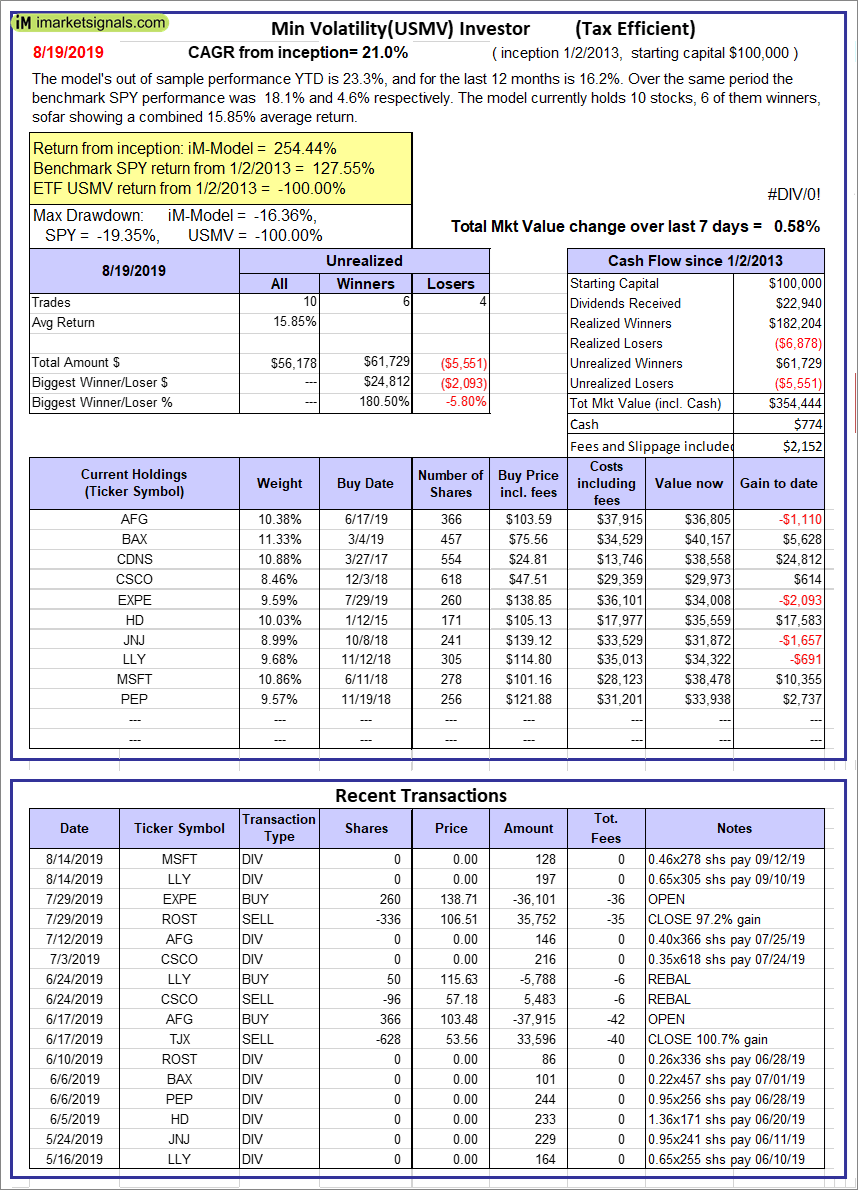 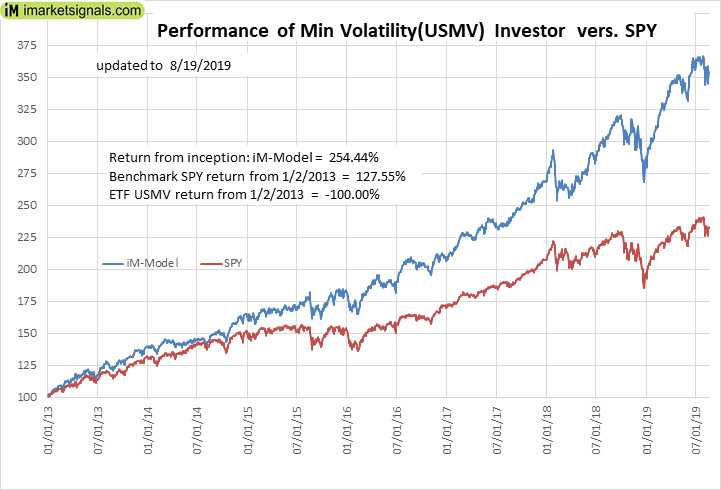 |
iM Min Volatility (USMV) Investor: The model’s out of sample performance YTD is 26.2%, and for the last 12 months is 24.1%. Over the same period the benchmark SPY performance was 19.9% and 9.9% respectively. Since inception, on 1/3/2013, the model gained 262.93% while the benchmark SPY gained 131.05% and the ETF USMV gained 142.65% over the same period. Over the previous week the market value of iM Min Volatility (USMV) Investor gained 1.22% at a time when SPY gained 0.39%. A starting capital of $100,000 at inception on 1/3/2013 would have grown to $362,932 which includes $651 cash and excludes $2,081 spent on fees and slippage. |
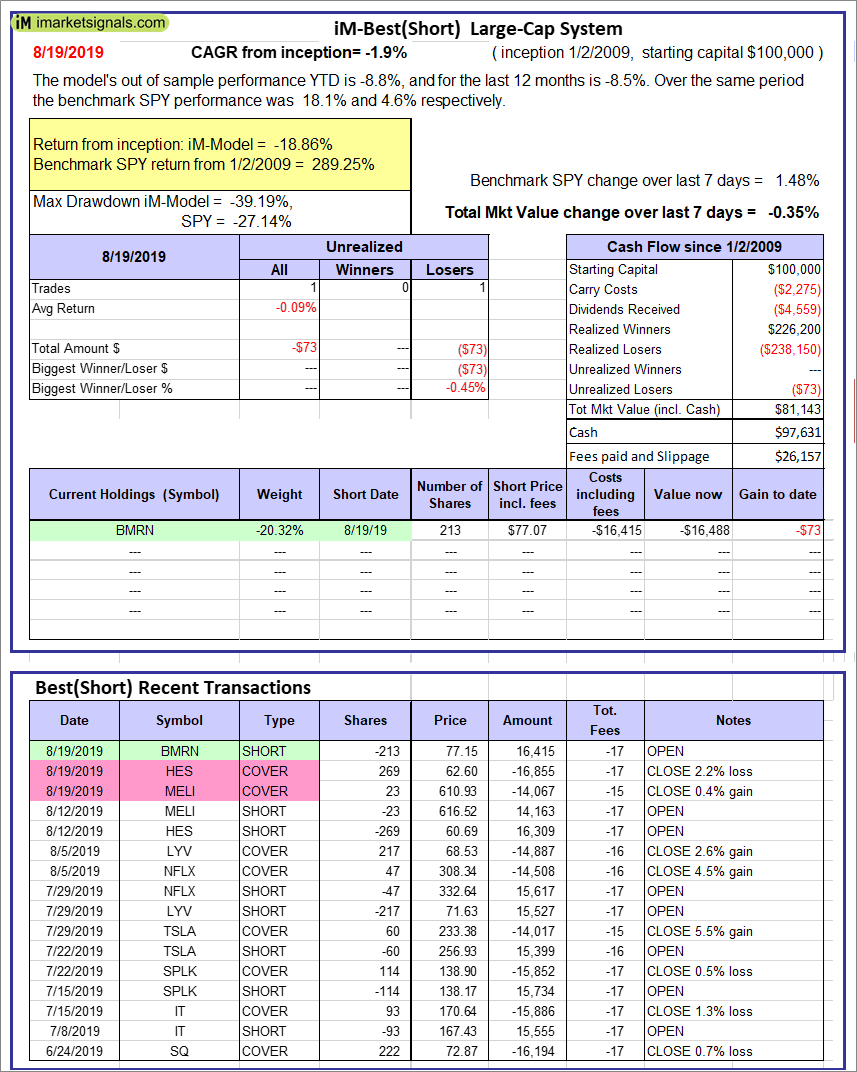 |
iM-Best(Short): The model’s out of sample performance YTD is -8.8%, and for the last 12 months is -8.5%. Over the same period the benchmark SPY performance was 18.1% and 4.6% respectively. Over the previous week the market value of iM-Best(Short) gained -0.35% at a time when SPY gained 1.48%. Over the period 1/2/2009 to 8/19/2019 the starting capital of $100,000 would have grown to $81,143 which includes $97,631 cash and excludes $26,157 spent on fees and slippage. |
 |
iM-Best2 MC-Score ETF System: The model’s out of sample performance YTD is 13.2%, and for the last 12 months is 4.2%. Over the same period the benchmark SPY performance was 18.1% and 4.6% respectively. Over the previous week the market value of the iM-Best2 MC-Score ETF System gained 2.22% at a time when SPY gained 1.48%. A starting capital of $100,000 at inception on 6/30/2016 would have grown to $120,108 which includes $65 cash and excludes $672 spent on fees and slippage. |
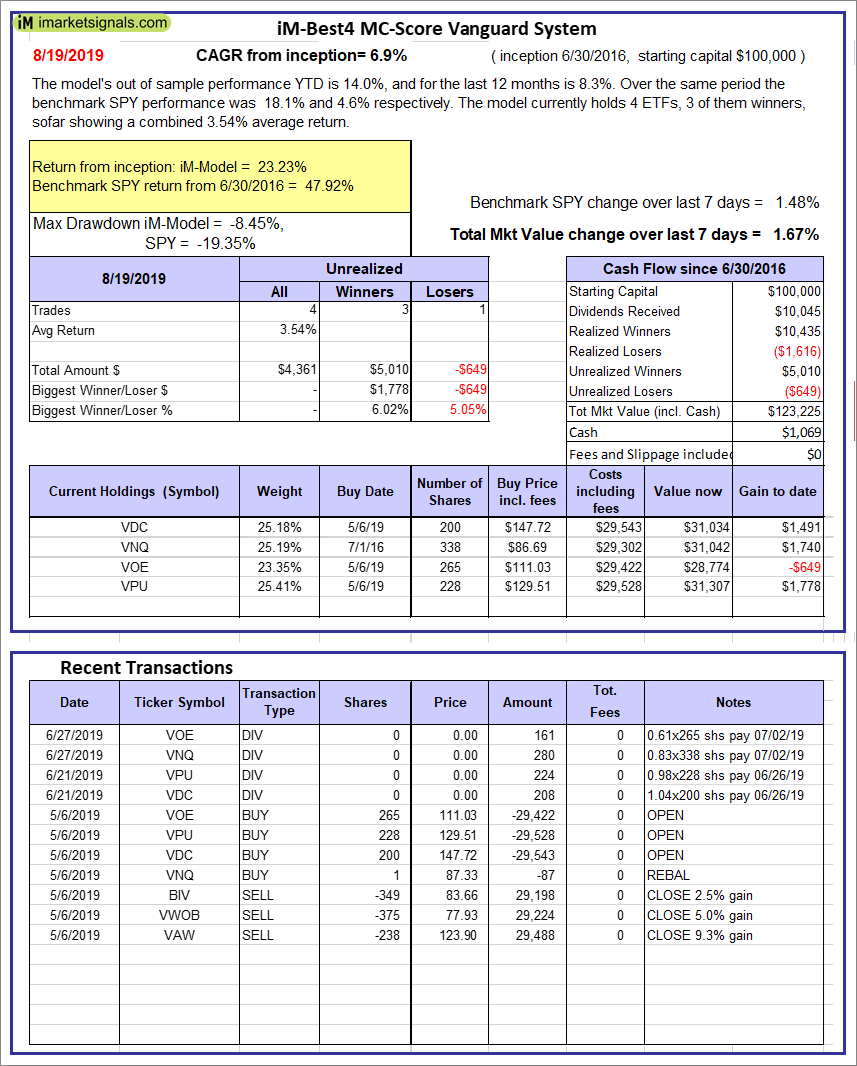 |
iM-Best4 MC-Score Vanguard System: The model’s out of sample performance YTD is 14.0%, and for the last 12 months is 8.3%. Over the same period the benchmark SPY performance was 18.1% and 4.6% respectively. Over the previous week the market value of the iM-Best4 MC-Score Vanguard System gained 1.67% at a time when SPY gained 1.48%. A starting capital of $100,000 at inception on 6/30/2016 would have grown to $123,225 which includes $1,069 cash and excludes $00 spent on fees and slippage. |
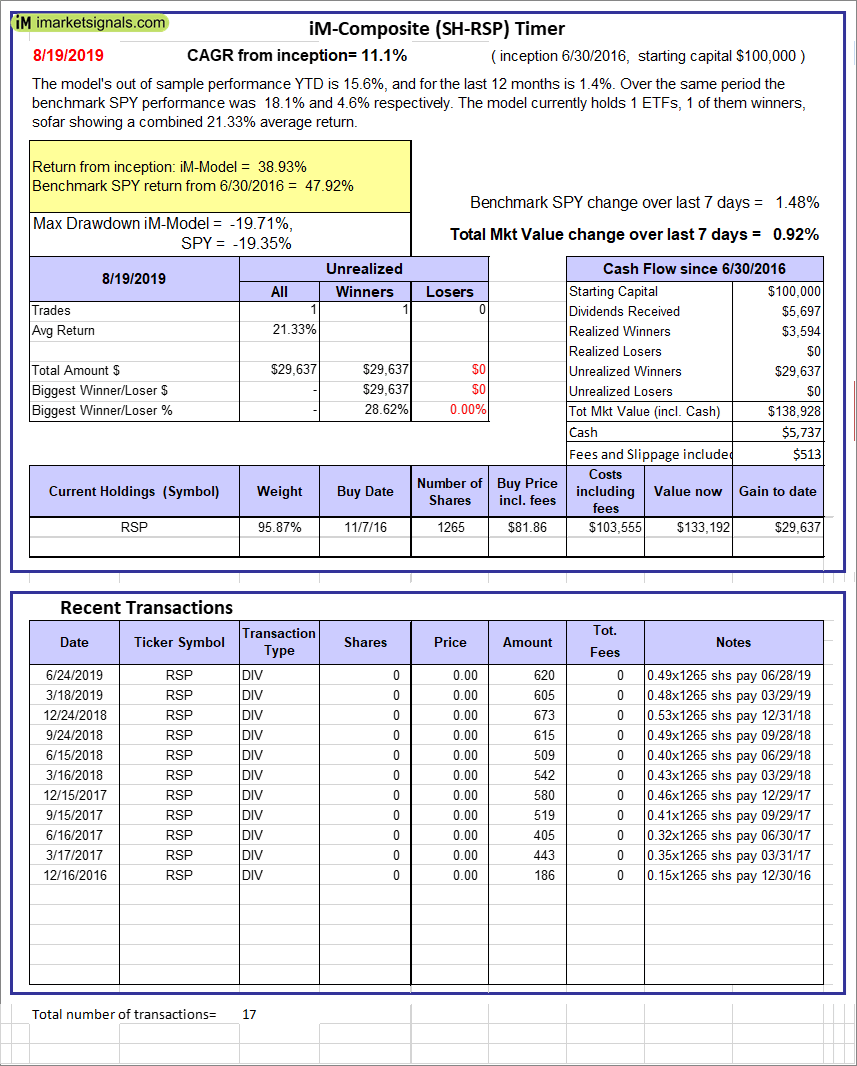 |
iM-Composite (SH-RSP) Timer: The model’s out of sample performance YTD is 15.6%, and for the last 12 months is 1.4%. Over the same period the benchmark SPY performance was 18.1% and 4.6% respectively. Over the previous week the market value of the iM-Composite (SH-RSP) Timer gained 0.92% at a time when SPY gained 1.48%. A starting capital of $100,000 at inception on 6/30/2016 would have grown to $138,928 which includes $5,737 cash and excludes $513 spent on fees and slippage. |
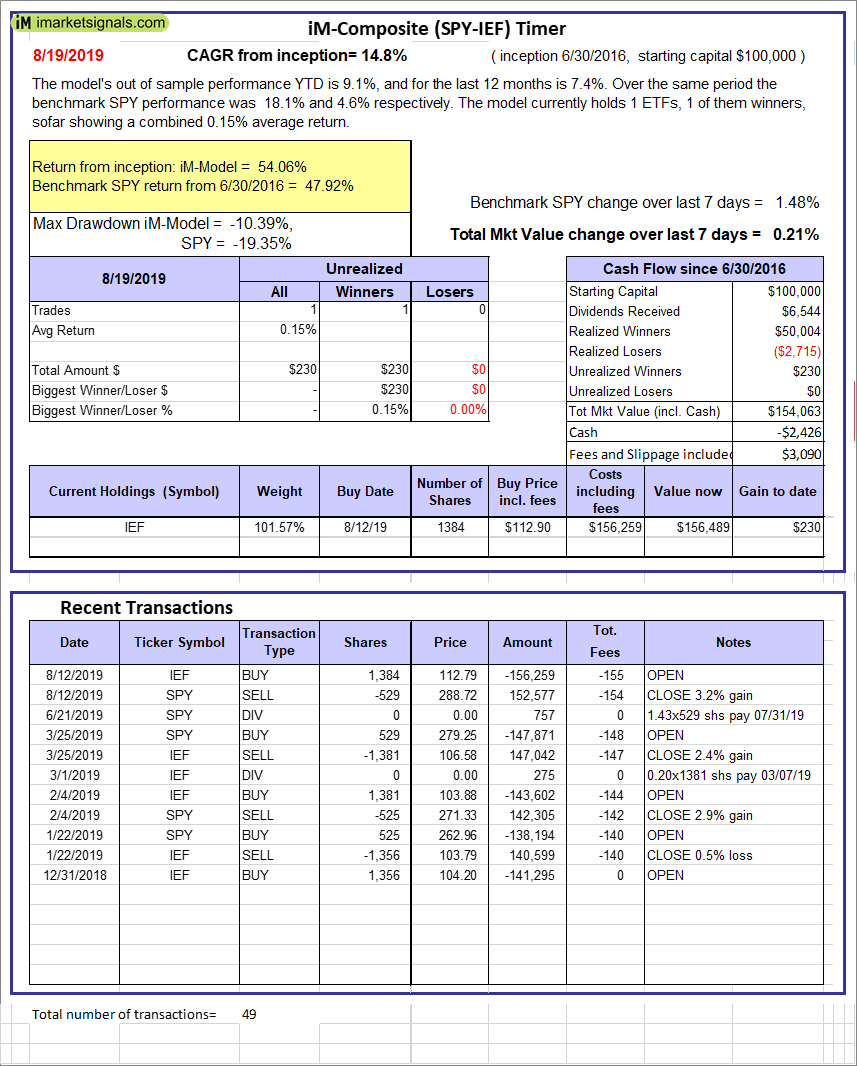 |
iM-Composite (SPY-IEF) Timer: The model’s out of sample performance YTD is 9.1%, and for the last 12 months is 7.4%. Over the same period the benchmark SPY performance was 18.1% and 4.6% respectively. Over the previous week the market value of the iM-Composite (SPY-IEF) Timer gained 0.21% at a time when SPY gained 1.48%. A starting capital of $100,000 at inception on 6/30/2016 would have grown to $154,063 which includes -$2,426 cash and excludes $3,090 spent on fees and slippage. |
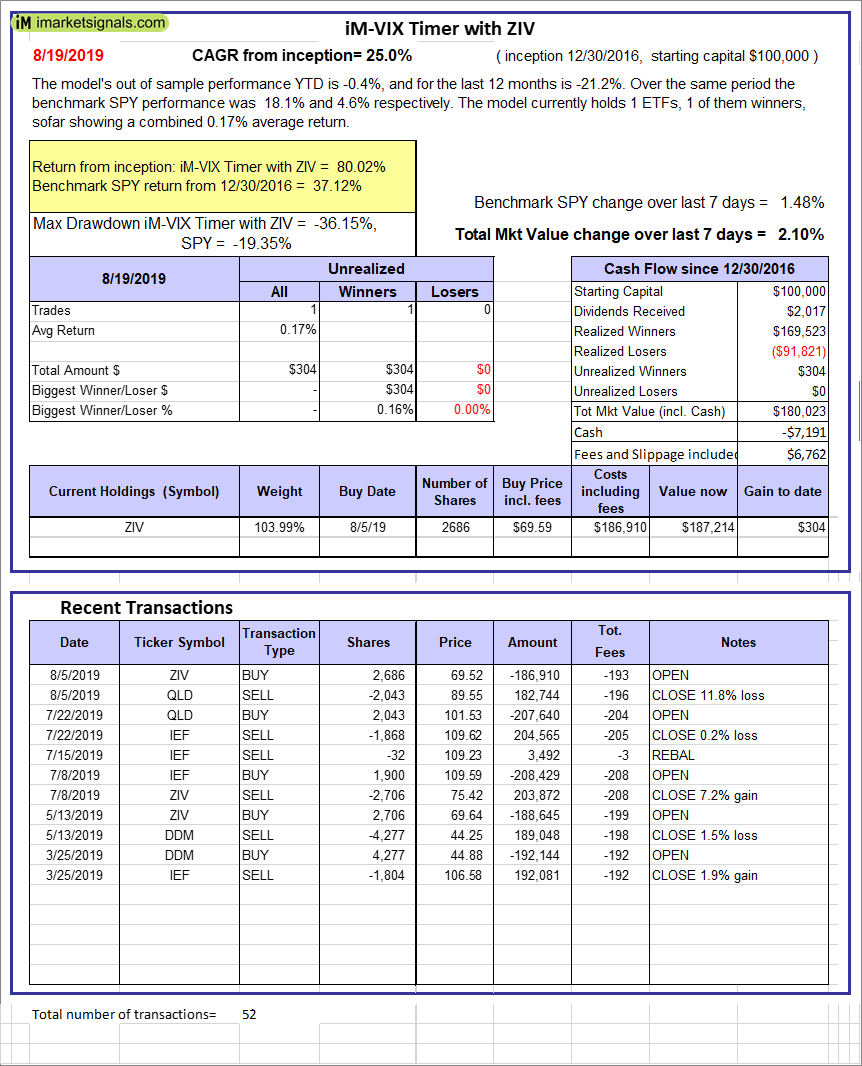 |
iM-VIX Timer with ZIV: The model’s out of sample performance YTD is -0.4%, and for the last 12 months is -21.2%. Over the same period the benchmark SPY performance was 18.1% and 4.6% respectively. Over the previous week the market value of the iM-VIX Timer with ZIV gained 2.10% at a time when SPY gained 1.48%. A starting capital of $100,000 at inception on 6/30/2016 would have grown to $180,023 which includes -$7,191 cash and excludes $6,762 spent on fees and slippage. |
 |
iM-Composite(Gold-Stocks-Bond) Timer: The model’s out of sample performance YTD is 13.2%, and for the last 12 months is 6.3%. Over the same period the benchmark SPY performance was 18.1% and 4.6% respectively. Over the previous week the market value of the iM-Composite(Gold-Stocks-Bond) Timer gained 0.31% at a time when SPY gained 1.48%. A starting capital of $100,000 at inception on 6/30/2016 would have grown to $124,173 which includes -$1,537 cash and excludes $3,140 spent on fees and slippage. |
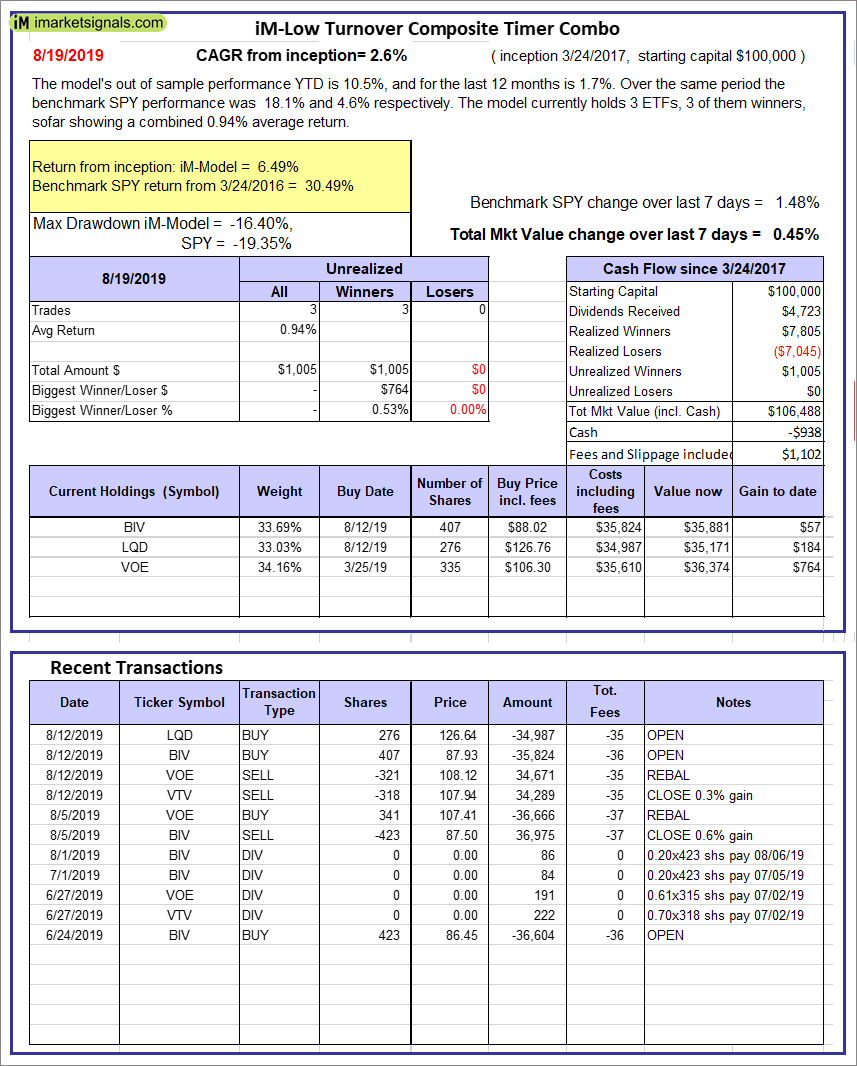 |
iM-Low Turnover Composite Timer Combo: The model’s out of sample performance YTD is 10.5%, and for the last 12 months is 1.7%. Over the same period the benchmark SPY performance was 18.1% and 4.6% respectively. Over the previous week the market value of the iM-Low Turnover Composite Timer Combo gained 0.45% at a time when SPY gained 1.48%. A starting capital of $100,000 at inception on 3/24/27 would have grown to $106,488 which includes -$938 cash and excludes $1,102 spent on fees and slippage. |
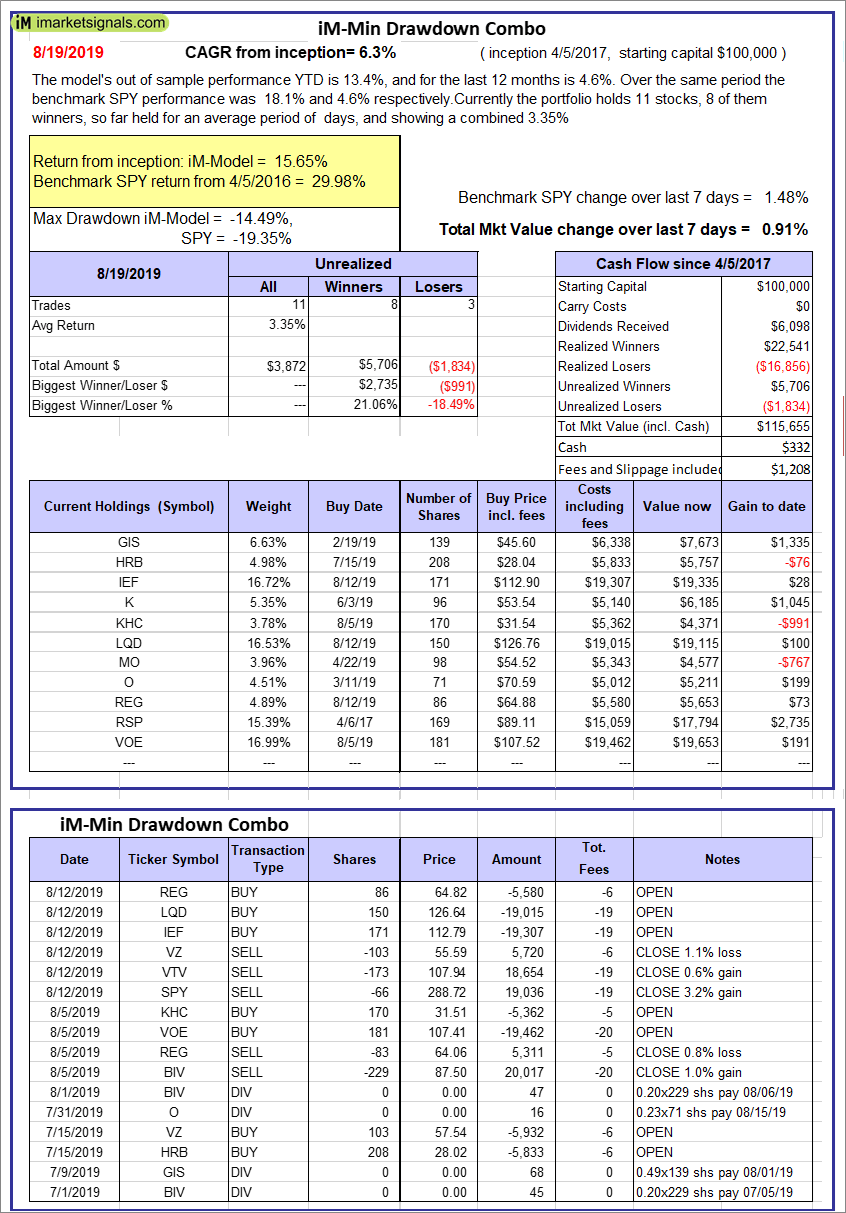 |
iM-Min Drawdown Combo: The model’s out of sample performance YTD is 13.4%, and for the last 12 months is 4.6%. Over the same period the benchmark SPY performance was 18.1% and 4.6% respectively. Over the previous week the market value of the iM-Min Drawdown Combo gained 0.91% at a time when SPY gained 1.48%. A starting capital of $100,000 at inception on 4/5/2017 would have grown to $115,655 which includes $332 cash and excludes $1,208 spent on fees and slippage. |
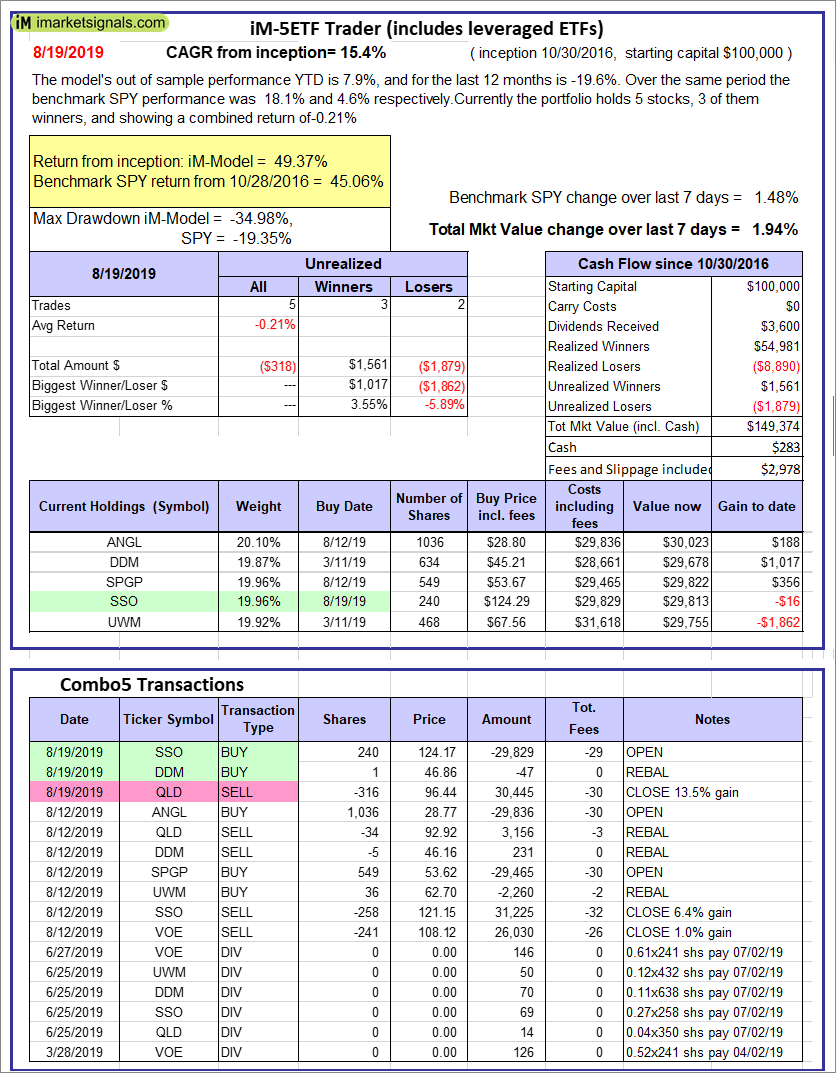 |
iM-5ETF Trader (includes leveraged ETFs): The model’s out of sample performance YTD is 7.9%, and for the last 12 months is -19.6%. Over the same period the benchmark SPY performance was 18.1% and 4.6% respectively. Over the previous week the market value of the iM-5ETF Trader (includes leveraged ETFs) gained 1.94% at a time when SPY gained 1.48%. A starting capital of $100,000 at inception on 10/30/2016 would have grown to $149,374 which includes $283 cash and excludes $2,978 spent on fees and slippage. |
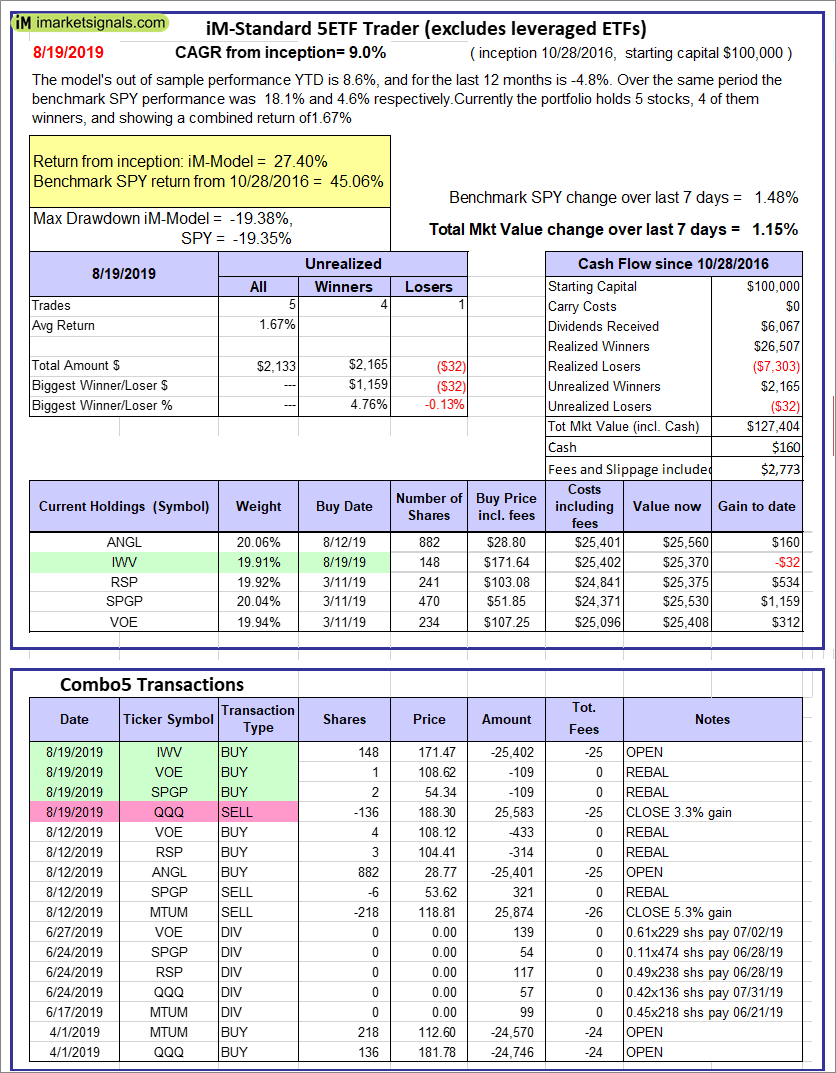 |
iM-Standard 5ETF Trader (excludes leveraged ETFs): The model’s out of sample performance YTD is 8.6%, and for the last 12 months is -4.8%. Over the same period the benchmark SPY performance was 18.1% and 4.6% respectively. Over the previous week the market value of the iM-Standard 5ETF Trader (excludes leveraged ETFs) gained 1.15% at a time when SPY gained 1.48%. A starting capital of $100,000 at inception on 10/30/2016 would have grown to $127,404 which includes $160 cash and excludes $2,773 spent on fees and slippage. |
iM-Best Reports – 8/19/2019
Posted in pmp SPY-SH
Leave a Reply
You must be logged in to post a comment.