Is your investment strategy protecting your assets from the next recession? Our Business Cycle Index is a tool to help you gauge recession risk.
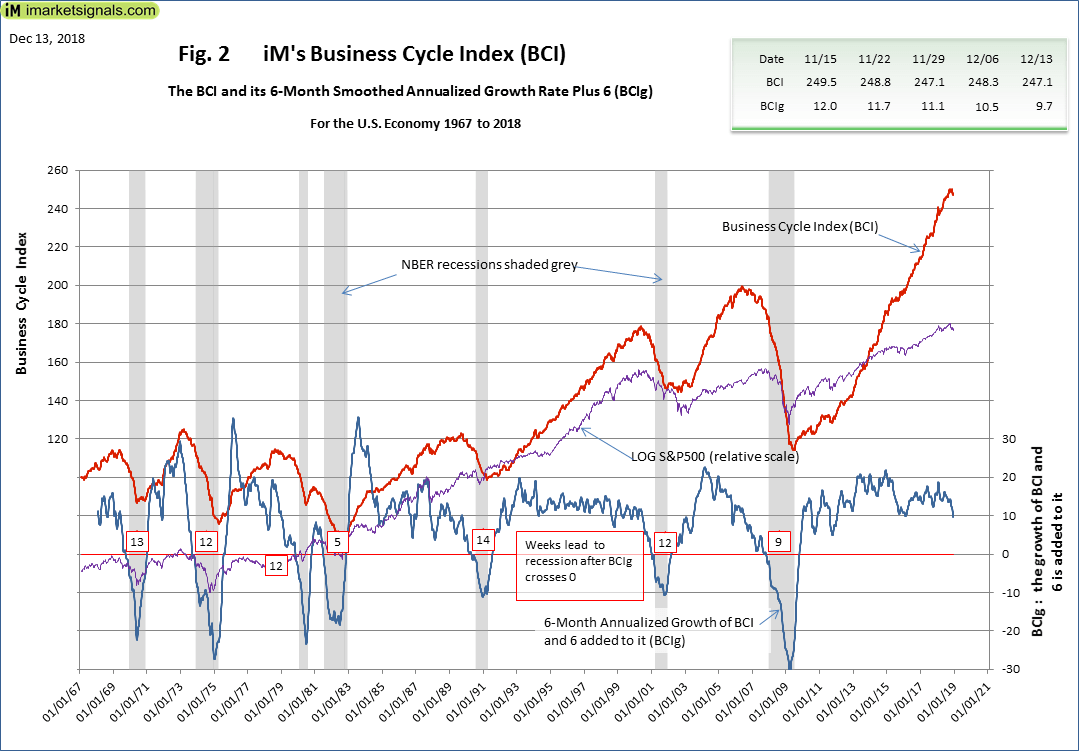
Back testing the BCI (short for Business Cycle Index) shows that it would have provided, on average, a 20-week leading signal for the past seven recessions.
Update 12/13/2018
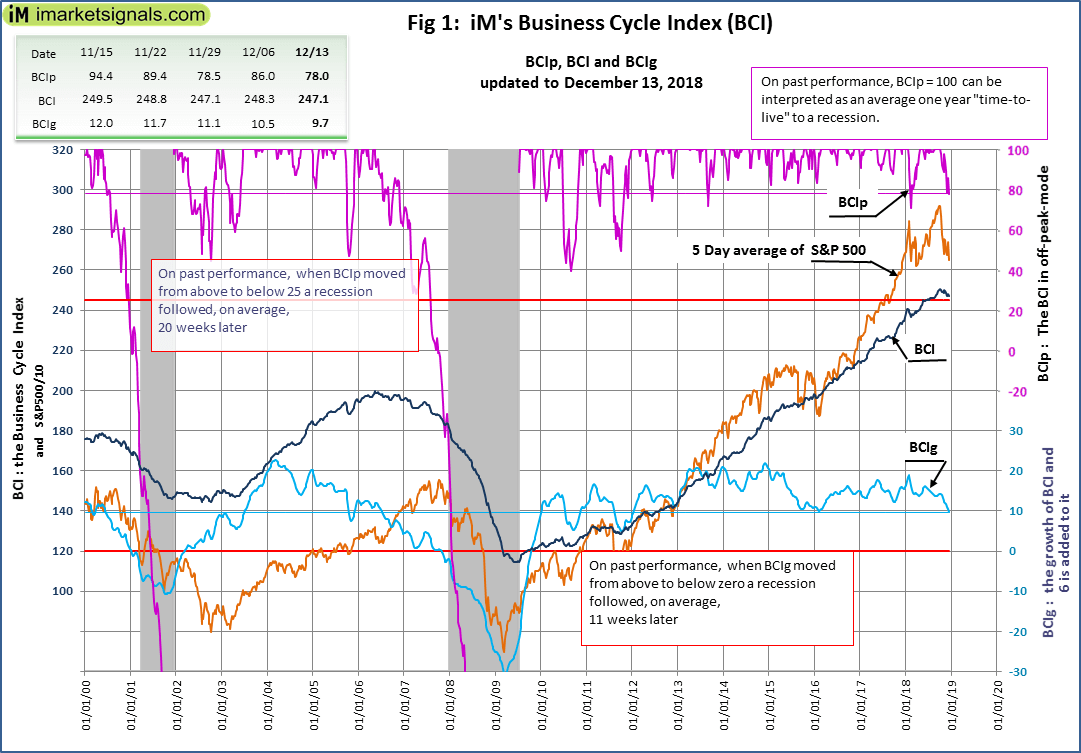
The BCI at 247.1 is below last week’s 248.3, and remains below this business cycle’s peak as indicated by the BCIp at 78.0. Also, the 6-month smoothed annualized growth BCIg at 9.7, is below last week’s 10.5. Both BCIp and BCIg do not signaling a recession..
Figure 1 plots BCIp, BCI, BCIg, the S&P500, and the thresholds (red lines) that need to be crossed from above to below to signal a looming recession.
The Business Cycle Index
Nobody can predict the arrival date of the next recession. However, using freely available economic data we derive a reliable signal that warns of an oncoming recession. We designed the Business Cycle Index to signal well in advance the beginning of a NBER-recession. The BCI uses the below listed economic data, downloaded from FRED.
- 10-year treasury yield (daily)
- 3-month treasury bill yield (daily)
- S&P500 (daily)
- Continues Claims Seasonally Adjusted (weekly)
- All Employees: Total Private Industries (monthly)
- New houses for sale (monthly)
- New houses sold (monthly)
The 6-month smoothed annualized growth rate of a series is a well-established method to extract an indicator from it. We use this method to obtain BCIg, i.e. the calculated growth rate with 6.0 added to it. The BCIg generates on past performance an average 11-week leading recession signal when it falls below zero.
Also, the index BCI retreats from its cyclic peak before a recession in a well-defined manner. This is the basis for the alternative indicator BCIp (and its variant BCIw) which gives an average 20-week leading signal to the next recession when BCIp falls below 25.
A more detailed description of the BCI can be found here.
Investment Strategy
As a guide on how to use the BCI refer to Exit Signals for the Stock Market from iM’s Business Cycle Index and to Table 1 in this post.
Figure 2 graphs the history of BCI, BCIg, and the LOG(S&P500) since July 1967, and Figure 3 plots the history of BCIp. Overall 46 years of history that includes the seven last recessions each of which the BCIg, and BCIp, managed to signal. These graphics also include the weeks lead signaled to the then next recession.