- Stocks usually perform poorly when inflation is on the rise. Using the inflation rate, we developed a market timer according to two simple rules.
- Switching according to the Timer signals between the S&P500 with dividends and a money-market fund would have provided from Aug-1953 to end of Jan-2017 and annualized return of 12.69%.
- Over the same period buy-and-hold of the S&P500 with dividends showed an annualized return of 10.08%, producing about a quarter of the total return of the Timer model.
The inflation rate (INF) is the 12-month rate of change of the consumer price index (CPI). The CPI is provided by the Department of Labor Statistics usually during the third week after the month to which it refers.
Rules
- Sell Rule for stocks:
- INF > 6-mo SMA(INF) + 0.75% and INF>2
- Sell when the inflation rate exceeds its 6-month moving average plus 0.75% and also exceeds 2.0%
- Buy Rule for stocks:
- INF < 6-mo SMA(INF) – 0.20%
- Buy when the inflation rate becomes less than its 6-month moving average minus 0.20%.
Performance
We calculated a hypothetical fund SPY* based on the performance of the S&P 500 with dividends reinvested by splicing the data from the SPDR S&P 500 ETF (SPY) from 1993 to 2017, the Vanguard 500 Index Fund (VFINX) from 1980 to 1993, and before that from 1953 to 1980 daily data of the S&P 500 with monthly dividends taken from the Shiller CAPE data.
We simulated a hypothetical money market fund SHV* with the Federal Funds Rate from 1953 to 2007 and thereafter spliced the iShares Short Treasury Bond ETF (SHV) to it.
All trading is assumed to occur on the first trading day of the week after the 20th day of the month when CPI is known for the preceding month. A backtest of this model starting in 1953 provided the first buy signal for stocks on Aug-24-1953.
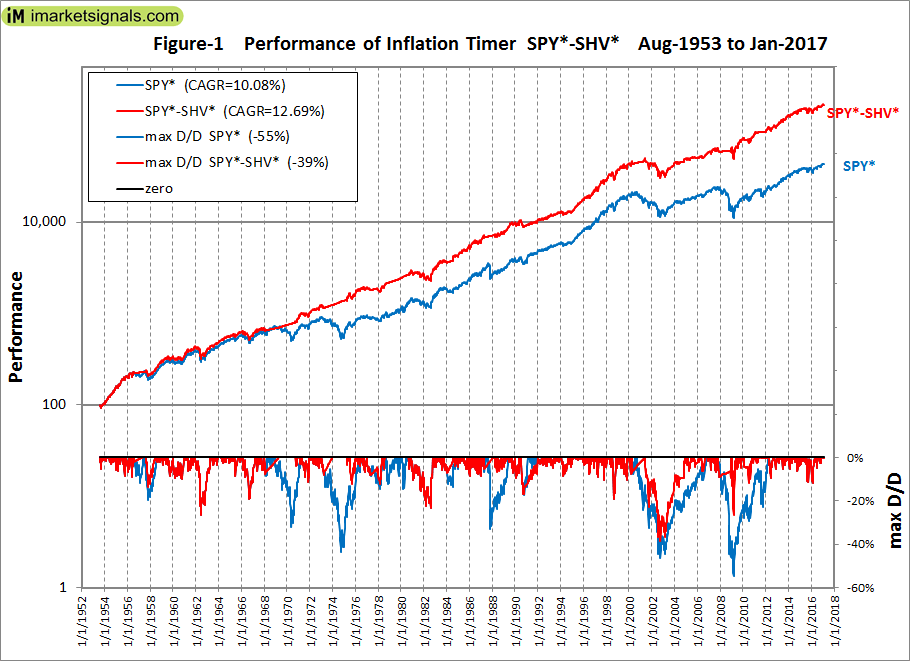
Over the period Aug-24-1953 to Jan-30-2017 the model, switching between SPY* and SHV*, showed an annualized return of 12.69% with a maximum drawdown of -39% in 2002. Buy-and-hold SPY* gave an annualized return of 10.08% with a maximum drawdown of -55% in 2009 (Figure-1).
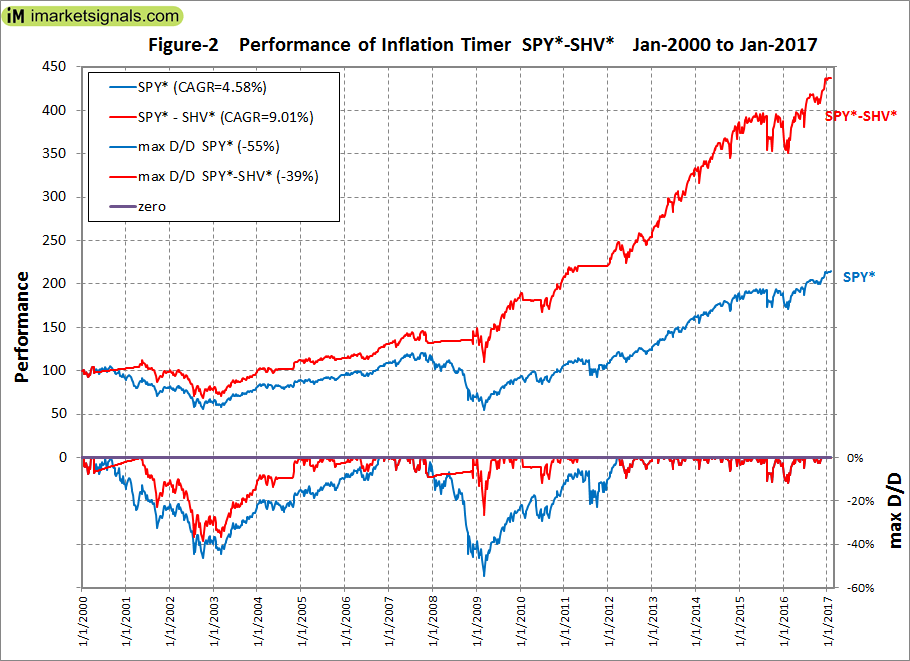
Over the period 1/3/2000 to Jan-30-2017 the model showed an annualized return of 9.01% with a maximum drawdown of -39% in 2002. Buy-and-hold SPY* gave an annualized return of 4.58% with a maximum drawdown of -55% in 2009 (Figure-2).
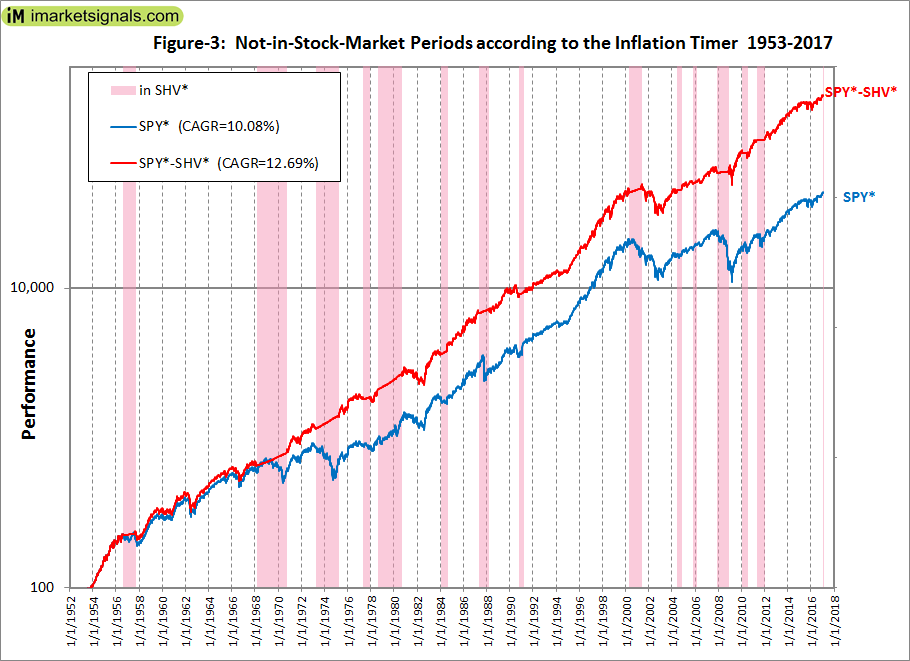
There were 15 periods from 1953 to 2017 when the inflation rate signaled to be in or out of the stock market. They are listed in the Appendix and are also shown by the vertical bars in Figure-3. Note that the Inflation Timer signaled to be out of the stock market during the 1987 market collapse.
Conclusion
Higher returns could have been achieved by using a longer term bond fund instead of a money-market fund. However, we wanted to show the most conservative performance from this model, which over the period 1953 to 2017 provided 4.44 times the total return of what a constant investment in the stock market would have produced.
The model is simple to construct, but can also be followed live at ImarketSignals.com. Heeding the monthly signals from the Inflation Timer should provide insurance against major stock market declines and improve investment performance.
Appendix
| buy stocks | 08/24/1953 |
| buy bonds | 08/20/1956 |
| buy stocks | 08/26/1957 |
| buy bonds | 02/26/1968 |
| buy stocks | 09/21/1970 |
| buy bonds | 04/23/1973 |
| buy stocks | 03/24/1975 |
| buy bonds | 04/25/1977 |
| buy stocks | 11/21/1977 |
| buy bonds | 08/21/1978 |
| buy stocks | 08/25/1980 |
| buy bonds | 01/23/1984 |
| buy stocks | 07/23/1984 |
| buy bonds | 04/20/1987 |
| buy stocks | 02/22/1988 |
| buy bonds | 10/22/1990 |
| buy stocks | 02/25/1991 |
| buy bonds | 04/24/2000 |
| buy stocks | 04/23/2001 |
| buy bonds | 06/21/2004 |
| buy stocks | 10/25/2004 |
| buy bonds | 10/24/2005 |
| buy stocks | 01/23/2006 |
| buy bonds | 11/26/2007 |
| buy stocks | 11/24/2008 |
| buy bonds | 01/25/2010 |
| buy stocks | 06/21/2010 |
| buy bonds | 04/25/2011 |
| buy stocks | 12/27/2011 |
| buy bonds | 01/23/2017 |


Hi Georg,
Tried hard to reconstruct from CPI source data at https://fred.stlouisfed.org/series/CPIAUCSL (which originates from dept. of labor statistics) but can’t even get close to the signal you’re showing above.
I’m using INF = (CPI(0) / CPI(-12)-1) * 100% and apply:
Sell: INF > 6-mo SMA (INF) + 0.75% and INF > 2
Buy: INF < 6-mo SMA (INF) – 0.20%
What could possibly be the source of the discrepancy?
I also tried https://fred.stlouisfed.org/series/CPILFESL but even worse.
The model we are updating weekly has an enhanced algorithm, it is not exactly the same from what we used for the long backtest in excel. Also we use weekly data, applicable to first trading day of the week.
Thx Georg. I am not aware of any Weekly CPI or inflation data source, not from the dept. of labor statistics and not from FRED. Monthly is the highest frequency available. Could you point me in the right direction? Also would like to hear more on your enhanced algo.
Correct. CPI is monthly, but SP500 is daily. We use the first trading day of the week after data becomes available from BLS.
Can this timer be used not to switch between stock/bonds but between SHY/IEF/TLT instead?
Tnx…
Thanks for the suggestion, much appreciated.
This timer does not work with fixed income ETFs. But a derivative of the SuperTimer works well with bonds. We will soon launch the iM-Bond Market Timer.