- This market timing model compares the performance of two different types of stock groups over time and provides signals when to invest or not to invest in the stock market.
- When the performance of the Hi-Beta stocks becomes lower than, or equal to Lo-Beta stocks the model exits the stock market and enters the bond market.
- It re-enters the market when the performance of the Hi-Beta stocks becomes higher than Lo-Beta stocks.
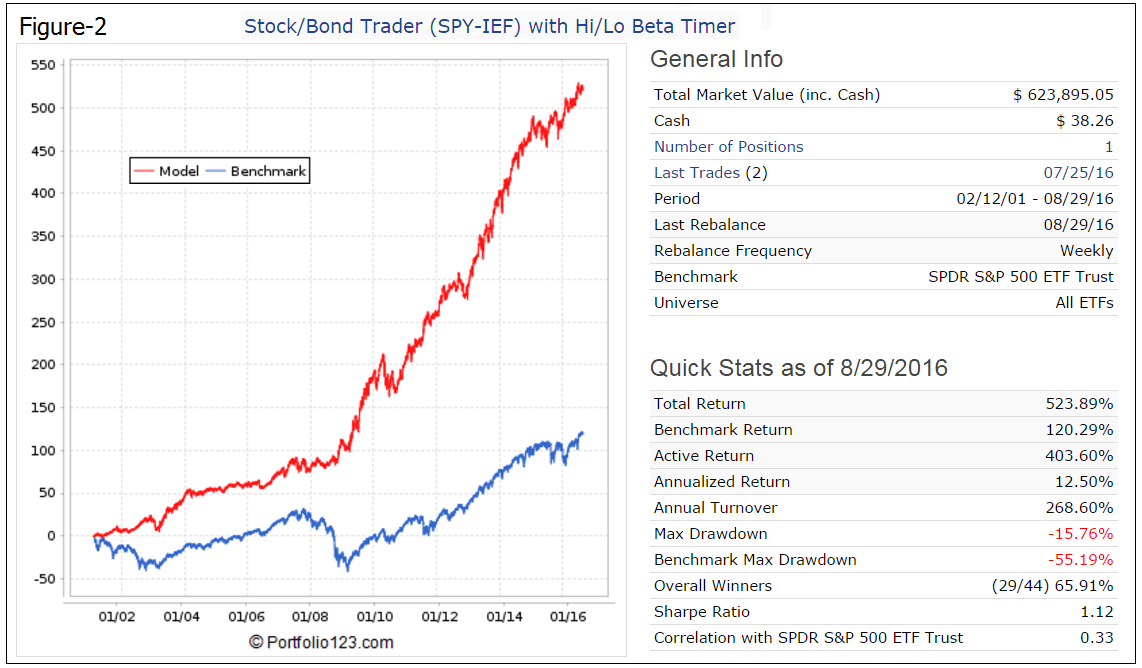
- From 2001 to 2016, switching between bonds and stocks provided significant benefits. This strategy would have produced an average annual return of 12.5% versus only 5.2% for buy&hold stocks.
For the period 2001-2016 the buy & hold strategy no longer worked! It is likely that it will also not work in the future due to increasing stock market volatility. For this reason some investor use simple market timing, mostly momentum driven, to exit and enter the markets according to market direction. Instead of relying on just one market timer, many uncorrelated market timing strategies can be designed from the comprehensive and diverse financial data that is readily available, and then combining them in a robust composite market timing model. We designed six such component timers using the following:
- Unemployment Rate (UNEMP),
- Performance of the Hi-Beta and Lo-Beta stocks of the S&P 500,
- TED Spread,
- Market Climate Score,
- iM Standard Timer,
- CBOE Volatility Index (VIX),
This article describes the second of these timers; short descriptions for the other five can be found here.
Market Timing by Performance of the Hi-Beta and Lo-Beta stocks
When Hi-Beta stocks perform better than Lo-Beta stocks the model signals investment in the stock market, otherwise investment in bonds.
This indicator was brought to our attention by Andreas Himmelreich who noticed that it correlated well with his 5-stock portfolios, e.g. when high beta stocks were doing well, his portfolios went up in value, and otherwise it under-performed. Subsequently Steve Auger of Stock Market Student provided an algorithm to model this on Portfolio 123, an on-line portfolio simulation platform, which also provides extended price data for ETFs prior to their inception dates calculated from their proxies.
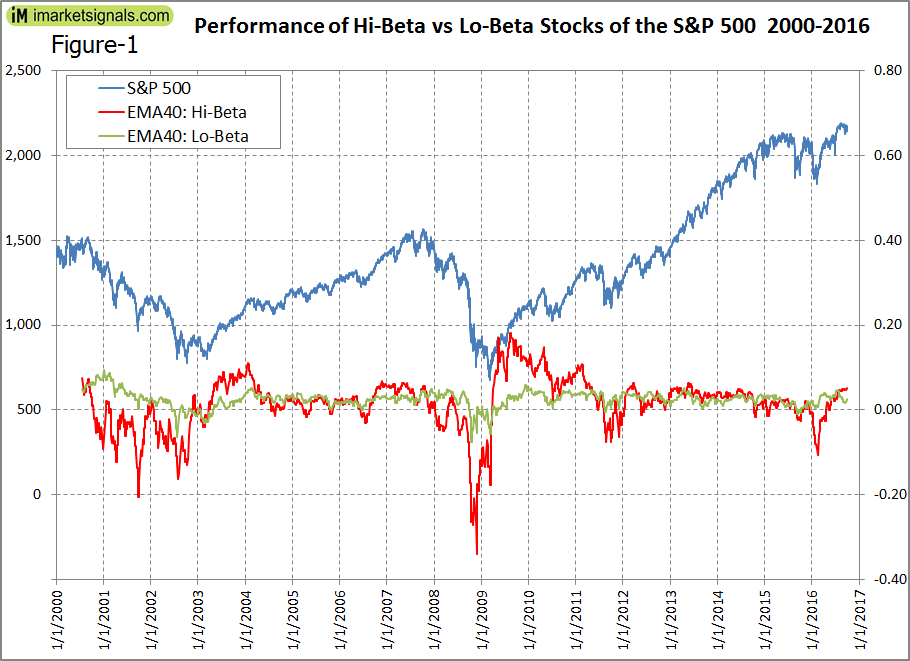
Hi-Beta and Lo-Beta are defined as the Market-Cap-weighted average of the performance over a specific period of the S&P 500 stocks that meet the criteria “Beta > 1.5” or “Beta < 0.75”, respectively.
Hi-Beta and Lo-Beta are smoothed with a 40-week Exponential Moving Average (EMA), and the signal to enter the stock market is given when the 40-week EMA of Hi-Beta > 40-week EMA of Lo-Beta.
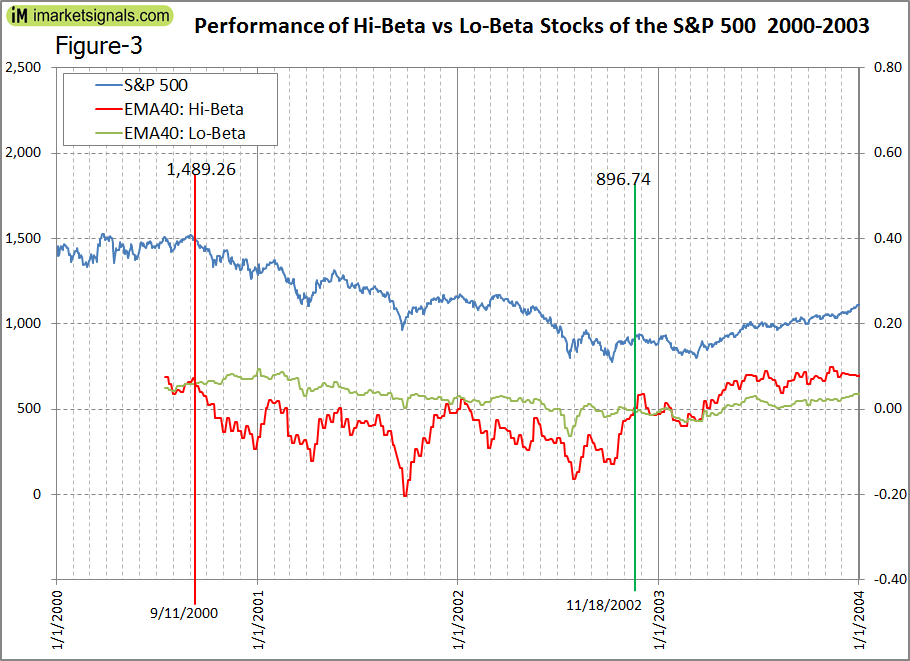
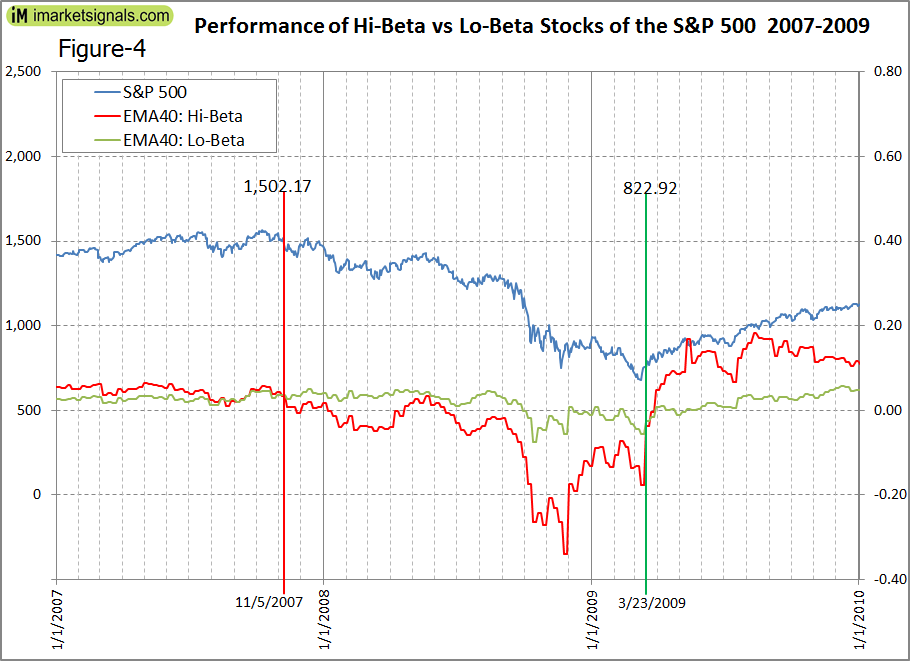
It is evident that this is an effective market timer when comparing the two EMA graphs and their position relative to the S&P 500 performance graph in the Figure-1 below. It clearly signaled the exit from the stock market before the two major downturns, in 2000 and 2007, and also the re-entry early in 2003 and 2009. The model would have avoided losses of 40% and 45%, respectively, for the two major down-markets. Figure-3 and Figure-4 in the Appendix show details of this.
For the period 2001 to 2016, a backtest verified the performance of this timer. The P123 backtest elected either the (NYSEARCA:SPY), the ETF tracking the S&P 500, or (NYSEARCA:IEF) as the bond fund. The P123 backtest performance is shown in Figure-2, giving an average annual return of 12.5% with a maximum drawdown of -16%. In the figure the red graph represents the performance of the model.
Conclusion
From the analysis it appears that the performance of Hi-Beta stocks relative to the performance of Lo-Beta stocks of the S&P 500 can profitably be used as a market timer. From 2001 to 2016 the buy & hold strategy no longer worked, and it is unlikely to work in the future as well, due to stock market volatility increasing.
Although this model performed well over the past 16 years, there is no guarantee that it will perform well in the future too. Also, rising interest rates with concurrent diminishing returns from bonds may reduce the effectiveness of bond/stock timing models.
Appendix
This model uses 5-year Beta.
Beta is a measure of the volatility, or systematic risk, of a security or a portfolio in comparison to the market as a whole. A beta of 1 indicates that the security’s price will move with the market. A beta of less than 1 means that the security will be less volatile than the market. A beta of greater than 1 indicates that the security’s price will be more volatile than the market. For example, if a stock’s beta is 1.2, it’s theoretically 20% more volatile than the market.


Hi Georg,
I am pretty interested in this beta timing signal and have replicated your research on my own which turned out useful. However, I just wonder if you have any thoughts about why the relative beta performance could predict the market? What is the difference between this beta signal and the 40-week Exponential Moving Average of SP500 return? It seems like the simple momentum signal had similar predictive power.
Typically when high beta stocks perform better than low beta stocks the market performs better, and vice versa.
A moving average crossover system is momentum driven, which is different to the beta timer.
The performance correlation between the two is about 0.55, so they are not directly related to each other.
Thank you so much for your reply. I am still a bit confused with the beta timer. What do you think could cause the beta timer to be capable of predicting market return, in addition to momentum driven?
Thanks a lot!
The beta timer does not predict market returns. The backtest shows that it provides signals to exit the market before major down-stock-markets, and it appears to be very good signalling an early entry back into stocks.
Is this timer tracked on the site?
Also, would the results using QQQ instead of SPY be more favorable given the nature of this model?
Tom C
This model is one of the six component timers in the Composite (SPY-IEF) Timer, it is not reported separately but one can see whether it is in or out of SPY in the weekly detail listing of the Composite (SPY-IEF) Timer.
We are not interested to produce the maximum return for this model, we merely want to know whether it is in equities or not.
Thanks. Sure, I get it. I was just wondering if there was perhaps any edge involved in using this timer as a “switching” type mechanism. So any time you were using some model which had you in SPY, and this model signaled Hi Beta, you might switch to QQQ (or a higher beta ETF), and vice versa when it switched to Lo Beta.
Tom C
in a similar vein, the Low Frequency timer might be another way to provide a similar switching mechanism from lower risk to higher risk.
Tom C