- The BestogaX universe of the Russell1000 consists of the so called “Vice” stocks (excluding Gaming stocks), plus the stocks from the GICS-sub-industries: Restaurants, Soft Drinks, and Internet Retail.
- A discussion on the merits of investing in the stocks of the BestogaX universe is available here.
- The iM-BestogaX5-Trader model periodically selects only five of the highest ranked stocks from the Russell1000 BestogaX universe, and holds them for at least three months.
- There is no market timing in the buy- and sell rules. The model is rebalanced weekly, resulting in small weight adjustments, and dividends are re-invested when available.
- Backtesting was done on the web-based trading simulation platform Portfolio 123.
Historic performance of the iM-BestogaX-5 Trader – not hedged
In the Figure-1 below, the red graph represents the performance of the model and the blue graph shows the performance of the benchmark SPY.
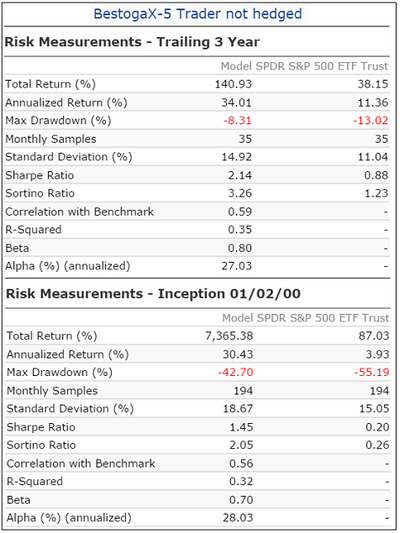
- This model without hedging shows a simulated annualized return of 30.4% from January 2000 to March 2016, and maximum drawdowns would have been -43% during 2008.
- Over the 16-year backtest period there were 166 trades, 123 of them winners. The average annual turnover was only 204%, with an average holding period of 177 days.
Return and risk figures for this un-hedged model are shown in the table below.

Historic performance of the iM-BestogaX-5 Trader – always hedged
This version of the model is always hedged short SSO, with a hedge ratio of 30% of current long holdings. In the Figure-2 below, the red graph represents the performance of the model and the blue graph shows the performance of the benchmark SPY. Return is not as high as for the un-hedged version, but maximum drawdown is better.
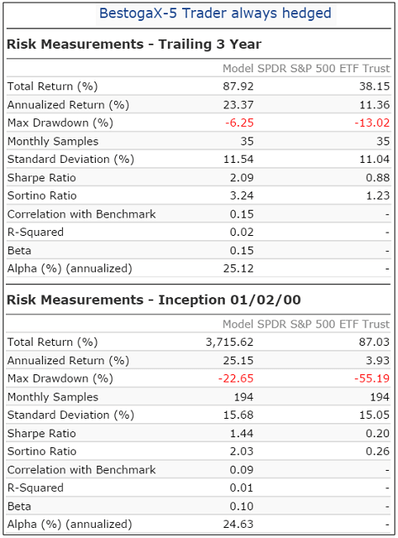
- This model with permanent hedging shows a simulated annualized return of 25.2% from January 2000 to March 2016, and maximum drawdown would have been -23% in 2008.
- Over the 16-year backtest period there were only 211 trades, 136 of them winners. The average annual turnover was 223%
Return and risk figures for this permanently hedged model are shown in the table below.

Historic performance of the iM-BestogaX-5 Trader – partially hedged
This version of the model is during adverse market conditions hedged short SSO, with a hedge ratio of 60% of current long holdings. The hedge entry rule come from our Standard Market Timer, and additionally for the hedge entry the 50-day moving average of the S&P500 index must be less than the 500-day moving average. The hedge exit rule also comes from our Standard Market Timer, or alternatively the 50-day moving average of the S&P500 index must be greater than the 500-day moving average.
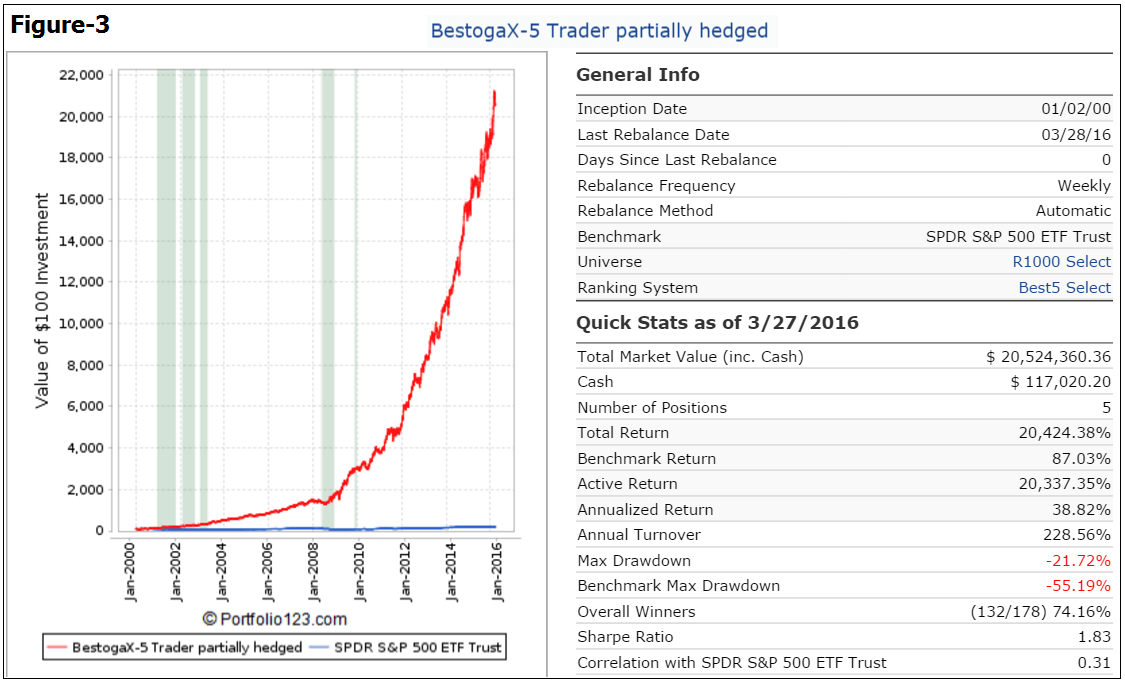
In the Figure-3 below, the red graph represents the performance of the model and the blue graph shows the performance of the benchmark SPY. The shaded portions represent periods when the model is hedged.
Return is considerably higher than for any of the other versions, and maximum drawdown is similar to that of the permanently hedged model.
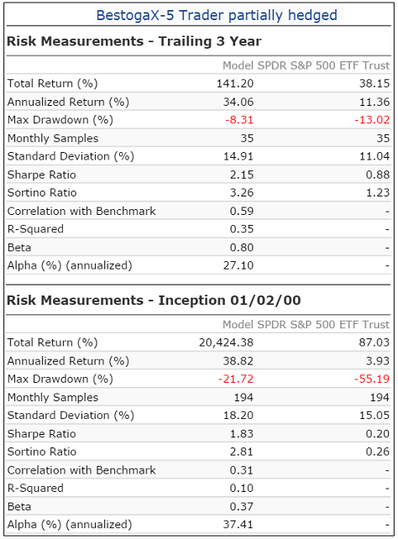
- This model with partial hedging shows a simulated annualized return of 38.8% from January 2000 to March 2016, and maximum drawdown would have been about -22% in 2000 and 2009.
- Over the 16-year backtest period there were 178 trades, 132 of them winners. The average annual turnover was only 229%.
Return and risk figures for this partially hedged model are shown in the table below.

Disclaimer
All results are presented for informational and educational purposes only and shall not be construed as advice to invest in any assets. Backtesting results should be interpreted in light of differences between simulated performance and actual trading, and an understanding that past performance is no guarantee of future results. All Traders should make investment choices based upon their own analysis of the asset, its expected returns and risks, or consult a financial adviser. The designer of this model is not a registered investment adviser.


It looks like if we want to follow the Trader model alone we can get the weekly security updates from the Trader portion of the BestogaX-5 system.
However, the Trader model uses a different hedging profile than the BestogaX-5 system. From looking at the grey shaded areas on the graphs between Trader and BestogaX-5, it appears the Trader is hedged less often over the test period. In addition, the Trader hedge is either 0% or 60% short SSO, which is different than the BestogaX-5 system at 20%-50% short SSO.
I realize the Trader model is not a Best-system but is there a way to follow the Trader hedge?
Thanks!
Hi Georg,
To minimize the trades is it possible to make system of 2:
60% of BestogaX-5_Tradder and
40% for hedging SSO/SDS,
I want to buy SDS (not to short SOO).
And I am not going so sell stocks to buy SDS and will only switch SSO/SDS.
This is only idea, I am sure you have better suggestions.
Thanks for good systems.
Gogo
We don’t have a SSO/SDS model, but you could use the iM-(SH-RSP) model instead for the combo.
60% BestogaX-5 Trader not hedged
40% iM-(SH-RSP) with Standard & Composite Timer rules
Simulated Annualized Return (2000-2016) 29.27%
Max Drawdown -18.44%
Sharpe Ratio 1.83
This is very good
Thank you Georg
Georg, Would you test hedging BestogaX 5 trader short 35% SSO when both component models of Combo2-(RSP-IEF) & (SH-RSP) point to IEF and SH.
Thanks for your work