
- Currently the yield of 30-year US Treasury Bonds is at its lowest level ever.
- The bond-market rally which began at the beginning of 2014 is near its end.
- Some upside for long Treasury bonds is still possible, but not much.
The way to determine bond market direction is to interpret the change of the yield curve over time. Our “Bond Value Ratio” (BVR), is based only on the daily yields-to-maturity of the 30-year Treasury bond and the 10-year note. Bond prices derive from those yields, and the relationship between those bond prices is captured by the BVR, which is an indicator of up or down bond-markets. BVR increases if the price change of the 30-year bond exceeds the price change of the 10-year note, and vice versa. When BVR is plotted as a graph against time, an upward slope indicates an up bond-market and conversely, a downward slope indicates a down bond-market.
Reference is made to the first three Bob Farrell rules:
- Markets tend to return to the mean over time.
- Excesses in one direction will lead to an opposite excess in the other direction.
- There are no new eras — excesses are never permanent.
Figure-1 plots BVR from 1986 to 2015 and its “best-fit” line determined from a regression analysis. The trend line represents the mean market direction referred to in Farrell’s rule one. The upper and lower offset limit lines from the best-fit curve establish a reference for the directional excesses referred to in Farrell’s rule two. When the BVR turns upwards from below a lower offset limit line an investment in a fund with high beta is indicated. When the BVR turns downwards from above an upper offset line it is prudent to remove one’s money from the high-beta fund and place it into a fund with low beta. This strategy invokes Farrell’s rule three, which is about excesses never being permanent.
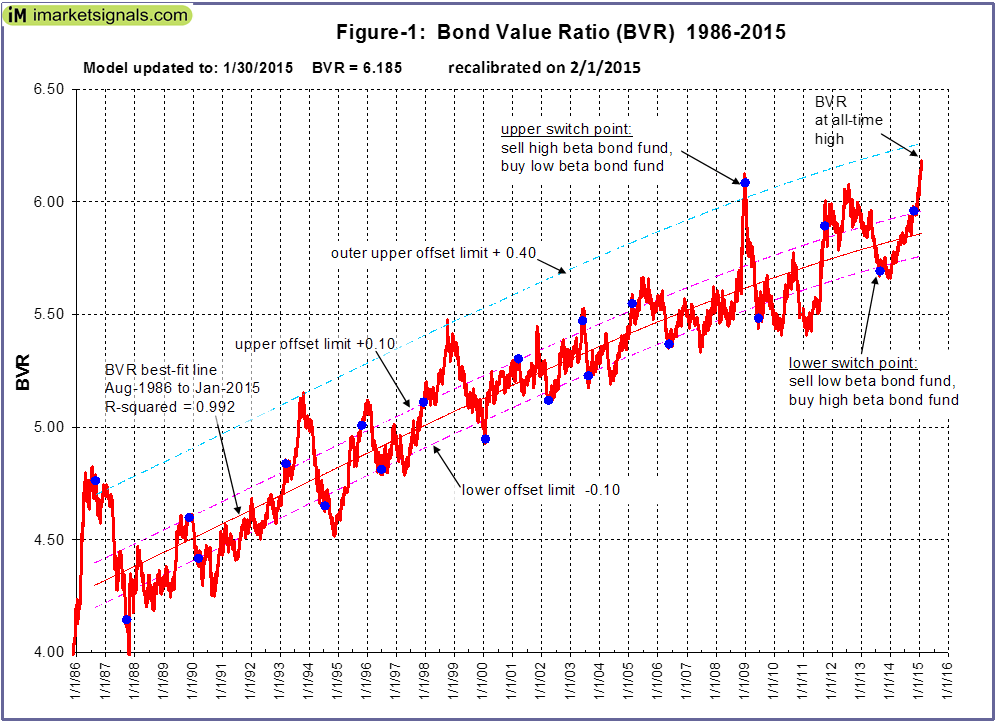
Also shown in Figure-1 is an outer upper limit line, offset by 0.40 from the trend line. This line approximately connects the previous four highest peaks of the BVR. One can see that the current level of BVR is near this line, but still below it. Some upside for long Treasury bonds is possible, but probably not much. There are no new eras — excesses are never permanent. The BVR will decline again and interest rates will rise from the current lows.
The BVR is updated weekly on our website.
Appendix: Beta vs. Standard Index
(from Morningstar Report: Mutual Fund Data Definitions)
Beta, a component of Modern Portfolio Theory statistics, is a measure of a fund’s sensitivity to market movements. It measures the relationship between a fund’s excess return over T-bills and the excess return of the benchmark index. Bond funds are compared with the Lehman Brothers Aggregate Bond index. By definition, the beta of the benchmark (in this case, an index) is 1.00. Accordingly, a fund with a 1.10 beta has performed 10% better than its benchmark index–after deducting the T-bill rate–than the index in up markets and 10% worse in down markets, assuming all other factors remain constant. Conversely, a beta of 0.85 indicates that the fund has performed 15% worse than the index in up markets and 15% better in down markets. A low beta does not imply that the fund has a low level of volatility, though; rather, a low beta means only that the funds market-related risk is low.
I like your analysis but I wonder if this can exist in a vacuum. For example long rates in Germany are much lower than our rates-is it possible to incorporate this relative difference since bond buyers can jump from one market to another?
Farrell’s rules are good ones to remember. Thanks for the article.
Jim OConnor
Let’s watch the performance of TLT, the iShares 20+ Year Treasury Bond ETF tracking the investment results of an index composed of U.S. Treasury bonds with remaining maturities greater than twenty years.
On Feb-5 when this article was posted the adjusted closing price of TLT was $133.32 according to YahooFinance and BVR= 6.144.
Good article… Thanks for update.
TLT closed yesterday (March 5) at $123.50. Down 7.5% from when you posted your article on Feb 5!
Correction on March 6 not March 5
Goerg,
Could you clarify for me whether IEF constitutes a “long bond”. As far as duration it is classified as intermediate. The beta is rated at 2.3. There are some references on your site that would indicate TLT is on one end of the spectrum while IEF and SHY are at the other. I don’t think this is what you mean to imply, though, and that currently the BVR model would avoid IEF. Is this correct?
Thanks
According to iShares:
IEF has exposure to intermediate-term U.S.
TLT has exposure to long-term U.S. Treasury bonds.
SHY has exposure to short-term U.S. Treasury bonds.
Currently the BVR model avoids long- and intermediate-term bonds.
Where on your site can I find the exact switch dates using the two tested offset limits to go into either a high beta bond fund or a low beta bond fund?
I’m enjoying your site.
Thank you,
Paul
The historic BVR switch dates are not published at iM. The weekly updates reports when a signal occurs. The model description does provide some of the recent dates and approximate dates can also be extracted from the chart.
http://www.advisorperspectives.com/articles/2010/11/23/seeking-beta-in-the-bond-market-a-math-driven-investment-strategy-for-higher-returns