
Market Signals Summary:
The MAC-US model generated a buy signal this week, thus it and the IBH stock market model are invested in the markets. However, this buy signal should be evaluated together with our other indicators. The MAC-AU remains out of the markets. The recession indicator COMP, as well as iM-BCIg, are down from last week. The bond market model avoids high beta (long) bonds, the trend of the yield spread is indeterminate. Both the gold and silver model are invested.
Stock-markets:
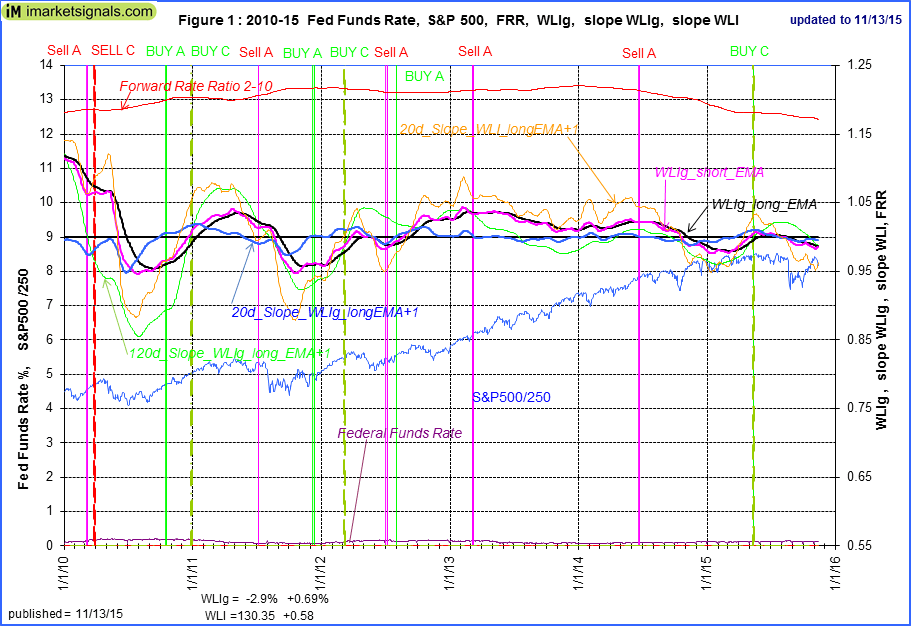 The IBH-model is invested in the markets. The IBH model relies mainly on the long and short EMAs of the U.S. Weekly Leading Index’s growth rate. The IBH-model is described here and the latest rules can be found here .
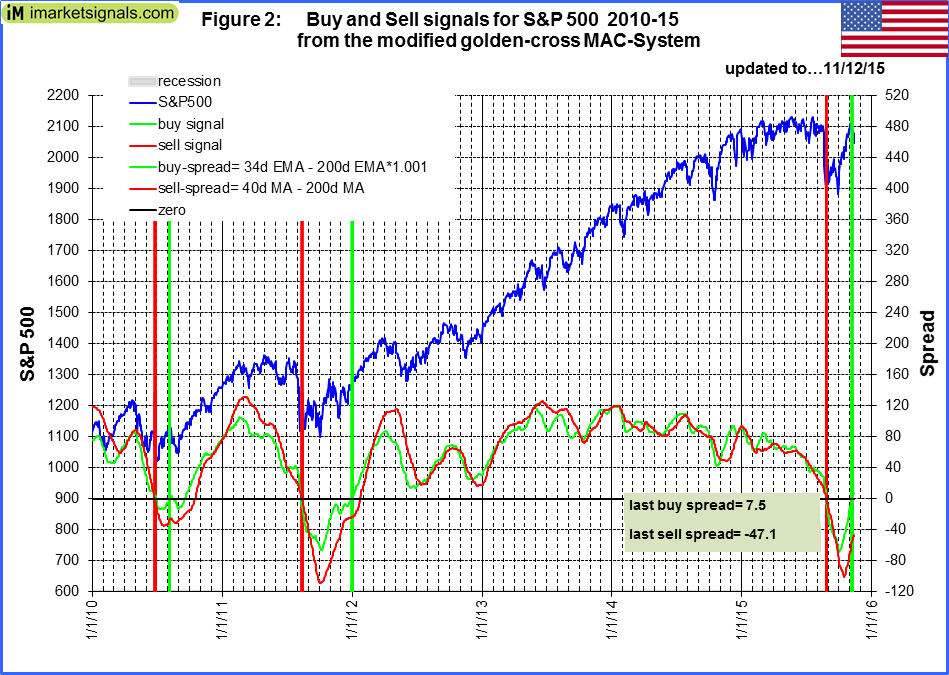 The MAC-US model generated a buy-signal this week when the buy-spread became positive. In evaluating this signal one should be aware that the sell-spread is still negative. The possibility exist that if there is a significant market downturn the sell-spread will remain negative and will thus not generate a sell signal. Our Best(SPY-IEF) Market-Timer still indicates a 50% allocation to stocks, our Climate-Grader remains in Zone-3 (NNP) and our 3-mo Hi-Lo Index remains out of market. Under these circumstances we will wait until the sell-spread becomes positive as well before changing from down-market to up-market condition for our Vanguard/TIAA-CREF systems.
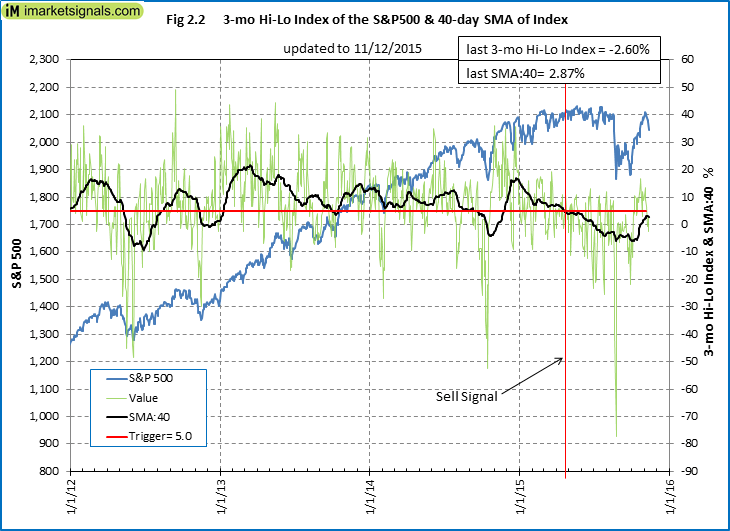 The 3-mo Hi-Lo Index of the S&P500 signaled an exit from the stock market at the end of April 2015. For a buy signal to emerge the 40-day moving average (MA40) of the index must move from below to above 5.0%. The upward trend of MA40 has been reversed this week.
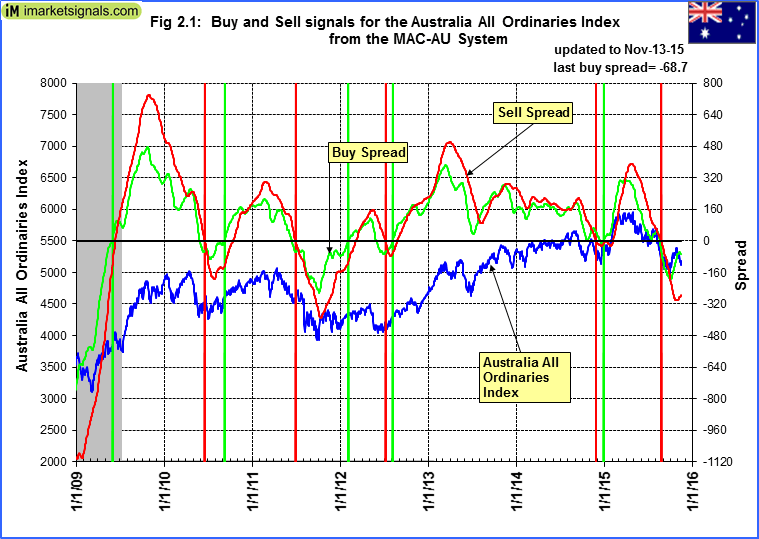 The MAC-AU model generated a sell signal end of August and thus in cash. The buy-spread is higher than last week’s level. The next buy signal will emerge once the buy spread (green graph) moves above the zero line.
This model and its application is described in MAC-Australia: A Moving Average Crossover System for Superannuation Asset Allocations.[/iM]
Recession:
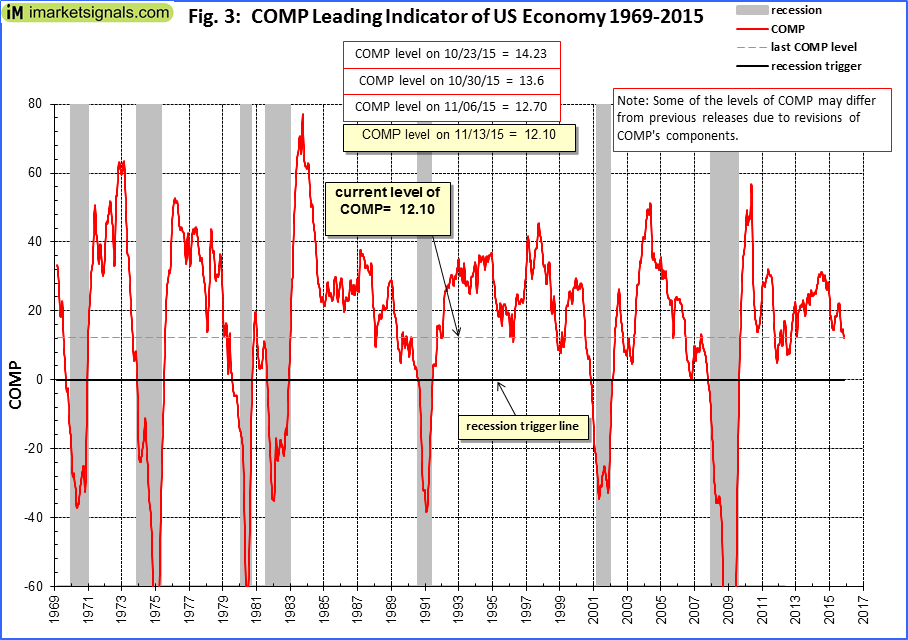 Figure 3 shows the COMP is down from than last week’s level, and far away from signaling recession. COMP can be used for stock market exit timing as discussed in this article The Use of Recession Indicators in Stock Market Timing.
 Figure 3.1 shows the recession indicator iM-BCIg is also down from last week’s level. An imminent recession is not signaled .
Please also refer to the BCI page
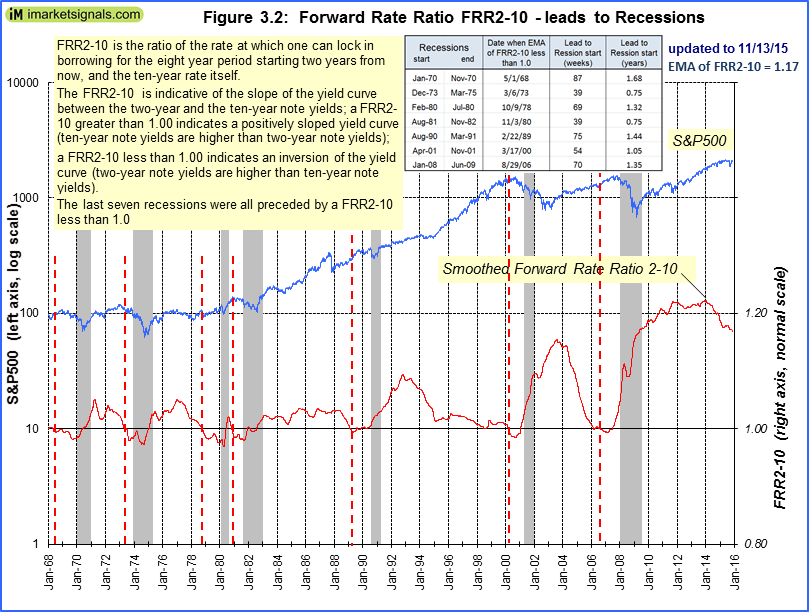 The Forward Rate Ratio between the 2-year and 10-year U.S. Treasury yields (FRR2-10) is near last week’s level and far away from signalling a recession.
A description of this indicator can be found here.
Leave a Reply
You must be logged in to post a comment.