
- This model can hold 10 stocks selected by a ranking system from a minimum volatility stock universe of the S&P 1500.
- When adverse stock market conditions exist, the model reduces stock holdings by 50% and invests the proceeds in the -2x leveraged ProShares UltraShort S&P500 ETF (SDS).
- The backtest produced a simulated average annual return of about 42% from Jan-2000 to end of June-2015 with a maximum draw-down of minus 24%.
The Minimum Volatility Stock Universe of the S&P 1500
Minimum volatility stocks should exhibit lower drawdowns than the broader market and show reasonable returns over an extended period of time. It was found that a universe of stocks mainly from the Health Care, Consumer Staples and Utilities sectors satisfied those conditions.
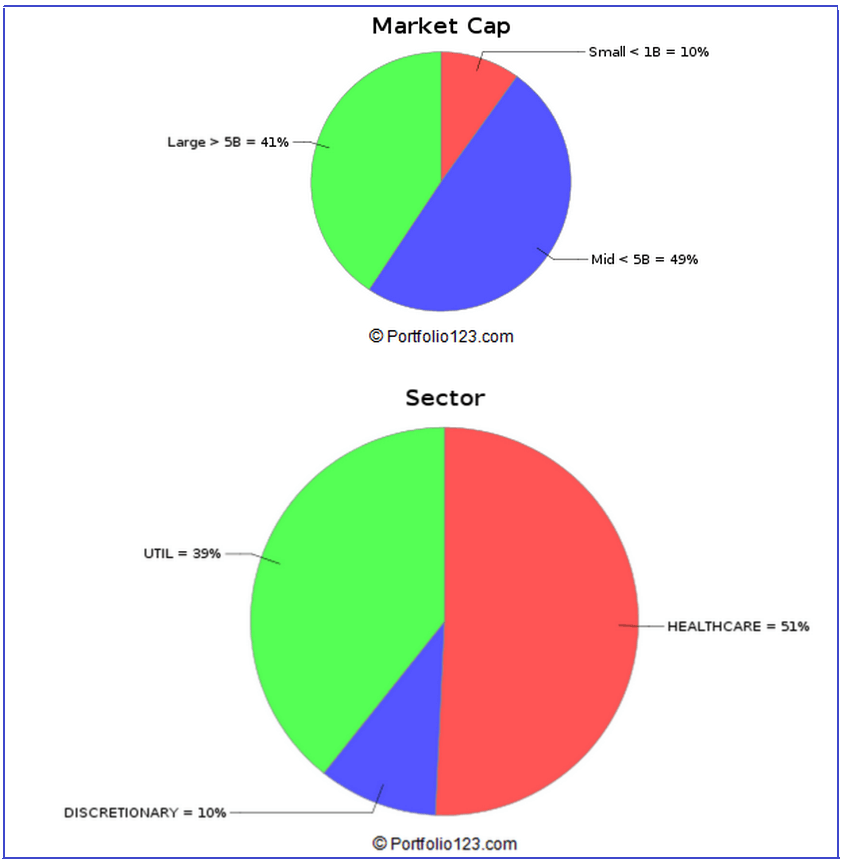
This minimum volatility universe of the S&P 1500 currently holds 263 stocks (market cap ranging from $0.3- to $277-billion).
Trading Rules
The ranking system employed is the same as the Best10(S&P 1500) system, but the trading system differs in regard to the hedge used and some additional sell rules, and an additional buy rule to the effect that some of the largest market cap stocks are exclude from being selected.
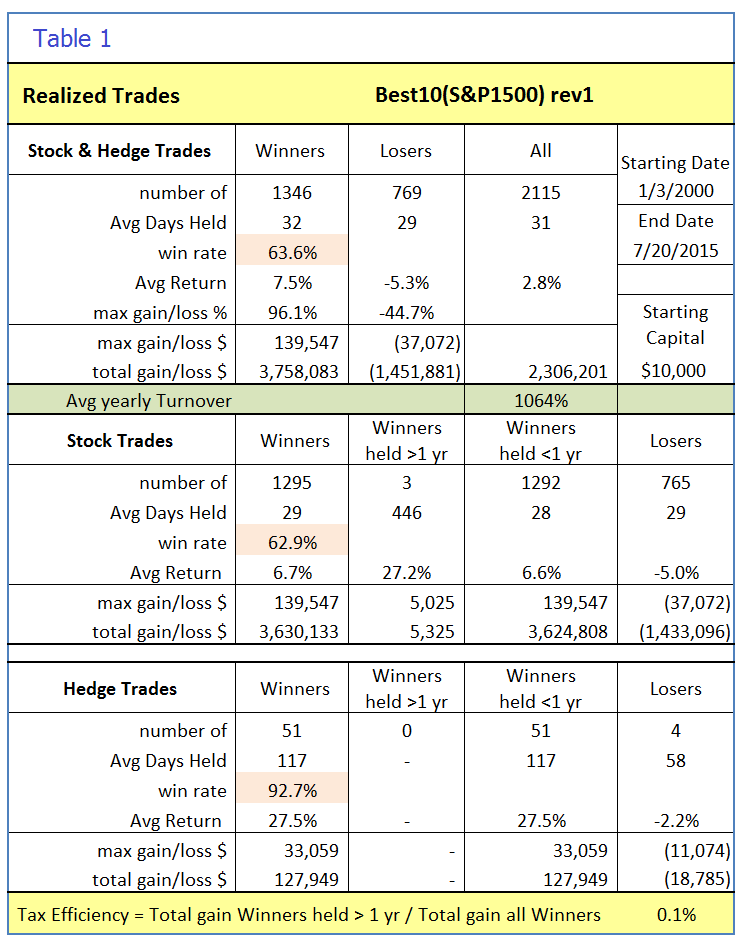
Realized Trades Analysis
An analysis of all the realized trades is shown in Table 1. There were 1346 winning trades out of 2115, resulting in a win rate of 63.6%. The average yearly turnover was about 1500%. On average, a position was held for 31 days.
Holdings
Performance
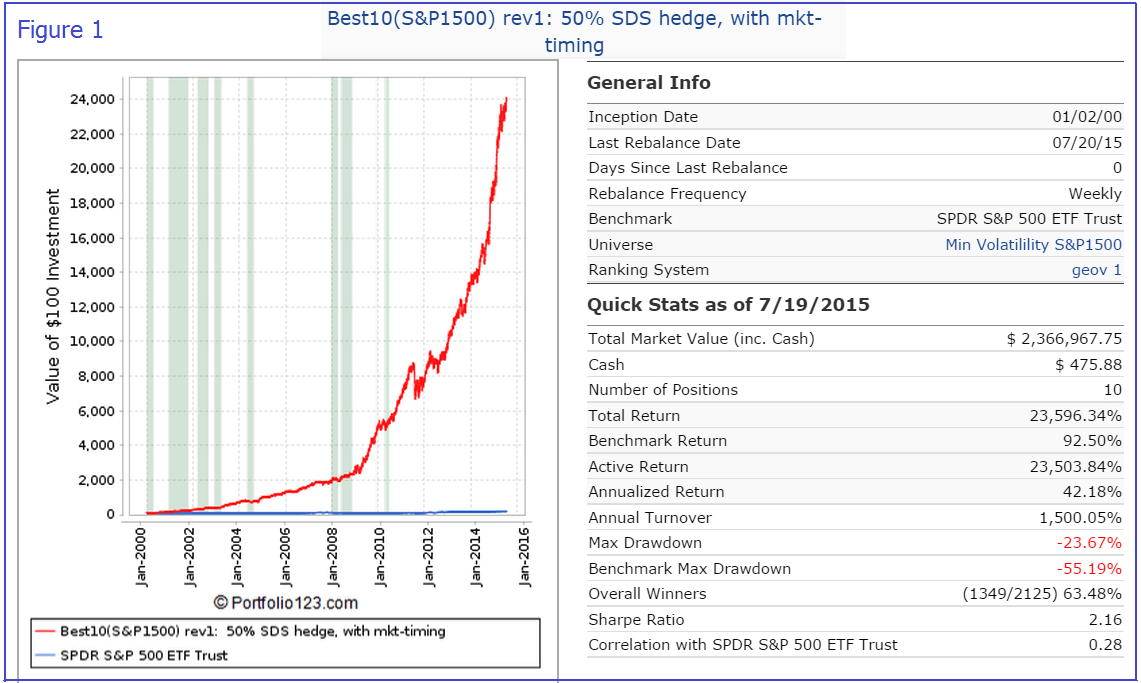
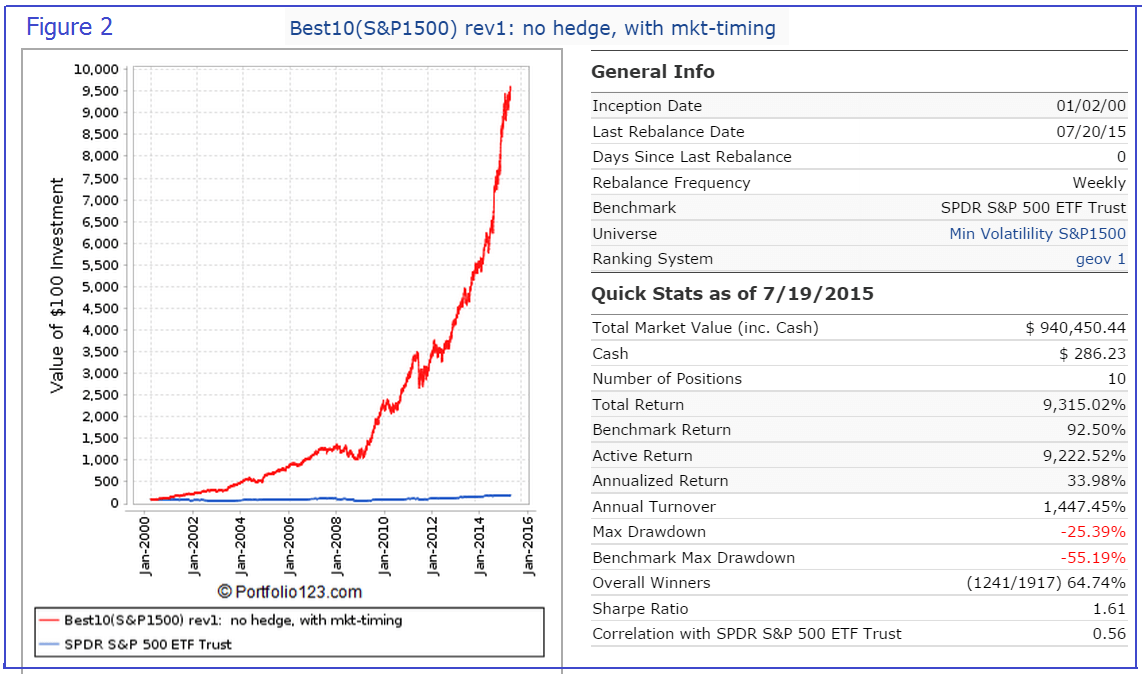
In the figures below, the red graph represents the model and the blue graph shows the performance of benchmark SPY. The backtest period was 15.5 years, from January 2000 to June 2015.
Figures 1 to 5 show performance comparisons:
- Figure 1: Performance 2000-2015 with market-timing and hedging with long SDS. The model uses a hedge ratio of 50% of current holdings during down-market conditions. (Note: The inception date of SDS was Jul-2006. Prior to this date values are “synthetic”, derived from the S&P 500.) Annualized Return= 42.2%, Max Drawdown= -23.7%.
- Figure 2: Performance 2000-2015 without hedging. Annualized Return= 34.0%, Max Drawdown= -25.4%.
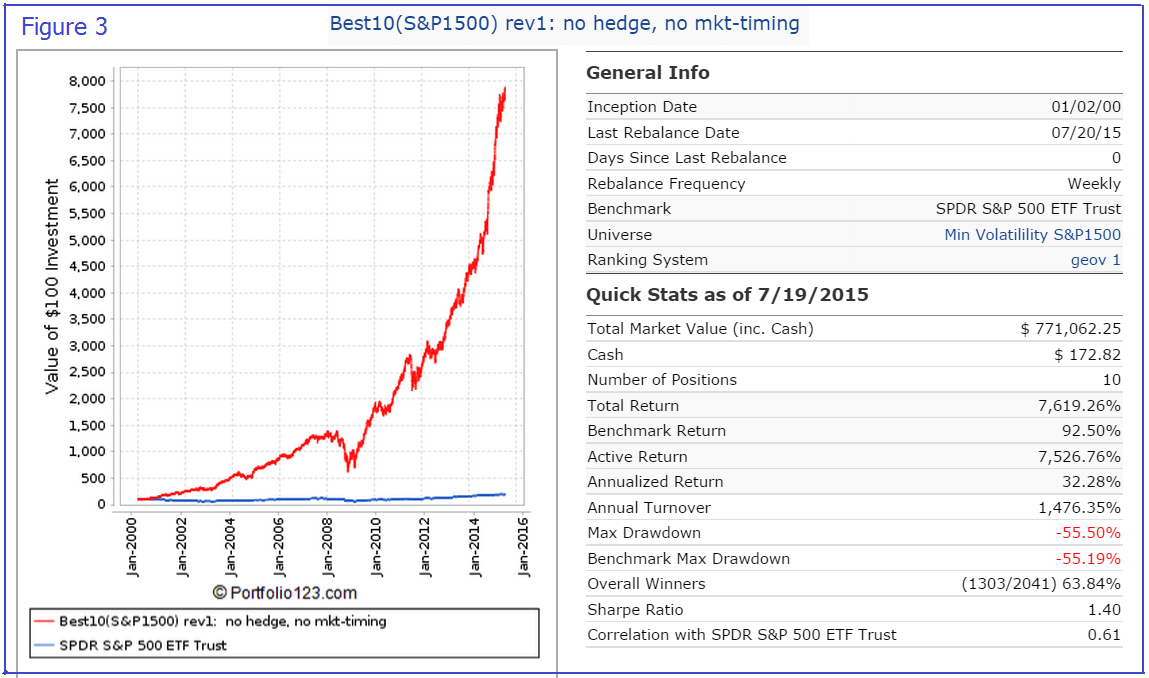
- Figure 3: Performance 2000-2015 without hedging and market timing. Annualized Return= 32.3%, Max Drawdown= -55.5%.
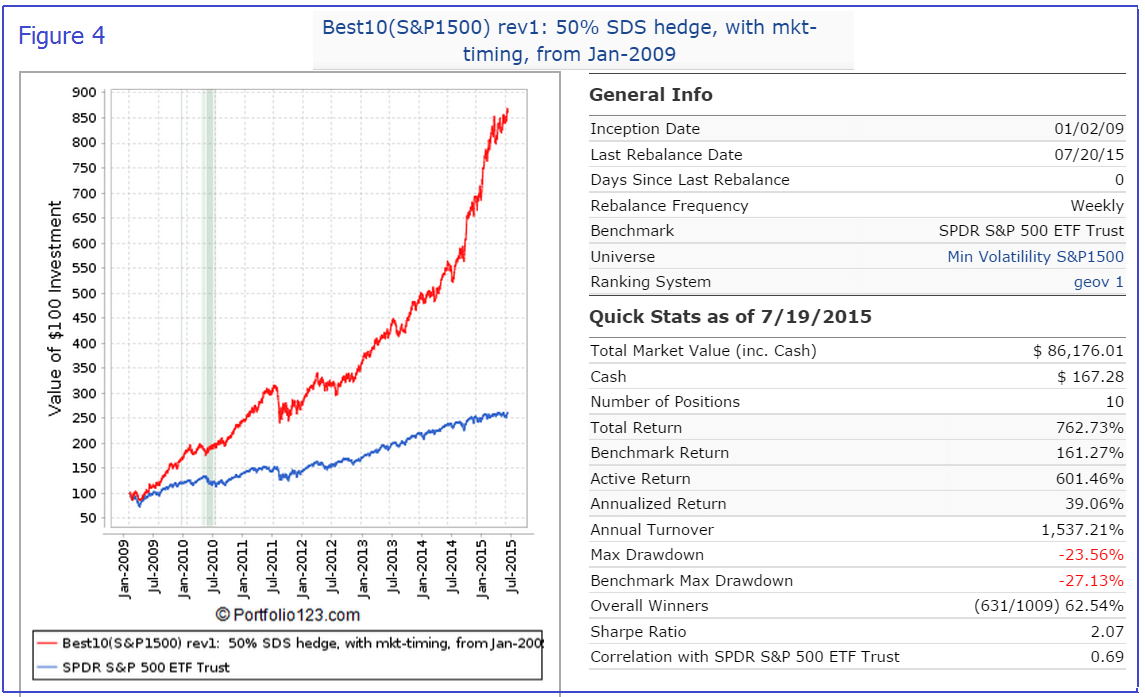
- Figure 4: Performance Jan-2000 to Jun-2015 . Annualized Return= 39.1%, Max Drawdown= -23.6%.
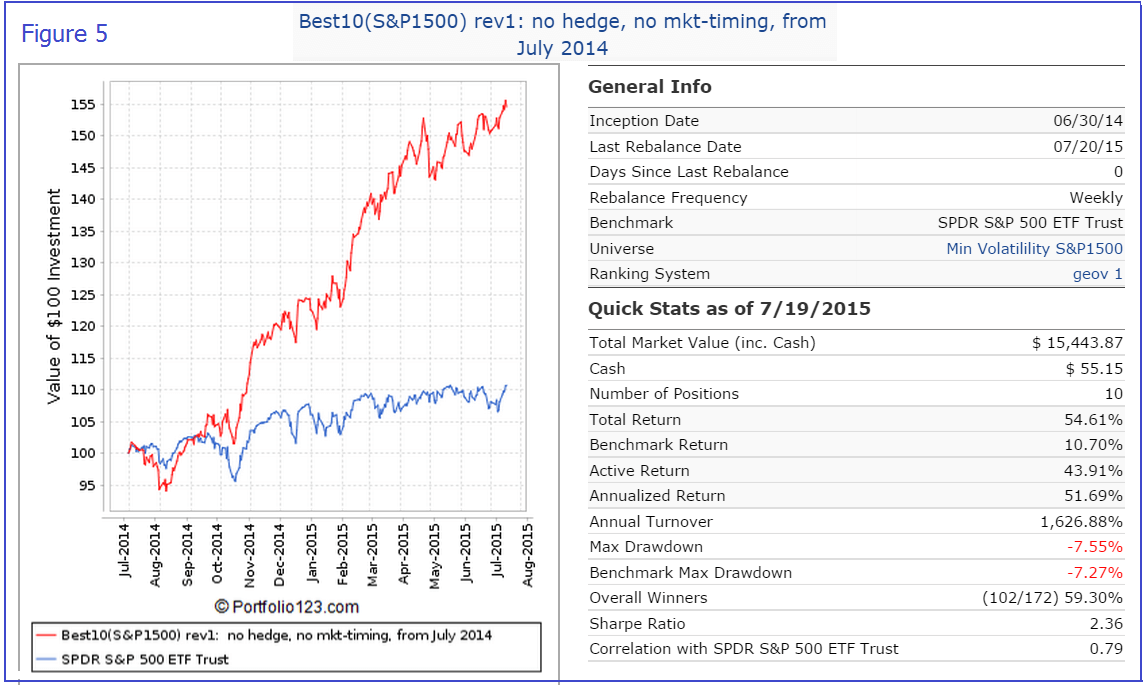
- Figure 5: Performance Jul-2014 to Jun-2015. Total Return= 54.6%, Max Drawdown= -7.6%.
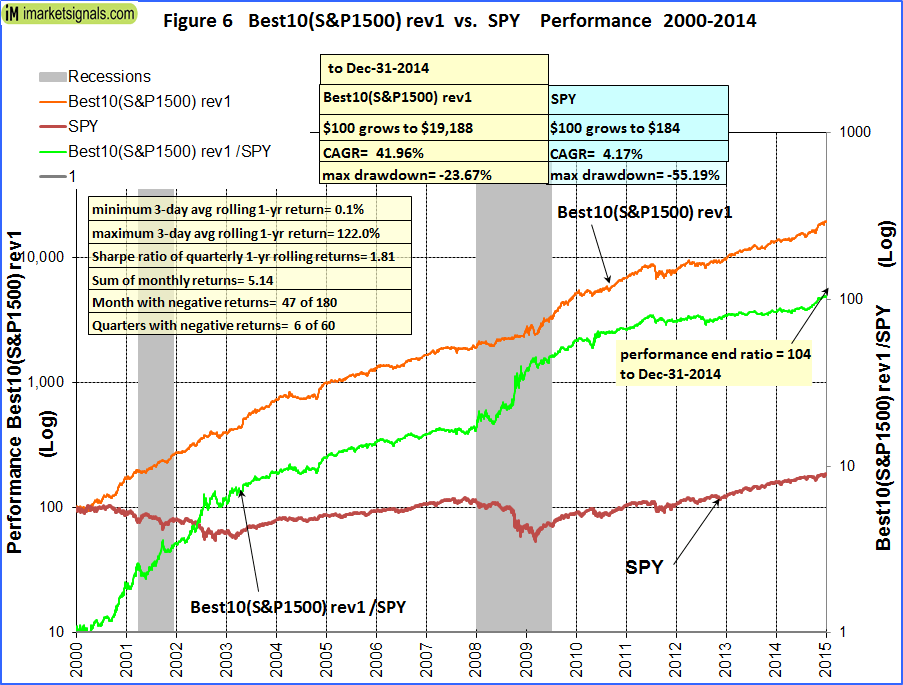
- Figure 6: Performance versus SPY. Over the 15-year period $100 invested at inception would have grown to $19,188, which is 104-times what the same investment in SPY would have produced.
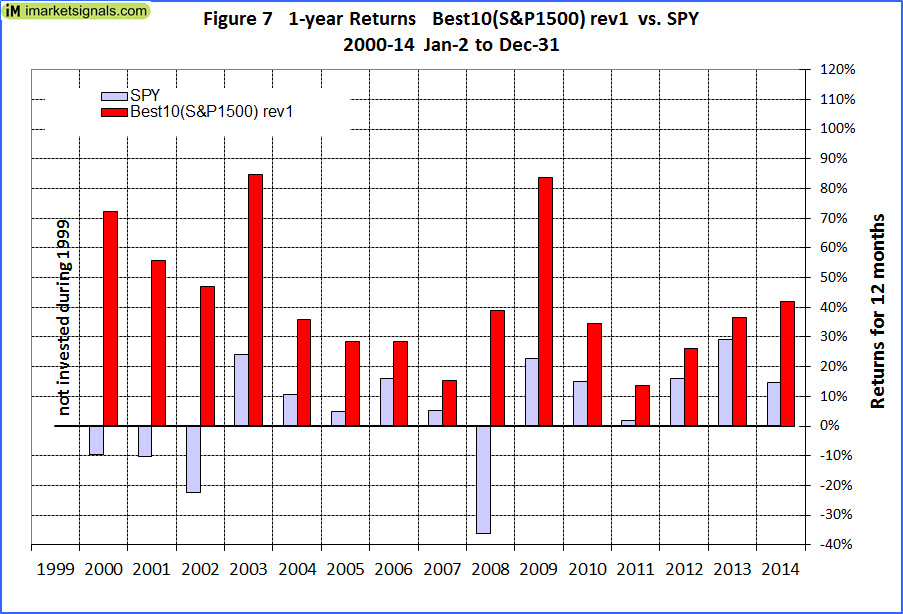
- Figure 7: 1-year returns. The 1-year returns were always higher than for SPY. There were no negative annual returns.
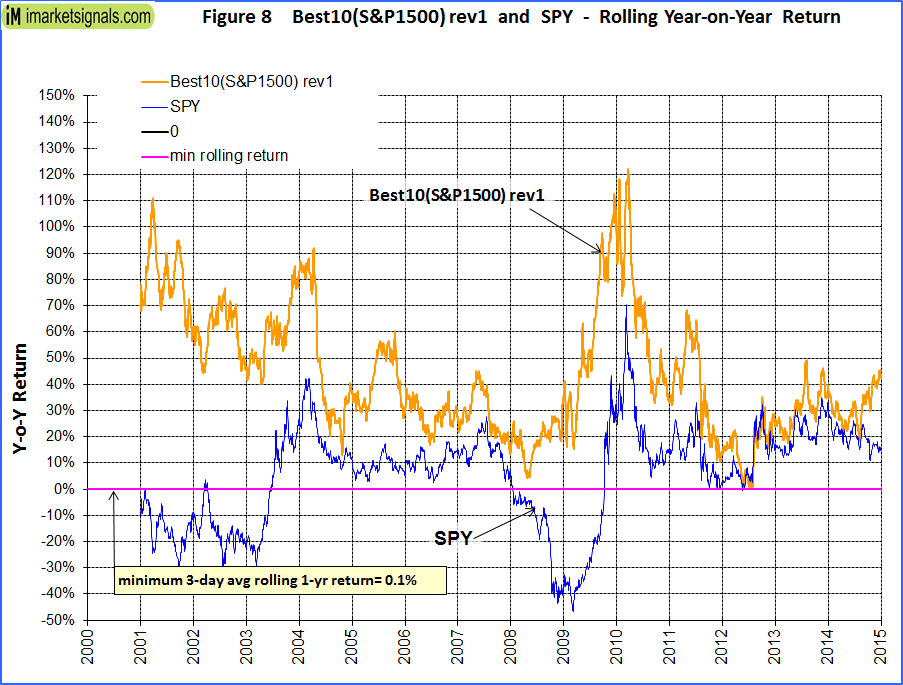
- Figure 8: 1-year rolling returns. The minimum 1-year rolling return of the 3-day moving average was 0.1% in 2012.
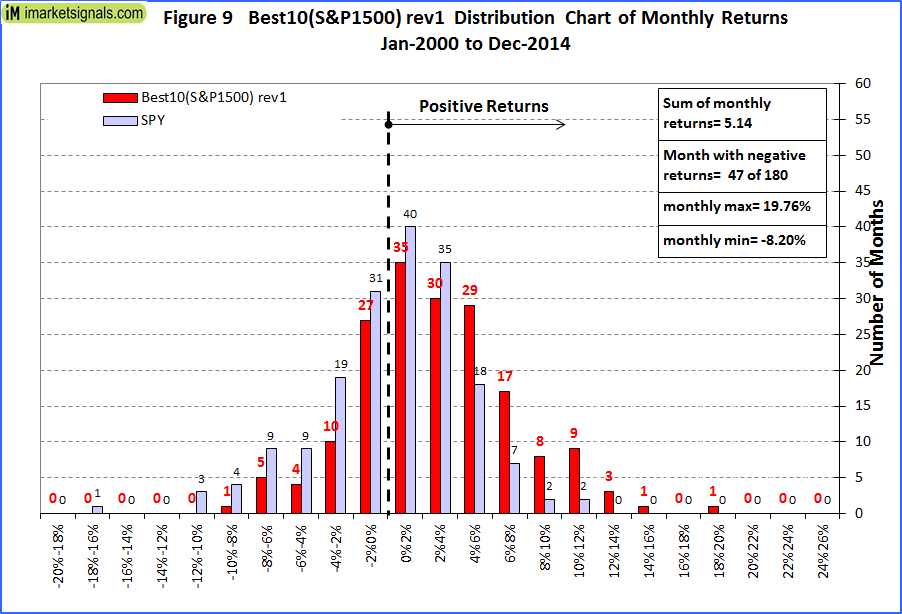
- Figure 9: Distribution of monthly returns relative to SPY.
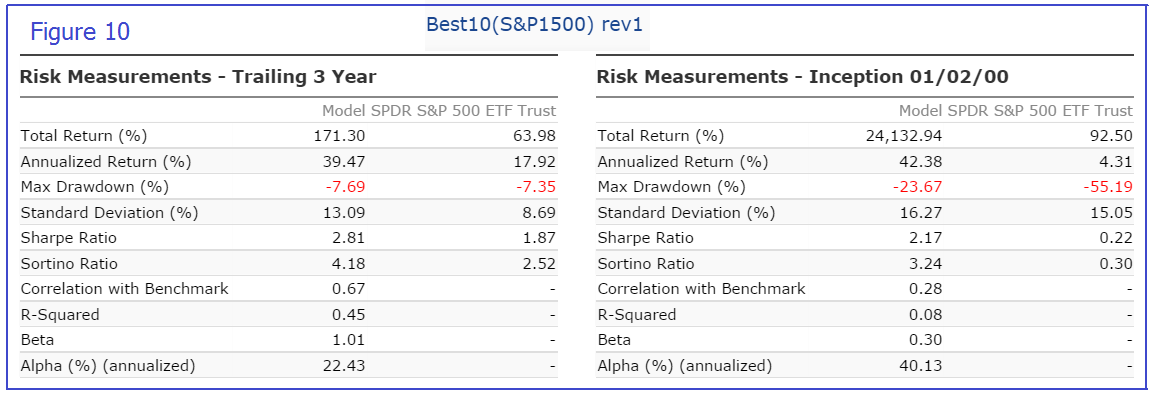
- Figure 10: Risk measurements for 15.5-years and trailing 3-year periods.
Following the Model
This model can be followed by subscribing to the revised Portfolio123 R2G, iMarketsignals will report the signals one day delayed so that subscribers to the model at P123 (who trade on Monday) are not prejudiced by anybody’s trades occurring later on Tuesday or on Wednesday.
Disclaimer
One should be aware that all results shown are from a simulation and not from actual trading. They are presented for informational and educational purposes only and shall not be construed as advice to invest in any assets. Out-of-sample performance may be much different. Backtesting results should be interpreted in light of differences between simulated performance and actual trading, and an understanding that past performance is no guarantee of future results. All investors should make investment choices based upon their own analysis of the asset, its expected returns and risks, or consult a financial adviser. The designer of this model is not a registered investment adviser.
What are the summary results for Tuesday entry and for Wednesday entry?
— Tom C
We don’t have those values. The model runs on P123 and the trading day is always the first day of the week.