
Bond-market:
 The BVR-model avoids high beta bonds (long-bonds) and also intermediate duration bonds.
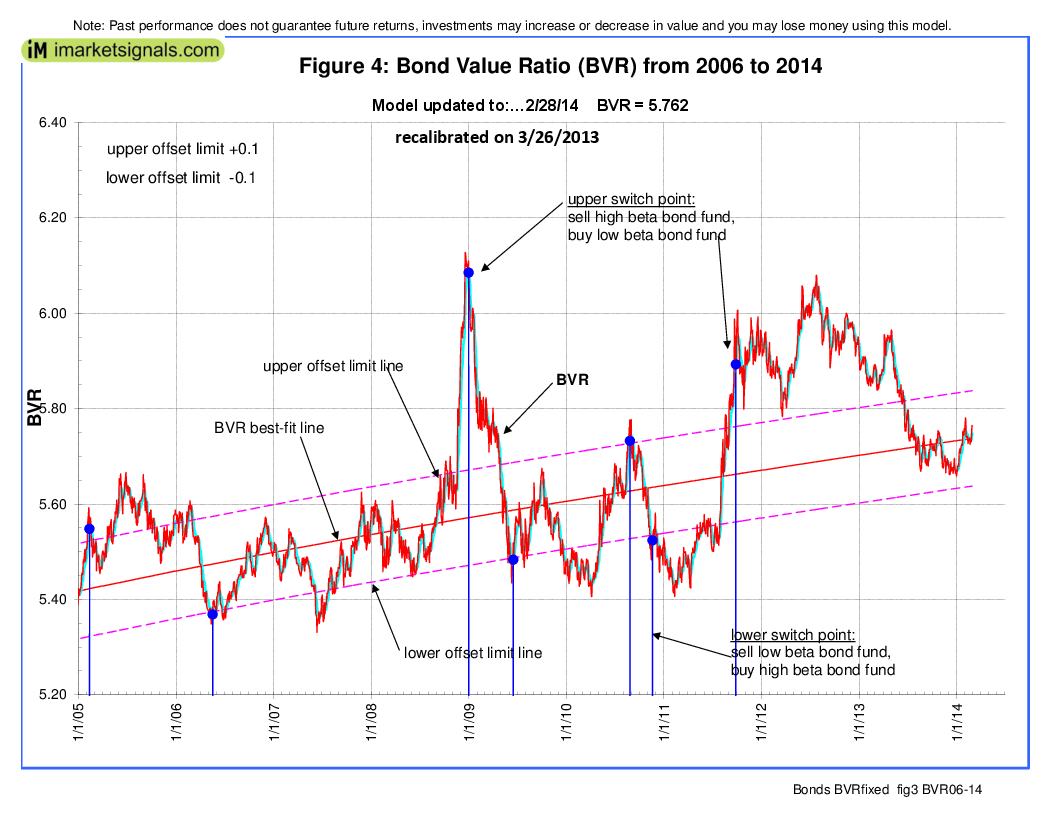
The Bond Value Ratio is shown in Fig 4. The BVR is higher from week’s level. According to the model, only when BVR turns upward after having been lower than the lower offset-line should one consider long bonds again.
The Yield Curve:
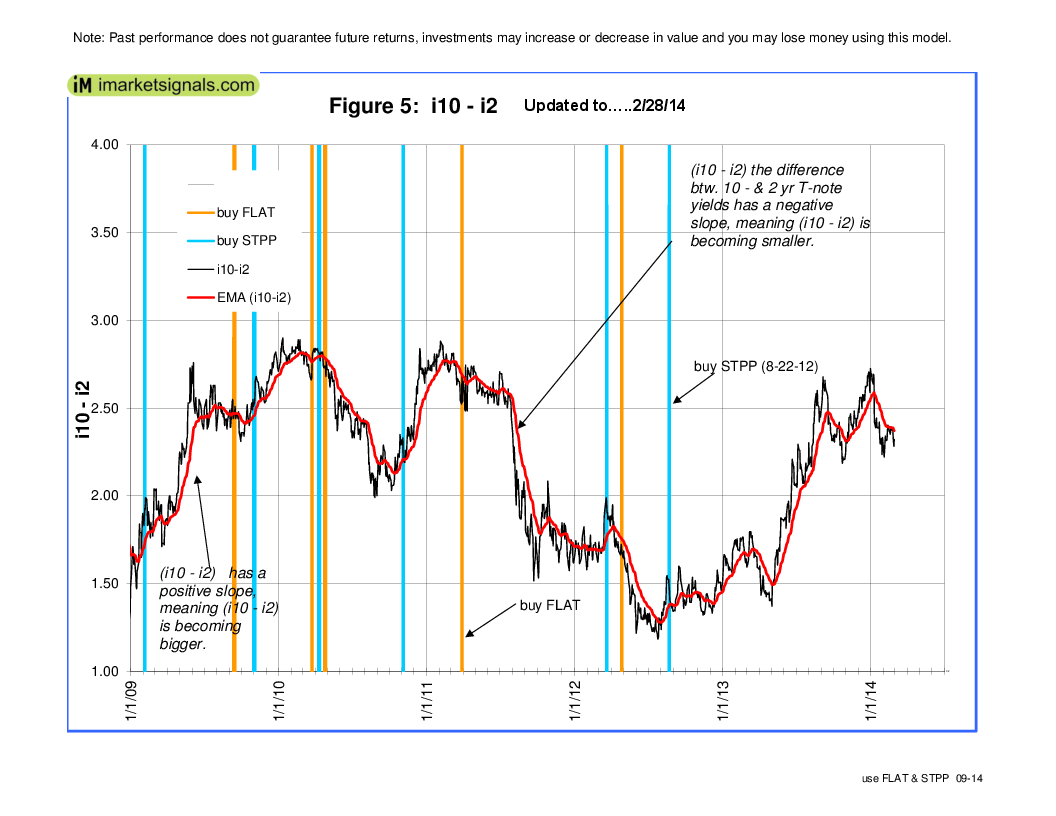 The yield curve model shows the steepening trend of the 10-year and 2-year Treasuries yield spread. Figure 5 charts (i10 – i2). The general trend is up, as one can see, although the yield curve has flattened recently. FLAT and STPP are ETNs. STPP profits from a steepening yield curve and FLAT increases in value when the yield curve flattens. This model confirms the direction of the BVR.
Gold:
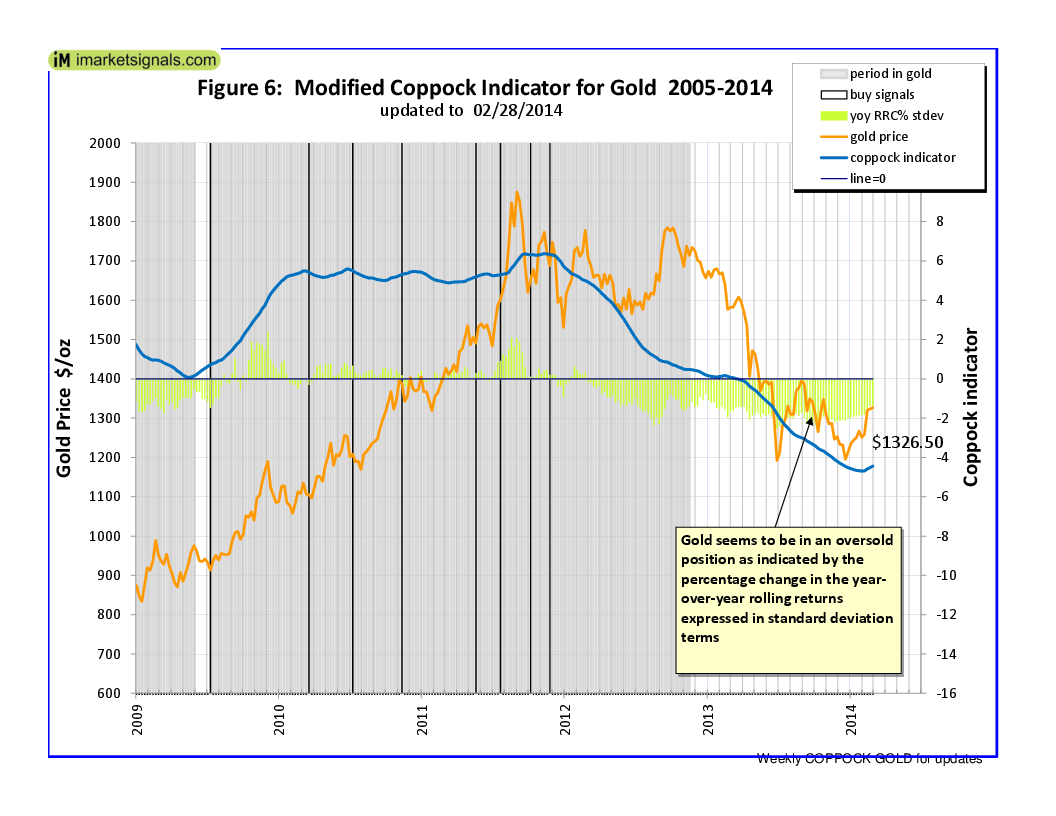 There is no buy-signal yet from the modified Coppock Gold indicator shown in Fig 6. This model has been out of Gold since Nov-26-2012, but according to our forward projection a new buy signal should emerge before the end of March 2014.
This indicator is described in Is it Time to Buy Gold Again? – Wait for the buy signal …….
Silver:
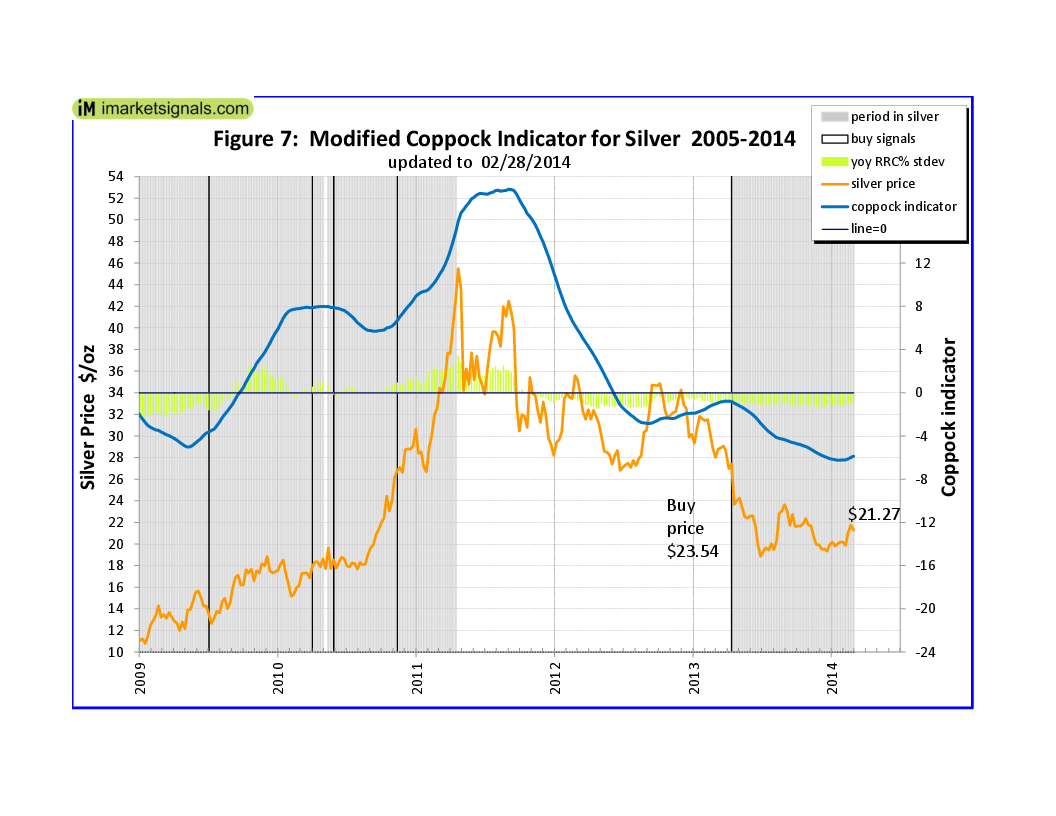 The modified Coppock Silver indicator shown in Fig 7 and is currently invested.
This indicator is described in Silver – Better Than Gold: A Modified Coppock Indicator for Silver.
Leave a Reply
You must be logged in to post a comment.