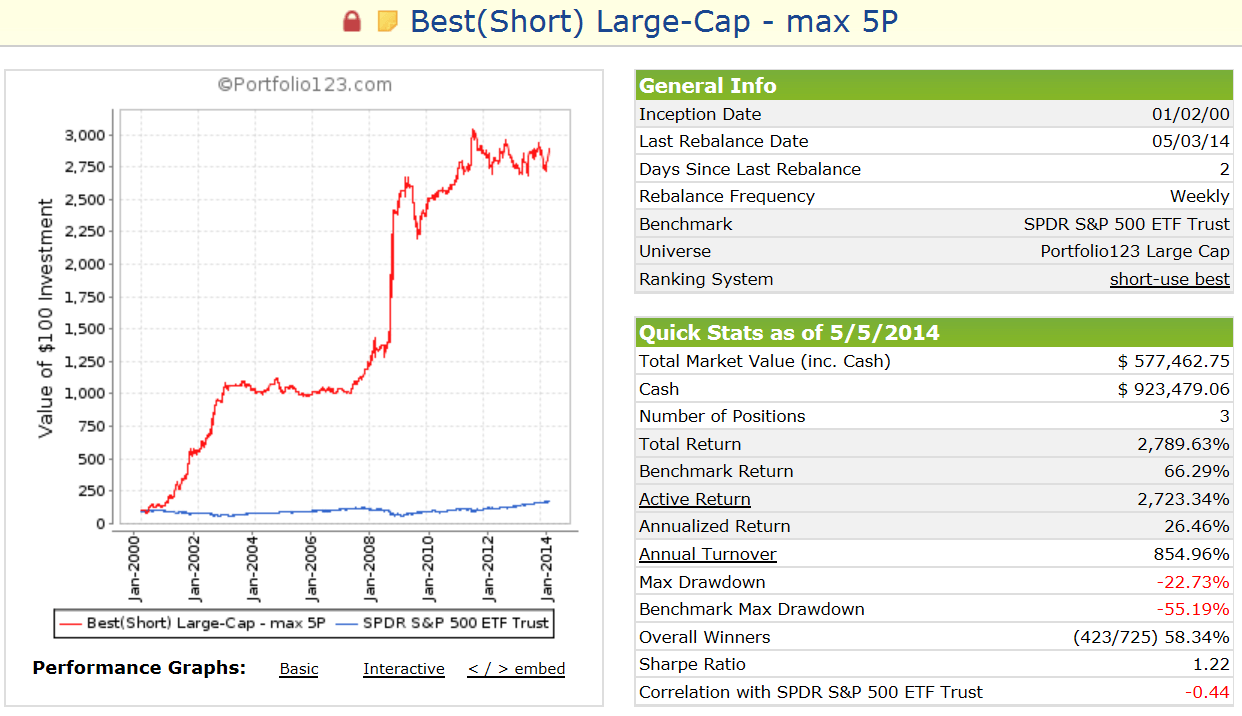
This model is intended to be used hedging long market exposure, not as a stand-alone model. It periodically holds a maximum of 5 short positions of large-cap stocks. The model was backtested from Jan-2-2000 to May-4-2014 on the Portfolio123 simulation platform as a stand-alone-model and would have provided an annualized average return of 26.5% with a max drawdown of -22.7% over this period.
Stock Universe
Stocks are selected from the Portfolio 123 Large-Cap U.S. stock universe, currently consisting of 535 stocks.
Ranking System
Stocks are ranked according to 7 indicator groups each having a number of parameters as shown in brackets, for a relatively low total of 13 parameters:
- Technical (4)
- Valuation (3)
- Efficiency (1)
- Financial Strength (1)
- Short Interest (1)
- Earnings Momentum (2)
- Price Momentum (1)
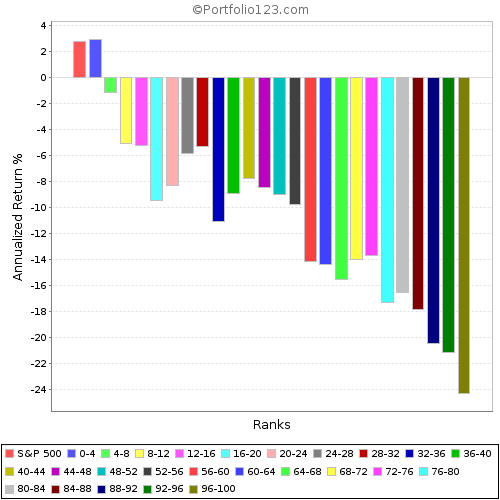
In the chart below the stocks of the universe are grouped in 25 “buckets” according to performance based on the ranking system only. It is evident that stocks ranked less then 4 (second blue bucket from the left) provided the highest positive returns for a short only model. This rank criterion was therefore adopted in the trading rules.
Rebalancing and Trading Rules
The model is rebalanced every weekend and signals are provided for the first trading day of the week. Trades were assumed to occur at the closing price of the trading day. Transaction costs of $1.00 commission, slippage of 0.1% and margin carry cost of 2.0% p.a. were taken into account in the simulation.
For a stock to be sold short all the following parameters and rules were simultaneously applied:
- Next year’s projected P/E Ratio.
- Rank < 4.
- Rank change over the last 2 weeks.
- Price > $3.00.
- Average daily total amount traded (price x volume): 10-week average> $50-million, 2-week average> $35-million and 2-day average> $30-million.
- Market-cap must be in the upper 80% of the universe. (This rule eliminates stocks which currently have a market-cap less than $8,500-million.)
- Stocks that were covered within the last 35 days are not considered for selection.
The rules to cover short positions are:
- Either the number of days since the position was first opened must be greater or equal 45,
- or it is based on moving average cross-overs of SPY, considering both long period and short period moving average cross-over systems.
Trading
The model will select a maximum of 5 stocks to be sold short, allocating 20% of the available funds to each of them. The simulation showed that there were many periods when the model had less than 5 positions or had no short positions at all. For example, if the model had only 3 short positions, than 60% of the funds would be allocated to the shorts and 40% would remain in cash.
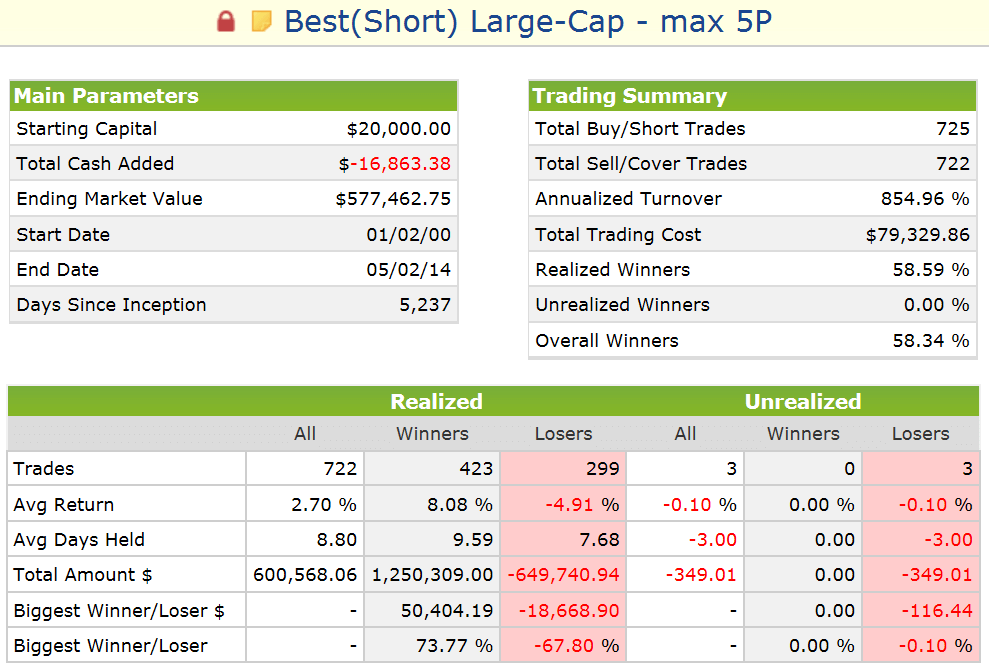
There were 722 realized trades (round-trips), of which 423 were winners and 299 were losers, providing an average return of 2.70% per realized trade. The average holding period was only about 9 days. This model trades almost every week.
Liquidity
This model only trades large cap stocks currently having a market-cap greater than $8,500-million and which also have a 2-day and 10-week minimum average daily total amount traded (price x volume) of more than $30-million and $50-million, respectively. Assuming one can trade 10% of the smaller amount without unduly moving the stock price, then this model could support a total short portfolio value of 10% x $30-million x 5 stocks = $15-million.
If this model was traded in a margin account having a value of 50% of the long portfolio, then one could hedge a $30-million long portfolio with it. Obviously this amount is insufficient to hedge very large long portfolios, but appears to be sufficiently large to accommodate many individual traders with smaller portfolios.
Performance
Simulated performance to end of April 2014 is shown in the screen-shot below and performance to end of December 2013 is in Figures 1, 2 and 3. Market Value and Cash shown is for an initial investment of $20,000.
In Figure 1 the green ratio graph indicates performance relative to SPY, the ETF tracking the S&P500. One can see that the model begins gaining on SPY about nine months before recession starts. During in-between-recession-periods the model loses relative to SPY. However, performance still had a weak upward trend from 2010 to 2013 and was flat from 2003 to 2006.
 Figure 2 shows the 1-year returns from the beginning of January to end of December over the last 14 years. One can see that the model out-performed SPY only during 6 of those years. The best performance was during years when SPY had negative returns.
 Figure 3 shows the rolling 1-year returns starting each day from 1999 to 2012. The minimum return over one year was -11.7%. One can see that the rolling return for the model were almost a mirror image of the rolling returns of SPY. Thus this model could be useful to hedge long market exposure.
Risk measurements
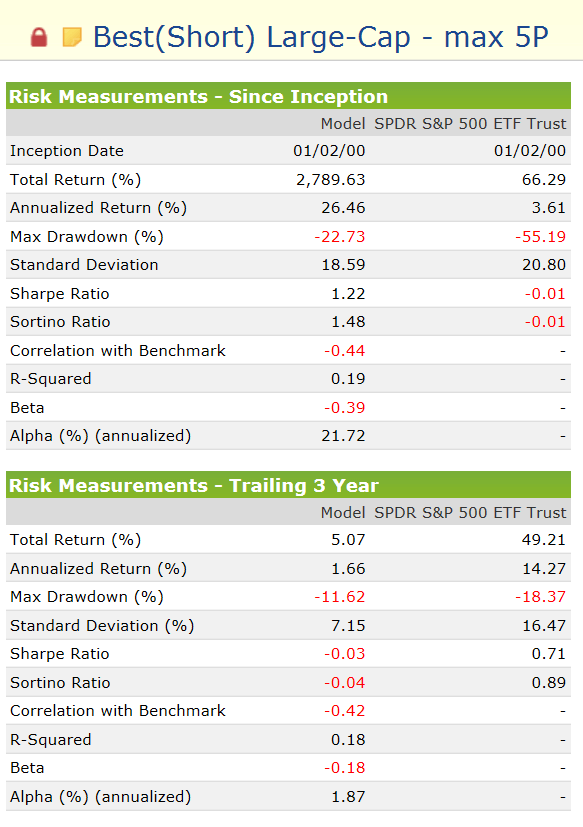
Risk measurements are in the table below, shown since inception and for the last 3 years.
Appendix
Performance from January 2009
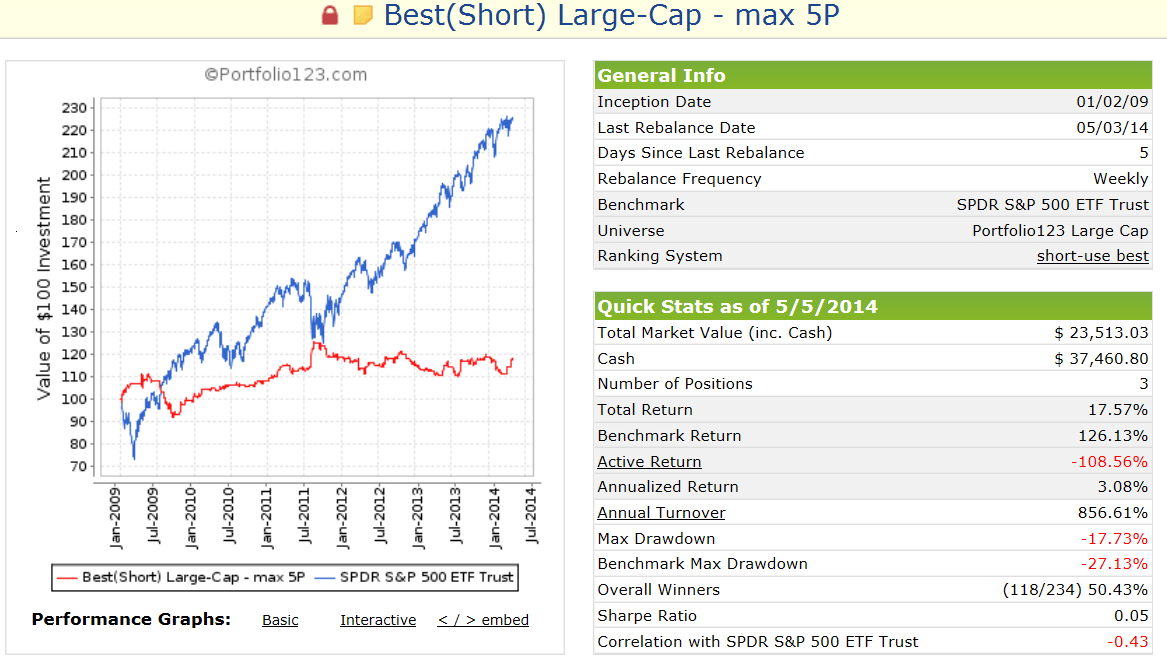
The screenshot below shows performance from 1-2-2009 to 5-5-2014. Market Value and Cash shown is for an initial investment of $20,000.
During this bull market period SPY gained 126%. It is difficult for short portfolios to gain during up-market periods. Nevertheless, Best(Short) still shows a gain of 17.6% equivalent to an annualized average return of 3.1%.
Our weekly updates will be based on this starting date, but with an initial investment of $100,000.
Disclaimer
Please be aware that all results shown are from a simulation and not from actual trading. They are presented here for information purposes only and shall not be construed as advice to invest in any assets or purchase any subscriptions mentioned, described or advertised. Out-of-sample performance may be much different. Backtesting results must be interpreted in light of differences between simulated performance and actual trading, differences between subscriber performance and live out-of-sample model performance, and an understanding that past performance is no guarantee of future results.
All investors should make investment choices based upon their own analysis of the asset, its expected returns and risks, or consult a financial adviser. The designers of this model are not registered investment advisers. GEOV LLC (A Connecticut limited liability company) and its agents disclaim any liability for losses incurred while acting upon information provided by the Company or its agents.


Very intersting portfolio. I would be curious to have some stats regarding a portfolio containing SPY (buy and hold) and Best(Short) with a weight of 10% or 25%.
From 1/2/2000 to 4/1/2014
SPY (buy and hold):
3.5% CAGR
-21.7% min. quarterly performance
1.2% avg. quarterly performance
22 quarters with negative performance
35 quarters with positive performance
SPY hedged with 25% Best(Short)
11.3% CAGR
25% short of long portfolio value
rebalanced every quarter
-12.7% min. quarterly performance
2.9% avg. quarterly performance
16 quarters with negative performance
41 quarters with positive performance
Thank you for your fast reply.
Another question (and after this, I promiss I let you enjoy your week end !), can you post the same stats from 2009 onwards together with drawdown ?
Thanks.
From 1/2/2009 to 4/1/2014
SPY (buy and hold):
pct. short of long portfolio value= 0%
annualized return= 17.5%
min. quarterly performance= -15.1%
avg. quarterly performance= 4.3%
quarters with negative performance= 6
quarters with positive performance= 15
SPY hedged with 25% Best(Short):
pct. short of long portfolio value= 25%
annualized return= 18.9%
min. quarterly performance= -12.7%
avg. quarterly performance= 4.5%
quarters with negative performance= 6
quarters with positive performance= 15
Very interesting performance in the two bears, especially the slower-moving 2000-2002 bear. Are you looking at whether there is a robust strategy that combines this short approach and SPY (or even SSO), using one of your timing systems to determine when to switch? Thanks
One can hedge the MAC-system with Best(Short). We will soon have performance for MAC-US hedged with Best(Short) available for review and discussion.
Did this project get shelved or are the results posted somewhere else?
This project has not been undertaken to date. Will have to investigate.
Or including in a book with the Combo 3?
Short models cannot be included in a P123 book because they would simply be handled as a stand-alone model together with the other models. We will soon have performance of Combo3 hedged with Best(Short) at iM with re-balacing every 3 months.
Have you tried any type of version of your model that simulates going short all five positions at all times and with a 100% SPY hedge?
Model does not always produce 5 short positions. Checking the transaction listing the 5 shorts usually occur only during down-market periods. During up-market periods usually zero to 3 short positions are generated.
Yes, that makes sense. I guess really I was wondering how much alpha is produced in theory if you were just short the bottom 5 stocks in your ranking system every week and long the same amount of SPY.
I would have to increase the minimum rank to do this. But as you can see from the ranking system anything over rank 4 will produce negative returns.
In reading your “rules to cover (close) short positions” you mention either 1) number of days since position was opened to be greater or equal to 45 or 2) a SPY MA crossover. In the recent weeks the shorts have been closed the following week so they do not meet rule number one and I don’t see how rule #2 could have been met either (but I don’t know the MA settings). Can you elaborate on the rules for closing/covering these short positions?
Rule2 uses two different moving average crossover systems which usually prevail during up-market periods. The shorts have been closed because Rule2 is currently in effect. Once market conditions deteriorate Rule2 may not be in effect anymore and the model will hold the short position at least 45 days. Since rebalancing is done weekly it will hold positions for 7 weeks (49 days) unless Rule2 kicks in sooner.
I’m not trying to crack the secret code of the MA but just trying to get a better understanding. Is Rule #2 a true “crossover” during the week or simply that when the MA’s are currently / continue to be “stacked” in such a way that the new short positions are only held for a week at a time?
Thank you for the additional insight on the 7 week minimum when conditions deteriorate.
Currently Rule#2 is continuously in effect so that the new short positions are only held for a week.
Got it, that makes sense. Thank you.
Another question (sorry). I’ve been checking margin rates. It looks like the rate from the two brokers I’m with have rates of 7.5% – 8.5% (+ or – depending on balance) and $6.00 commissions. You mention only $1 commission and only 2.0% margin carry cost in your analysis. At 100% hedging the difference in rates looks like it could really change up the results. How would the results look with the rates I mention?
You are with the wrong broker. Interactive Brokers currently charges 1.6% margin carry cost for a 50% margin balance. Check their site for commission. They have per stock and per trade commission.
Can you give us some insight as to when we could expect no short positions versus only one versus two – five shorts? I’m wondering under what conditions to expect portfolio protection and to what extent when including this system.
Thank You.
During up-market periods Best(Short)usually finds no more than 3 holdings. During down-market it finds more stocks to short and holds 4 to 5 positions.
Can you give us a weekly update of performances since launch, as you do with other systems ?
cidrolin, the weekly updates can be found here. Click on any post after after 5/5/2014. Furthermore, you should be logged in.
It looks like the shorts will pay off nicely this week for those using the system.
Can you explain “when” the margin was used in the overall results analysis? Was the margin carrying cost assumed on the total amount shorted from the initiation of the short positions or was it only used if/when each short position was at a loss? If used when at a loss from initiation was margin calculated on each day the position was at a loss? For instance if the position was down 3 of the 5 days but ended up profitable for the week was margin calculated on the 3 days it was at a loss?
I’m assuming the same margin cost calculation you used in the historical results is currently being factored into the weekly updates that you are posting on the bestshort model now, correct?
Margin carrying cost was conservatively calculated on the total amount shorted for the whole period from initiation of the short position until it was covered. The assumed interest rate was 2% p.a. and this was also applied for the days when a position showed a profit.
Our update model uses the same parameters as the model described.
That seems reasonable. Although the margin rate I would be charged is significantly higher it is only charged on the days the positions are having negative profits and if there is insufficient cash in the account to cover that negative amount.
Thank you.
So far a very useful model in 2016. I’m curious, in which month and year did the Max Drawdown of -22.7% occur?
Thanks.
Max D/D occurred March 9, 2009.