Also see: Improve on Vanguard LifeStrategy Growth Funds with a Dynamic Strategy
“Studies have shown that your asset allocation has a bigger impact on your long-term returns than any specific fund you pick. So why not pick a Vanguard LifeStrategy Fund that has asset allocation built in?” This is the opening statement on a Vanguard web-page, which also lists other potential benefits of investing in such a fund. The historic performance of the LifeStrategy Moderate Growth Fund was analyzed from Jan-2000 onward, and it is very clear from the analysis that this was a fairly high risk investment with low returns. An alternative investment model with Vanguard funds is proposed which would have produced much higher returns with less risk.
Vanguard uses four index funds which can be combined according to a specific asset allocation to form a LifeStrategy fund “that’s right for your situation”. There is no guidance given as what may be right for one’s situation, so the Vanguard LifeStrategy Moderate Growth Fund (VSMGX) was chosen for analysis, as its description implied that this would be a moderate risk investment with reasonable returns. It holds 40% of its assets in bond funds, and 60% in stock funds, and Vanguard maintains the specific static asset allocation by ongoing rebalancing, freeing you from the hassle of doing this yourself. The fund was analyzed to see whether its historic performance did in fact “help manage risk while trying to grow savings”, which is supposed to be one of the benefits of investing in a LifeStrategy fund.
Performance of LifeStrategy Fund VSMGX and component funds
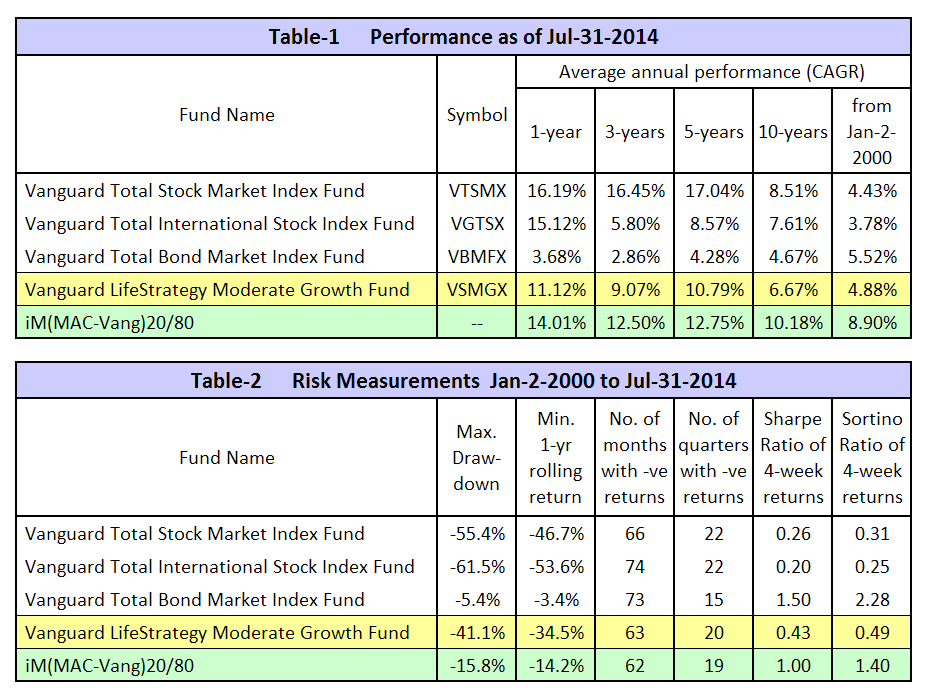
Table-1 and Table-2, (1st to 4th line) list the performance and risk measurements of LifeStrategy Moderate Growth Fund VSMGX and three of its component funds from the beginning of 2000 to end of end of July 2014. The fourth component fund, the international bond fund was omitted, because this fund is only about a year old. One can see that the lowest risk fund was the Total Bond Market Index Fund, but it also had the lowest returns over the last 10 years.
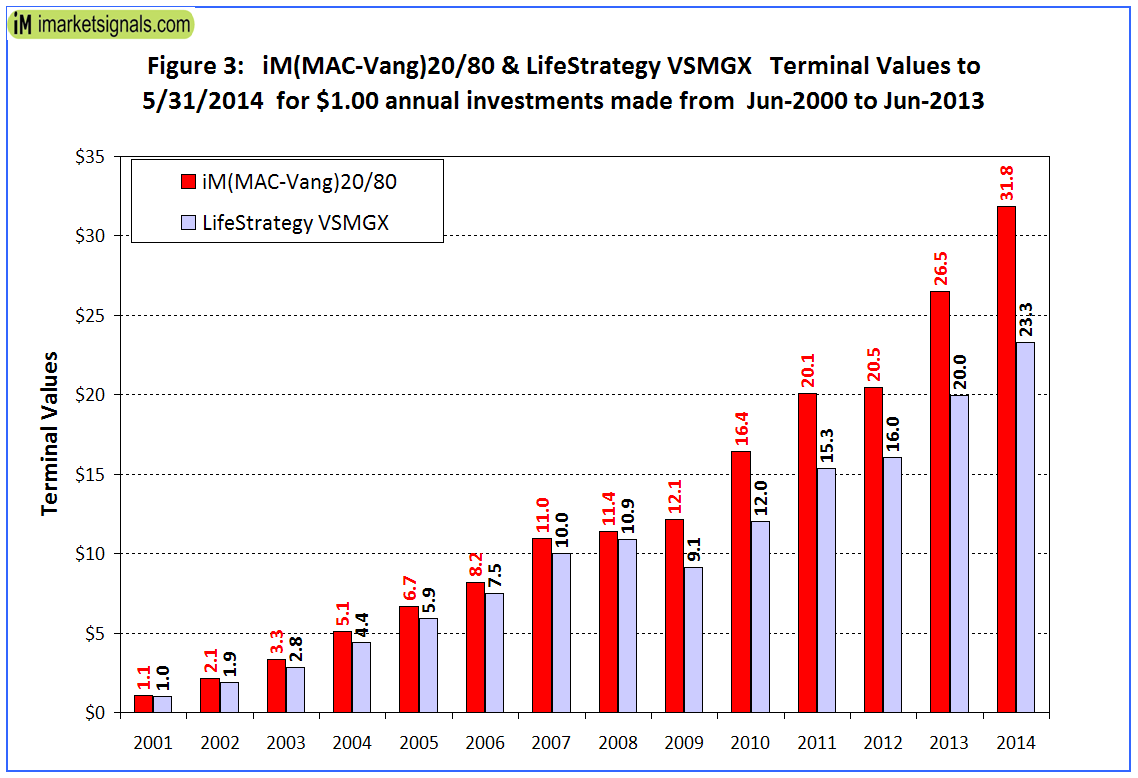
The 2000-2014 performance of the LifeStrategy Fund VSMGX is disappointing. Risk measurements do not confirm that this fund helped manage risk, and no beneficial impact on long-term returns was observed due to its specific asset allocation and mix. This can be seen from the returns of VSMGX over the last 10 years which were a lot lower than those of the single Total Stock Market Index Fund. In Figure-3, the low terminal value from annual recurring equal investments (not reported by Vanguard) shows that the LifeStrategy Moderate Growth Fund was not a desirable vehicle to save for retirement.
A better investment strategy with iM(MAC-Vang)20/80
Here is a better strategy to increase performance with less risk which anybody can follow. However, it requires some stock-market timing:
- Investment during up-market periods: 80% stocks and 20% bonds.
- Investment during down-market periods: 20% stocks and 80% bonds.
For simplicity only two Vanguard funds are used:
- Total Bond Market Index Fund (VBMFX)
- Total Stock Market Index Fund (VTSMX)
It is as simple as that: when switching the asset allocation according to stock-market climate, much higher returns can be achieved with less risk.
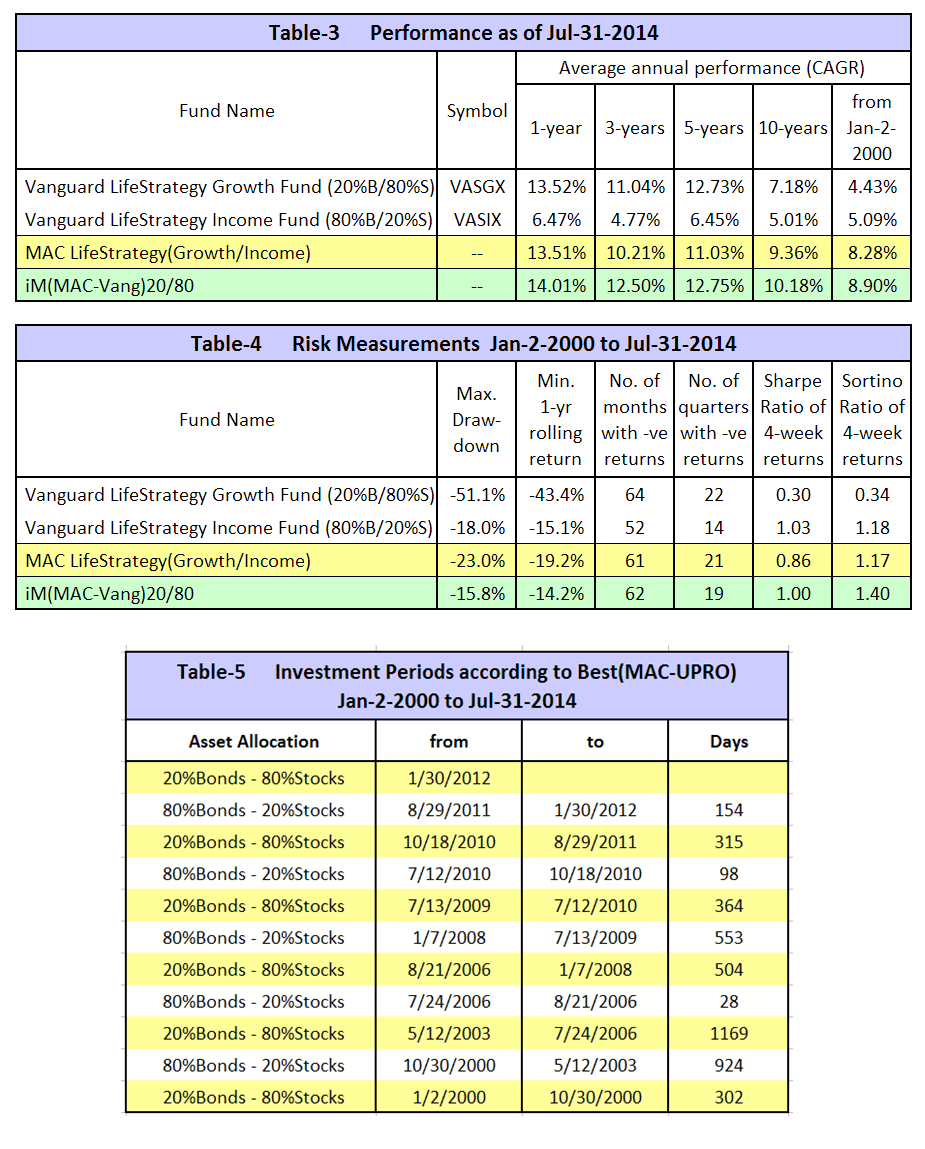
Note: One could also just switch between LifeStrategy Growth Fund (20%bonds – 80%stocks) and LifeStrategy Income Fund (80%bonds – 20%stocks) referred to hereafter as MAC-LifeStrategy(Growth/Income). Results for such a strategy are in the Appendix, Table-3 and Table-4. One can see that the performance and risk measures for iM(MAC-Vang)20/80 are somewhat better, confirming that more component funds do not provide a beneficial impact on returns. Vanguard’s LifeStrategy funds would have provided better returns if they just used the Total Bond Market Index Fund and Total Stock Market Index Fund, instead of including other bond- and stock-index funds in the asset mix as well.
The up- and down-market periods come from the MAC-US (backtested over 65 years), or alternatively the Best(MAC-UPRO) will provide nearly the same signal dates: up-market periods are indicated when the model is invested in UPRO. From 2000 to 2014 the models signaled only 5 down-market periods and 6 up-market periods, including the current up-market period; they are listed in Table-5 in the Appendix.
Performance of iM(MAC-Vang)20/80 versus Vanguard LifeStrategy Fund VSMGX
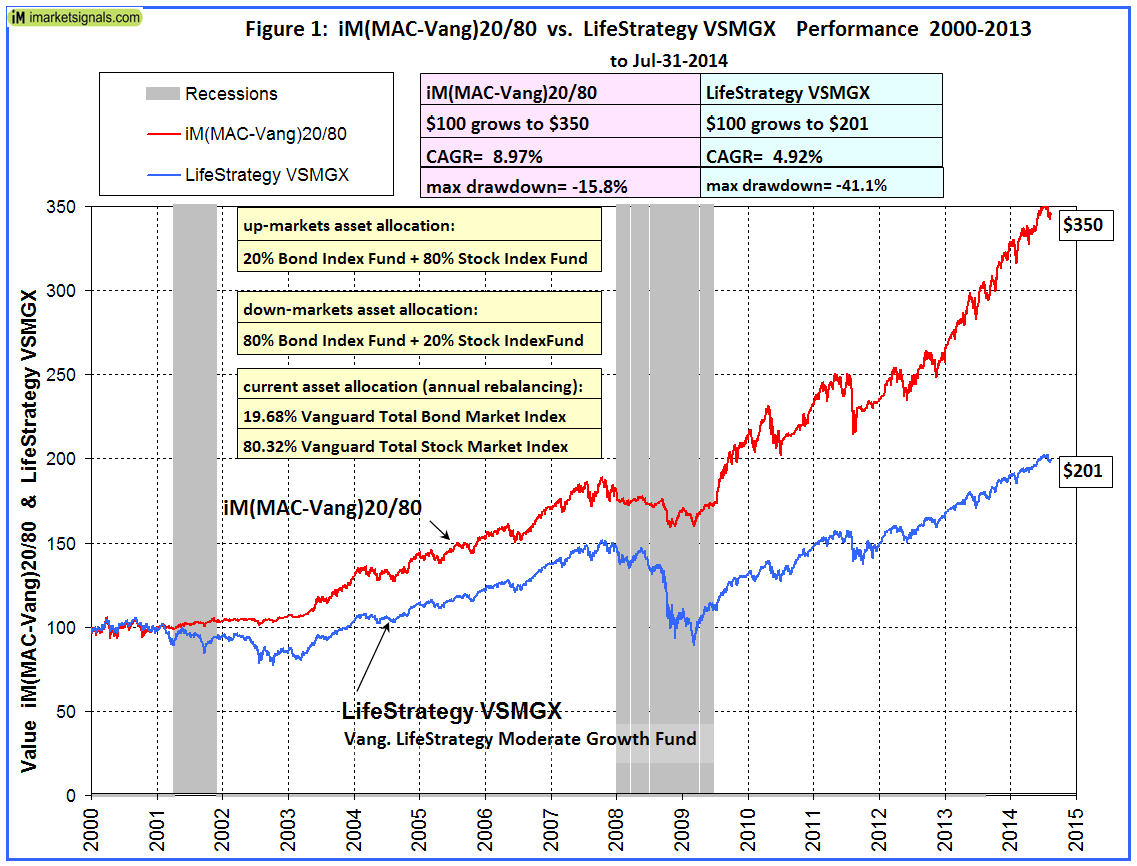
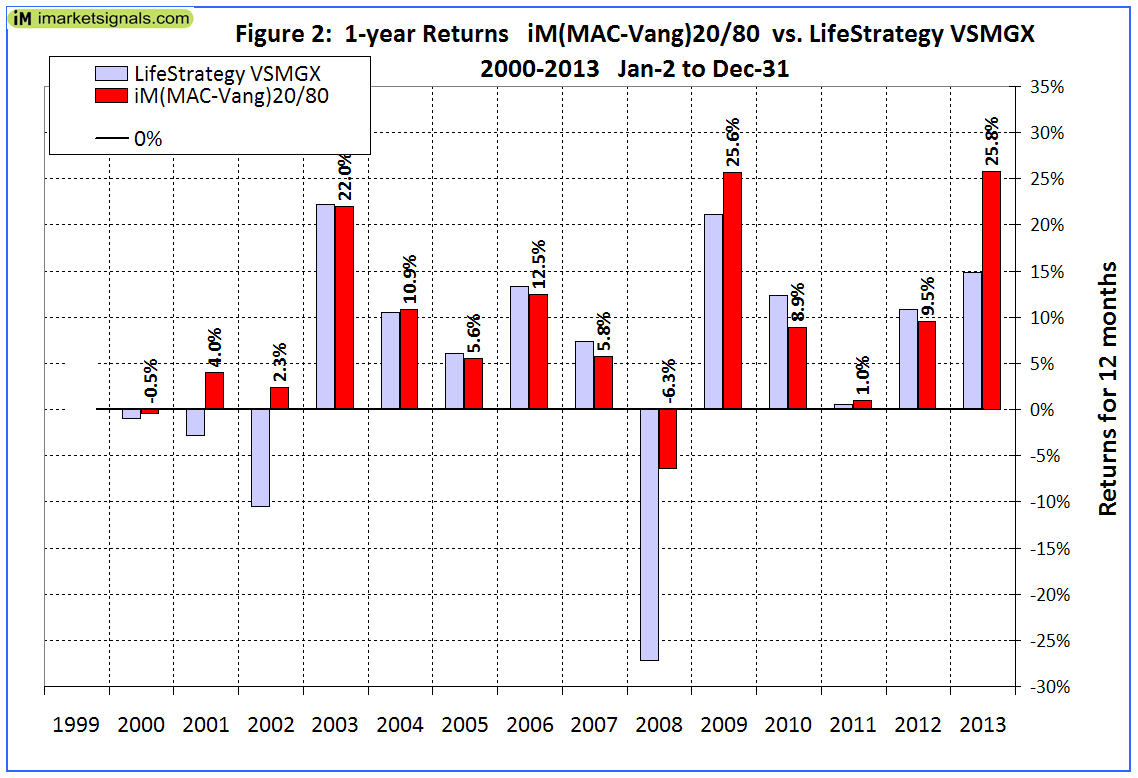
The backtest from the beginning of 2000 to end of end of July 2014 shows that performance and risk measurements for (MAC-Vang)20/80 were significantly better than for the Vanguard LifeStrategy Fund VSMGX. These are shown in the last line of Table-1 and Table-2 and also depicted in Figures-1 to 3.
In Figure-1 the performance of (MAC-Vang)20/80 is compared to that of the LifeStrategy Fund VSMGX. The performance of a $100 initial investment is graphed over time, clearly showing the superior performance of (MAC-Vang)20/80.
In Figure-2 the 1-year returns of (MAC-Vang)20/80 are compared to those of the LifeStrategy Fund VSMGX. There was only one year (2008) when (MAC-Vang)20/80 showed a significant negative return of -6.3%, but it was only about a quarter of the 27% loss of VSMGX for the same year.
Figure-3 shows the results of investing $1.00 each year from 2000 to 2013 in (MAC-Vang)20/80 and VSMGX. One would have invested a total of $14.00 cumulatively by the end. This simulates saving for retirement. It shows that the terminal values of (MAC-Vang)20/80 were higher for every year than those of the Vanguard Life Strategy Fund. After inflation, the $14.00 invested in the LifeStrategy fund would at the end have only have had a real value of $19.11, whereas the real terminal value from (MAC-Vang)20/80 would have been 36% higher at $25.92.
Conclusion
Investors in Vanguard funds can achieve good returns with less risk by following a simple market timing strategy to decide on the asset allocation for their investment. A dynamic asset allocation strategy dependent on stock-market climate is the key to better returns. There is no need to invest in many funds, only the Total Bond Market Index Fund and the Total Stock Market Index Fund are used.
Following iM(MAC-Vang)20/80
Monthly updates of asset allocation and performance for (MAC-Vang)20/80 will be posted on our website iMarketSignals.com. The specific asset allocation is maintained by rebalancing every 12 months, on the last day of the year. The last rebalance occurred on Dec-31-2013, and the asset allocation as of Aug-15-2014 is:
- 19.68% Vanguard Total Bond Market Index Fund (VBMFX)
- 80.32% Vanguard Total Stock Market Index Fund (VTSMX)

The back tested performance covers bond environments that were more normalized interest rate periods. The VBMFX index has approximately 60% bonds in 5-30 year maturities which skews the duration upward. A timing switch may increase the portfolio to higher duration risk and falling bond prices.
During down-stock-market periods interest rates normally decline, making bonds a good investment then. The 80/20 model has 20% of its assets in bonds during up-stock-market periods and 80% in bonds during down-market periods as indicated by the MAC-US.
Georg, good analysis, thanks for sharing this. Curious, based on your backtests, has 80/20 (20/80) been the “sweet spot” for this kind of switching? Have you tried other mixes between 50/50 and 100/0 (0/100)?
Tom C
Tom, I used 80/20 because Vanguard offers 80/20 LifeStrategy Funds. So one can simply use those funds and switch one’s investment between them according to the MAC signals.
A 60/40 System would have provided lower returns. Using only the Vanguard Total Stock Market Index and Bond Index funds one gets for period Jan-2000 to Jul-2014:
CAGR= 6.65%
max DD= -24.88%
Sharpe= 0.81
Sortino= 1.10
A 100/0 System would have provided higher returns. Using only the Vanguard Total Stock Market Index and Bond Index funds one gets for period Jan-2000 to Jul-2014:
CAGR= 10.97%
max DD= -18.7%
Sharpe= 1.02
Sortino= 1.33