
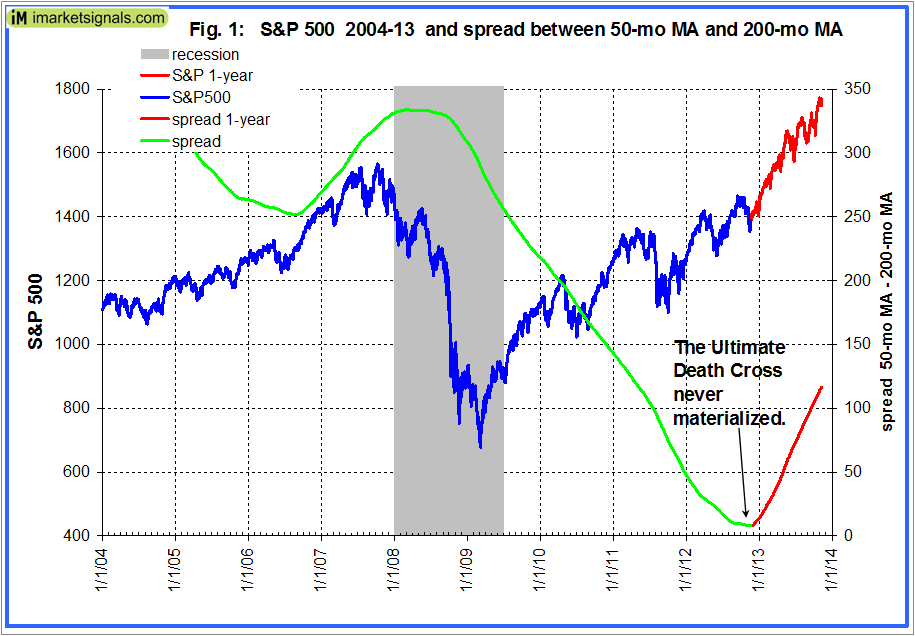
In July 2012 Albert Edwards, the closely followed investment strategist at Société Générale, warned that the S&P 500 was “on the verge of an ultimate death cross,” foretelling imminent major losses for the stock market, with the S&P 500 possibly seeing its index halved to 666 points. The ultimate death cross occurs when the 50-month moving average of the S&P moves below the 200-month moving average, or put another way, when the difference between these moving averages – the spread – becomes less than zero.
In this Jul-2012 article I reasoned that an ultimate death cross could not occur, predicting that the spread would form a trough before the end of 2012, and that this event would be a macro signal for a new bull market.
In a follow up early Nov-2012 article I showed that the spread’s lowest level would be 8, expected to occur at the end of Nov-2012, and that from then onwards the level would increase at least until Aug-2013, irrespective of the movement of the S&P 500.
It is now one year after the spread made a trough, so let’s see what really happened:
In Figure 1 below is the most recent plot of the S&P 500 and the spread to Nov-8- 2013.
- One can see that none of Edwards’ prediction came true; the ultimate death cross did not occur, the market did not collapse, but the S&P 500 is at the time of writing at an all-time high.
- The lowest level of the spread was 8.0 from Nov-16 to Nov-23-2012.
- From then onwards the spread continued to increase and on Nov-8-2013 reached a value of 116.7. (Red portion of spread graph.)
- The S&P500 gained about 30% since the spread made a trough. (Red portion of S&P graph.)
In the table below are the occurrences of all the previous trough formations of the spread since 1897 and the subsequent performance of the stock market. A trough formation close to zero is a rare event, having occurred only on five previous occasions, not counting the one of Nov-2012.
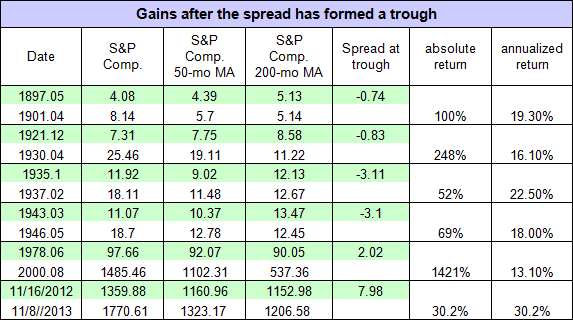
The previous trough occurred 35 years ago and heralded the bull market which only ended in 2000. Historically, troughs of the spread close to zero always provided a positive outlook for the market. It would appear from the performance of the market since last November’s trough that a repeat of history may be in the making. So far the market has “only” gained 30%, and this would appear to be on the low side when compared to previous gains after troughs.
The conclusion of my July 2012 article stands. The signal “….. provided a positive forecast for the stock market. It was never a harbinger of doom, but actually was a bearer of good tidings.
Hi Georg,
nice analysis. Soemtimes things are not what they appear to be.
What is your thinking (or educated guess) what the market will do, going forward?
Thanks.
We just got a Sell C signal for the IBH model. I am also monitoring S&P500 typical tracks to major downturns. I will post this soon. This presently signals a major market correction, but not a recession. After a pullback the market should be continuing to advance.
Remember these are all mathematical models. It is not my opinion or advice. It is just what is evident from the models.
Thanks Georg for your comment.
Looking forward to your upcoming post.