
The latest interim buy signal from my modified Coppock indicator was at the beginning of February, 2013, and this model will stay invested until the end of this year, possibly longer if another buy signal appears before then. This model would have produced a long-time average annual return from 1970 to 2013 about 4% higher than what one could have obtained from a continuous investment in the S&P; 500. The model avoided the 2000 and 2008 bear markets but did not avoid the 1987 market crash.
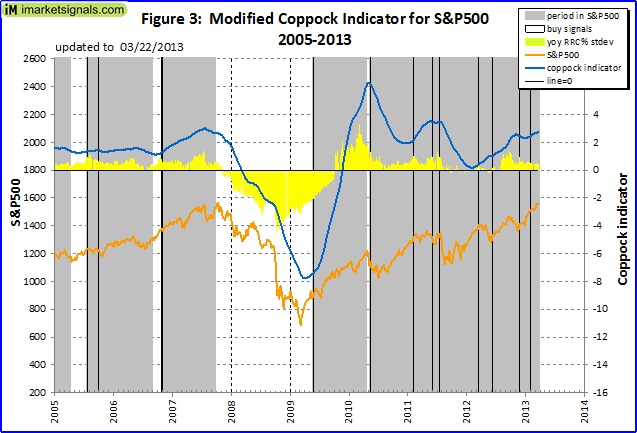
The Coppock indicator uses the rate of change trend of the underlying asset to determine buy signals. According to the original description of this indicator a buy signal is generated when the indicator is below zero and turns upwards from a trough. I found that a trough formation, big or small, usually identified good buying opportunities for the S&P irrespective of whether the indicator was below zero or not. Figures 1 and 2 show the S&P 500 from 1970 to 2013, the modified Coppock indicator, the buy signals, and the model’s investment periods (gray shaded periods). Buy signal dates were calculated from the data, not simply found by a visual inspection of the graphs, and are indicated by the black vertical lines on the charts. Figure 3 shows in more detail the recent history. In the appendix is the information on how to produce this indicator and the buy signals.
The percentage change in the year-over-year rolling returns for the S&P; 500 expressed in standard deviation terms for a 5-year rolling sample period is also shown (the yellow area graph, referred to as “yoy RRC% stdev”). This gives an indication of whether the S&P; is overbought or oversold, depending on the magnitude of this indicator.
An investment in the S&P; 500 according to this model’s signals produced a 14.1% compound average annual return (CAGR) from September 1970 to March 2013 with dividends reinvested and interest at the Federal Funds rate from a money market account when the model was not in the stock market. This is equivalent to $100 growing to $27,291 over this period. A continuous investment in the S&P would have produced only a 10.2% CAGR over this period, also with dividends reinvested, as shown in the table below.

Without dividends reinvested the S&P’s CAGR was 7.17%, and the models’ CAGR woud have been 12.14% which includes interest at the Federal Funds rate from a money market account when the model was not in the stock market.
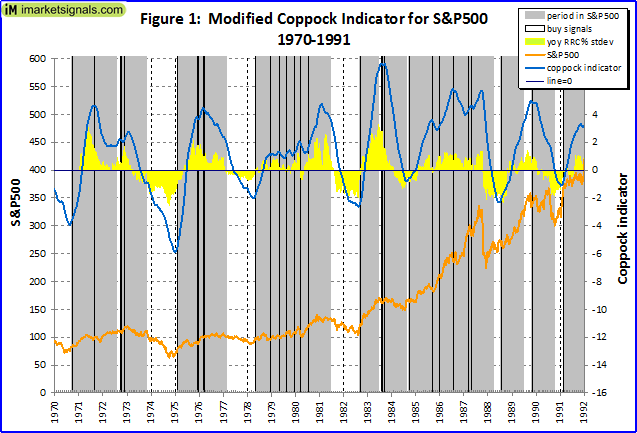
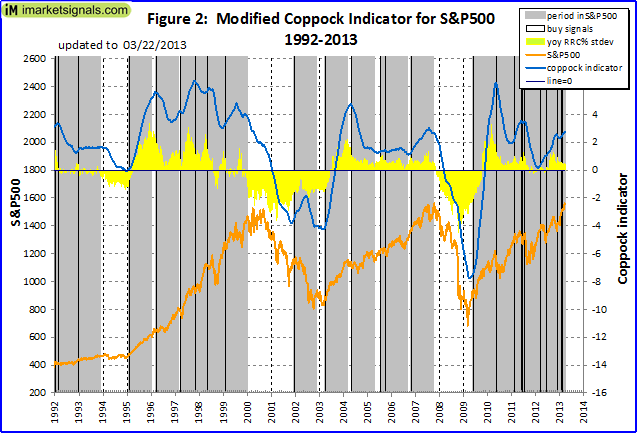
Sell signals cannot be determined with this indicator, but a good strategy was to sell when the S&P; had appreciated by 38%, but not later than 48 weeks after a buy signal date. However, if a new buy signal appeared before the sell date applicable to the previous buy signal, then the sell criteria was applied from the new buy signal’s date onwards, and so on. This had the effect of prolonging the holding periods if they contained numerous buy signals. There were 50 buy signals but only 22 investment periods.
The holding periods and returns for each period are shown below, with only 2 of the 22 periods showing a loss.

This model will soon appear on our website and will be the third stock market model we follow.
Appendix
The weekly S&P 500 values were obtained for every Friday and Monday over the model’s time span, from 1970 to 2013. The indicator was calculated with the Friday values. It’s the sum of the 57-week rate of change and 38-week rate of change of the S&P; 500, smoothed by a 32-week weighted moving average (WMA), multiplied by 10.
Indicator = 10 x WMA of (ROC[57] + ROC[38])
The criteria for buy signals are:
- The level of the indicator minus the level of a 8-period exponential moving average of the indicator must be greater than 0.03,
- and the maximum level of the indicator over the preceding 16 weeks minus the current level of the indicator must be greater than or equal to 0.004.
Once a buy signal is generated (on a Friday) the investment is made the following Monday.
A sell signal is generated when:
- the S&P 500 has appreciated for the first time by at least 38% from the buy price, as determined from the Monday price, but not later than 48 weeks after the buy date.
However, should a new buy signal appear before the sell signal applicable to the preceding buy signal has occurred, then the sell criteria apply renewed from the new buy signal onwards, and so on.
Leave a Reply
You must be logged in to post a comment.