
- The DAGS, short for Dynamic Linearly Detrended Enhanced Aggregate Spread, is a derivative of the Enhanced Aggregate Spread (EAS) recession indicator which comes from Robert Dieli.
- The DAGS can signal, as much as nine months ahead, when a cycle peak (recession start) is likely to take place.
- Armed with that information, investors can make appropriate plans. As of writing (May 2016), it signals, at least to the end of January 2017, a continuation of the expansion phase of this business cycle.
The parameters to determine the DAGS are the same as for the EAS:
- Yield of the 10-yr Treasury Note,
- Federal Funds Rate,
- Inflation Rate,
- Short-Term Unemployment Rate (27 weeks or less).
From those four parameters the Financial Spread and the Real Spread are calculated:
- The Financial Spread is the 10-yr Treasury Yield minus the Federal Funds Rate.
- The Real Spread is the Inflation Rate minus the Short-Term Unemployment Rate
The Enhanced Aggregate Spread is the difference between the Financial Spread and the Real Spread expressed in basis points (bps). It signals an upcoming recession when its level is at, or near 200 bps and falling.
DAGS: The Dynamic Linearly Detrended Enhanced Aggregate Spread
The EAS is currently at 439 bps and would have to fall by about 240 bps in order to reach the recession warning trigger of 200 bps. The EAS recession trigger of 200 bps assumes that the EAS is trendless. However the EAS has a trend. If the trend is ignored, then there could be a long delay for the EAS value to reach 200 bps, and the next recession signal could arise late.
To establish the trend one can perform a linear regression analysis of the EAS over the entire length of the data set. The latest trend line is the upward sloping green line (Figure-1), which has an end value of 364 bps. The difference between the end values of the EAS and the trend line is 439 – 364 = 75 bps.

The DAGS model signals a recession warning when the end value of the EAS equals the end value of its linear trend line. (In the figure both are shifted forward in time by 40 weeks.) Thus a recession start would be signaled if the difference between the end values of the EAS and the trend line is zero bps or less.
Trend lines differ for any previous end date of the data set. One example is the black “Previous Trend Line” shown in Figure-2. The Dynamic Linear Trend Line (DLT), the blue graph, is constructed by connecting the end points of all weekly trend lines obtained for data end dates from Jan-1968 onward. (Only two of the possible 2,520 weekly trend lines are shown for clarity.)
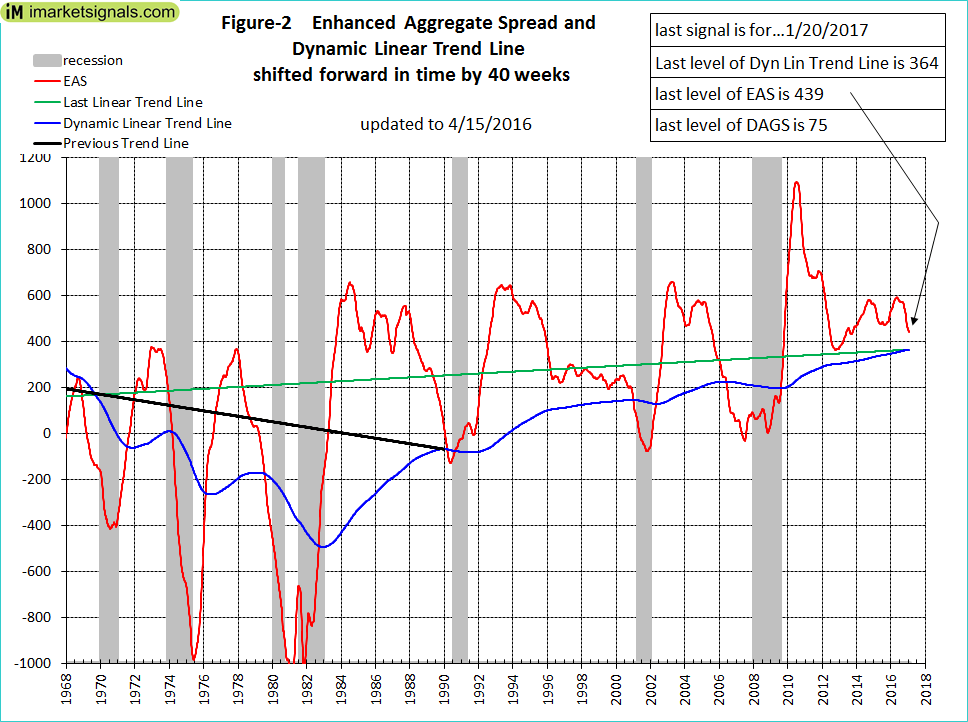
For example, the end value of the “Previous Trend Line” equaled the end value of the EAS in March 1989, signaling the oncoming 1990 recession about 15 months before the official July 1990 NBER cycle peak date. But because of the 40 week forward shift one would have known that the expansion phase of the business cycle was likely to continue to December 1989 as indicated in Figure-2.
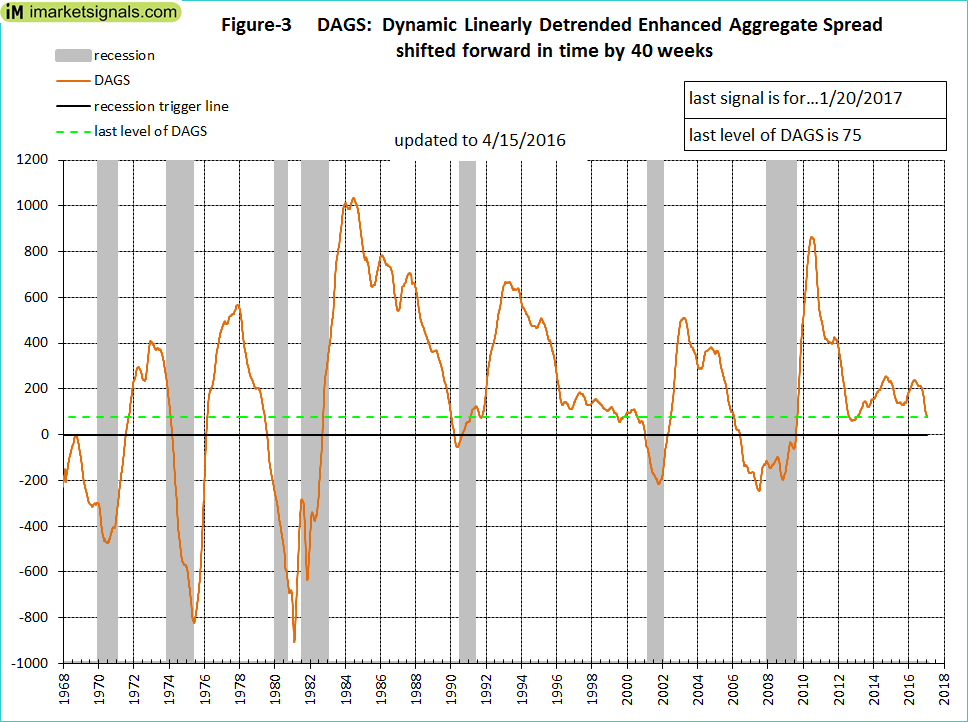
Figure-3 shows the DAGS, which is the difference between the EAS and the DLT. When DAGS gets to zero it warns of a cycle peak (recession start). The most recent level of DAGS is 75 bps. Thus it would only require the EAS to decrease by this value for DAGS to signal a cycle peak, whereas the EAS would require a decline of 240 bps to reach the EAS recession threshold level of 200 bps.
When will the DAGS signal an oncoming recession?
Assuming that the current trajectory of the DAGS does not change, then it will reach zero in the fourth quarter of 2016, signaling the possibility of a recession start 40 weeks later, in the third quarter of 2017. However the DAGS could rise again, as it did after January 2012 when it was at a similar level to where it is now.
Under current economic conditions the DAGS would indicate a cycle peak much earlier than the EAS, and when such a signal occurs there would be ample time to consult a set of coincident indicators to make a recession call.
What may cause the start of the next recession?
The 10-yr Note Yield and the Unemployment Rate add basis points to the EAS, whereas the Fed Funds Rate and the Inflation Rate subtract basis points from the EAS.
Accordingly, the changes to the model’s parameters which may be instrumental in bringing on a new recession are:
- decrease of the 10-yr Note Yield
- decrease of the Unemployment Rate
- increase of the Fed Funds Rate
- increase of the Inflation Rate (CPI)
It is unlikely that that the 10-yr Note Yield and the Unemployment Rate will decrease much from their current levels. So it would appear that an increase of the Fed Funds Rate and/or Inflation Rate will be the most likely cause to shove the economy into recession.
Therefore it is not surprising that the FOMC is reluctant to increase the Fed Funds Rate, but the FOMC expects inflation to rise to 2 percent over the medium term as the transitory effects of declines in energy and import prices dissipate and the labor market strengthens further. The CPI has increased by about 0.7% over the first quarter of 2016, and if this trend continues then the inflation rate could easily be 2% by the end of 2016. This alone would subtract 115 bps from the EAS.
In December 2015, the Fed indicated that its expected target Fed-Funds Rate would approximate 1.375% by year-end 2016 through four subsequent increases. Since then, however, the Fed has moderated its expectation to two increases approximating 0.875% by year-end. This would subtract another 50 bps from the EAS.
As of writing (May 2016) the 10-yr Note Yield is about 1.80% and the Short-Term Unemployment Rate is 3.6%. Assuming the Unemployment Rate to remain at this level, then the 10-yr Note Yield would have to increase by 1.65% to 3.45% for the EAS to remain at its current level. Under this scenario the DAGS would signal an upcoming cycle peak if the 10-yr Note Yield is lower than 2.7% at the end of 2016.
Following the DAGS
Investors can get almost one year warning of an upcoming cycle peak by monitoring the level of the DAGS. The monthly updates of this long leading recession indicator DAGS (Dynamic Linearly Detrended Aggregate Spread) can be followed at iMarketSignals.com. The EAS (Enhanced Aggregate Spread) is updated at nospinforecast.com.
Hi Georg,
again a thought provoking and well researched article.
Can you include a chart that shows the SP500 AND this recession indicator, so one could get a visual representation of its effectiveness?
Thanks.
The DAGS is not intended to be used as a market timer. It can only provide information whether a recession is likely to start during the following 8 to 9 months. Currently (as of May-2016) it signals to Feb-2017 that the US economy is unlikely to enter a recession.
Interesting series. Not sure I am reading Figure 3 correctly. Seems like the recession signal occurs when DAGS line crosses zero? And those points correspond to the points in Figure 2 when the EAS crosses the Dynamic Linear Trend Line in Figure 2.
If that is correct, looks like the lag between the signal and subsequent recession is highly variable: almost 18 months between the 2006 and the great recession, right at the start of the recession in 2001, actually after the start of the recession in 1974, and never recovered in 1981 to signal a recession in 1982.
You are reading this correctly. The ordinates of Figure-3 are the difference between the values of the EAS and the DLT.
Being such a long leading indicator, the lag between the signals and the subsequent recession start is highly variable. When we get a signal from the DAGS we shift our attention to the other indicators which have historically had much shorter lead periods. It is also counter-productive to exit the stock market long before a recession start, the optimum exit time seems to be about 4 months before a recession begins.
The EAS changed direction at the end of 1980 recession, and then reversed, signaling further downward pressure on the economy. The brevity of the recovery from the 1980 recession (12 months) was too short an interval to be fully captured by the model inputs.
Bob Dieli’s EAS+9 model has now signaled a <200 bp forecast for February of 2019. With both DAGS and EAS+9 signaling but no others even close to signaling, what environment should we be looking for this fall and into next year for equities and the economy in general? Do you see these lone signals as perhaps false-signals, or just extremely early?
Bob Dieli’s EAS model has now given its third consecutive monthly reading of the EAS below the 200 Basis Points. Based on the readings of the EAS prior to the last three recessions, once the EAS had gotten this low as it is now, it has only returned to the 200 Basis Point level and above until after the recession.
The conclusion is that a recession appears to be on the horizon, but at this stage nobody can say when it will begin. We are watching all our other recession indicators, none of which are signaling a recession.
As to your other questions, we are unable to provide financial advice as we are not Investment Advisers.