
- The long-term mean of the Shiller Cyclically Adjusted Price to Earnings Ratio P/E10 incorporates time-inconsistent data, causing substantial underprediction of realized stock returns in recent decades.
- Better prediction of market direction and returns can be achieved by using a 35-year moving-average of P/E10, instead of its long-term mean.
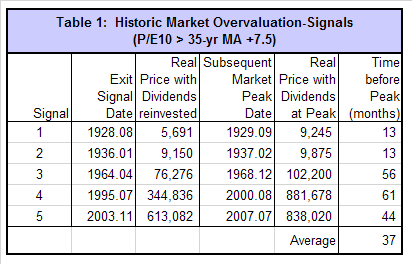
- Stocks seem only overvalued after P/E10 becomes greater than its 35-year moving average plus 7.5 added to it, with major market declines starting one to five years thereafter.
- An analysis shows that whenever P/E10 rose from below to above its 35-year moving average significant ten-year gains for stocks followed.
- Both the historic market trend, and the current level of the Shiller CAPE P/E10, suggest probable real market gains of about 20% to 28% to the end of 2020.
About two and a half years ago it was fairly obvious that a major bull market had commenced in 2009. Also a statistical analysis of the inflation adjusted historic data of the S&P-Composite from 1871 to 2012 indicated the same then. Since August 2012 the S&P500 with dividends has gained a real 53% to June 2015. So what further gains can we expect?
The historic market trend
The historic data from Shiller’s S&P series was used to estimate future market performance. For the real price of the S&P-Composite with dividends re-invested (S&P-real) the best fit line from 1871 onward is a straight line when plotted to a semi-log scale. There is no reason to believe that this long-term trend of S&P-real will be interrupted. S&P-real and the best fit line together with its 95% prediction band are shown in Figure 1, updated to June 2015.
The historic trend forecast (extending the best fit line and the prediction band) indicates a probable S&P-real value of 1,430,000 by the end of 2020, while the highest and lowest values shown by the prediction band would be 2,770,000 and 740,000, respectively. This represents a probable gain of about 20% for S&P-real over the next 4.5 years from its current value of about 1,196,000. The worst scenario would be a possible loss of about 50%, and the best outcome would be a 90% gain from the current level.
The Shiller CAPE P/E10
Also shown in Figure 1 is the Shiller Cyclically Adjusted Price to Earnings Ratio P/E10 (which is the S&P-real divided by the average of the real earnings over the preceding 10 years). P/E10 is currently at a level of 26.5 far above its 1881-2015 mean of 16.6, which according to Shiller signifies substantial overvaluation of stocks.
In an article from last September Shiller was quoted as follows:
“As of yesterday my price earnings ratio was 26.3. There’s only three major occasions in US history back to 1881 when it was higher than that. One is 1929, the year of the crash. The other is 2000, which I call the peak of the millennium bubble, and it was also followed by a crash. And then 2007, which was also followed by a crash. But that’s only three observations so I don’t say that it necessarily has to do the same thing, …but it is cause for concern.”
According to this recent commentary published in The Economist, Jeremy Siegel, Professor of Finance – Wharton School, does not share Shiller’s view on market valuation:
“My point is that the earnings series that Mr. Shiller uses has changed substantially since he developed the model some 20 years ago. The mandates of the Financial Accounting Standards Board in the 1990s required firms for the first time to employ “mark-to-market” accounting, a procedure which greatly increased the volatility of reported earnings. Such volatility was particularly evident in the recession that followed the financial crisis when reported earnings fell by a much greater percentage than they had during the Depression of the 1930s, a slump that was five times as great.
The failure to correct for the change in accounting methodology leads to a significant overstatement of the CAPE ratio and the model’s substantial underprediction of realized stock returns in recent decades. There have been only nine months since January 1991 when the CAPE ratio has been below its mean (signaling undervaluation), while in all but six months since 1981 the realized ten-year returns from stocks have exceeded forecasts using the CAPE model. In fact, the CAPE methodology signaled the stockmarket “overvalued” in May 2009 when the S&P 500 Index was 920, far less than one-half its current level.
These prediction failures are a result of time-inconsistent data, not a defect in the CAPE model. The Shiller CAPE ratio remains the best tool for predicting long-term real stock returns.
When a time-consistent series of corporate earnings, such as those published in the national income accounts are used instead of GAAP earnings, not only does the predictive power of the CAPE ratio improve, but the current stockmarket does not appear nearly as overvalued.”
A more realistic approach to the use of P/E10
In order to overcome the problem of time-inconsistent data in P/E10, a better approach to predict market performance would be to use a moving average of P/E10 rather than the 1881-2015 long-term average. In this analysis a 35-year moving average was calculated, currently having a level of 21.6, which is significantly higher than the long-term average of 16.6. This indicates that the current stockmarket is not nearly as overvalued as the level of P/E10 relative its the long-term mean would suggest, all as shown in Figure 1.
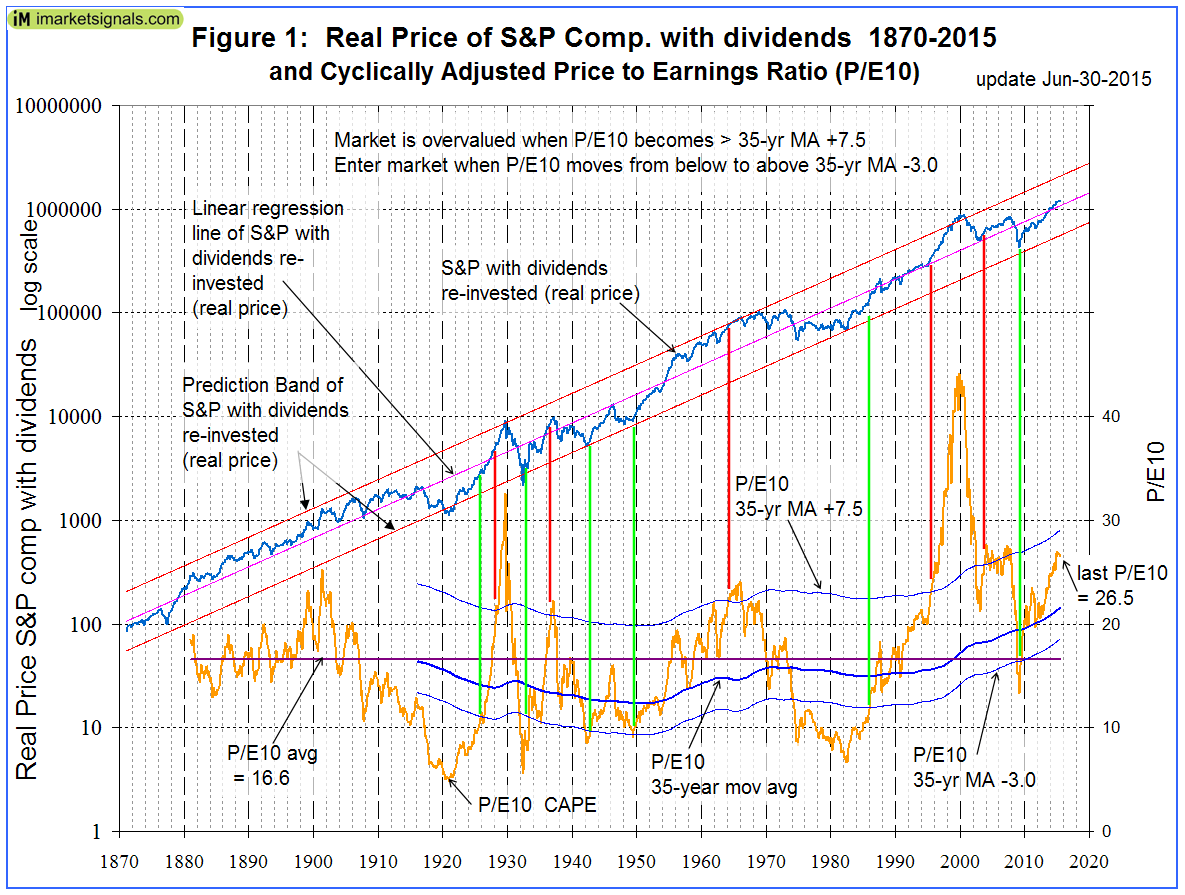
Stocks appear to be only overvalued when P/E10 becomes greater than its 35-year moving average plus 7.5 added to it, indicated by the red vertical lines in the figure and listed in Table 1. This happened on five occasions, with substantial market declines beginning one to five years after the signal dates. The current level of P/E10 is well below this critical level, which would indicate that the stockmarket is not greatly overvalued, nor likely to crash anytime soon.
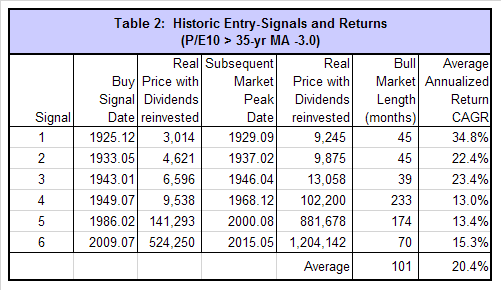
Good entry points for the market occurred when the P/E10 moved from below to above the 35-year moving average with 3.0 subtracted from it, indicated by the green vertical lines in the figure. The last signal from July 2009 was followed by major market gains, similarly to what occurred after each of the previous five signals. The historic signals and subsequent market peak dates are listed in Table 2 with their respective S&P-real prices and returns. For the current bull market the peak date was May 2015, but this may change, of course, in the future.
Estimating 10-year returns with P/E10
An analysis shows that whenever P/E10 rose from below to above its 35-year moving average significant stockmarket gains followed. There were 10 such events in the past, at least three years apart, the latest occurring in November 2009, as shown in Table 3 below. The table lists the ten-year returns of S&P-real after the first nine signals, and also the average of them, from which the 10-year future estimated S&P-real price for November 2019 was calculated.
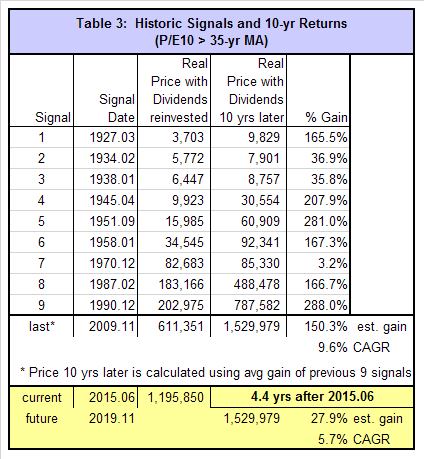
One finds that the November 2019 estimate for S&P-real is about 1,530,000, as shown in Table 3. This is very close to the historic trend forecast of 1,430,000, and represents a 28% real return over the next 4.4 years from the current value of about 1,196,000, or a 5.7% average annualized return.
Conclusion
Based on past history, the current level of CAPE P/E10 suggests moderate longer-term returns, but does not indicate a severely overvalued market, nor does it signal an imminent market crash, but market corrections are always possible. Also the historic trend forecast to 2020 indicates a probable gain of about 20% for S&P-real from its current value. This, and the forecast derived from P/E10, suggests an average annual growth rate for the next five years of only about 5% for S&P-real, which includes dividends.
Georg,
How did you settle on a 35-year moving average? Thx.
Why did Shiller use a 10 year average of P/E? It is a rather arbitrary time period considered to be at least the length of one business cycle.
A period of 35 years was chosen for the moving average because it typically spans over at least four business cycles and should provide a more realistic reflection of the underlying data that would otherwise be time-inconsistent.
When you refer to S&P-real that means adjusted for inflation?
Yes, that is what it means.
An exit signal occurred November 2003. The subsequent entry signal occurred July 2009. Is this a correct treading of the signals? Thanks for the analysis; very interesting.