  |
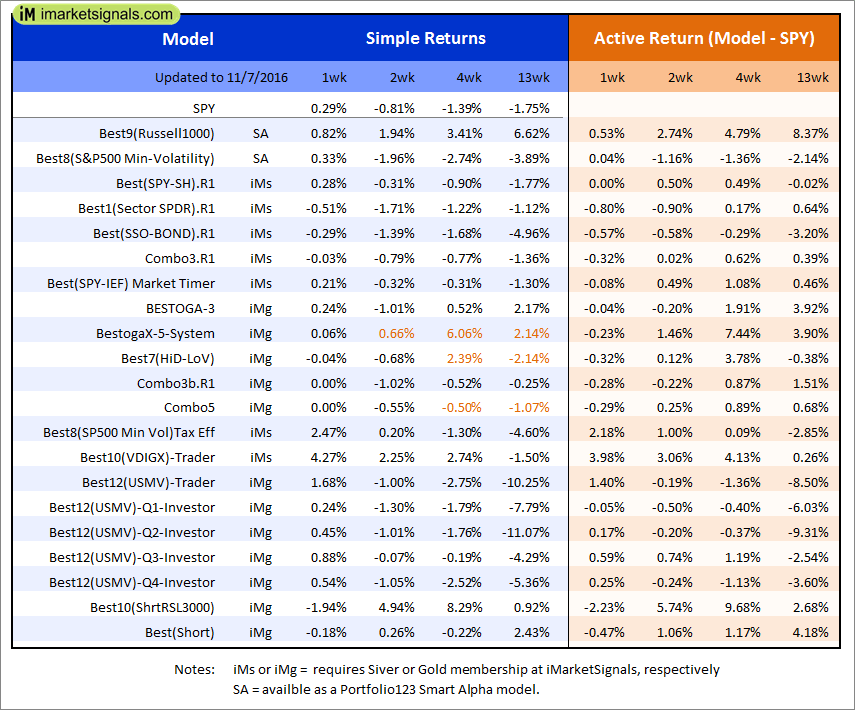
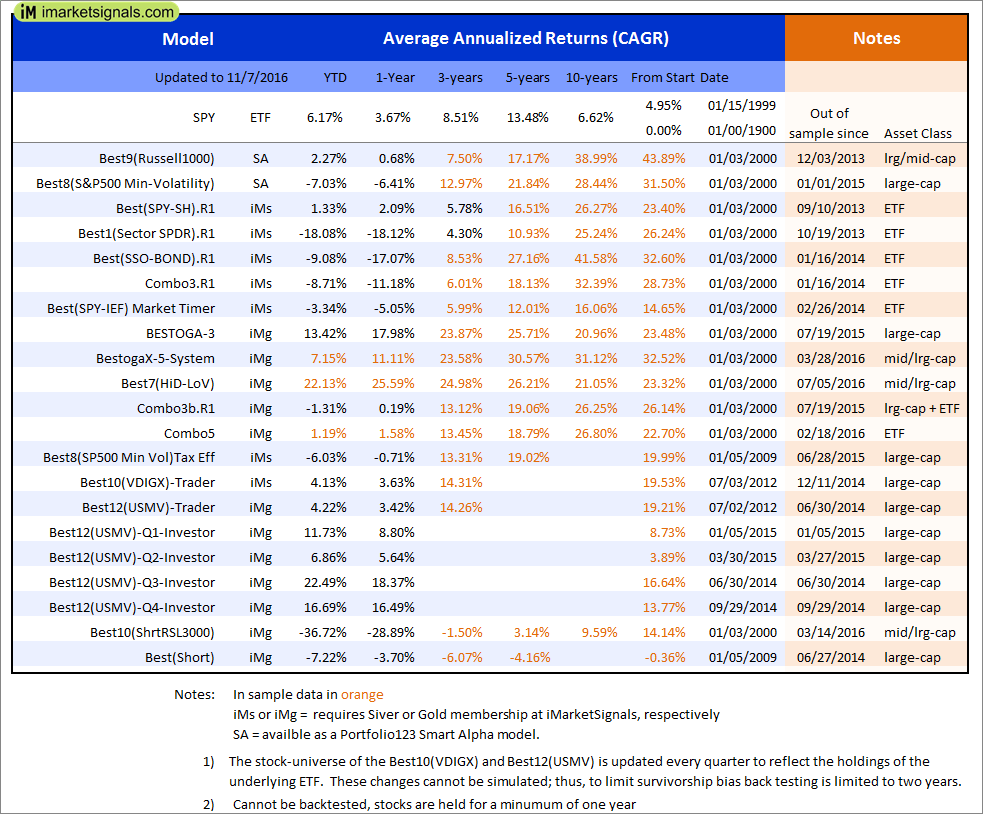
Out of sample performance summary of our models for the past 1, 2, 4 and 13 week periods. The active active return indicates how the models over- or underperformed the benchmark ETF SPY. Also the YTD, and the 1-, 3-, 5- and 10-year annualized returns are shown in the second table |
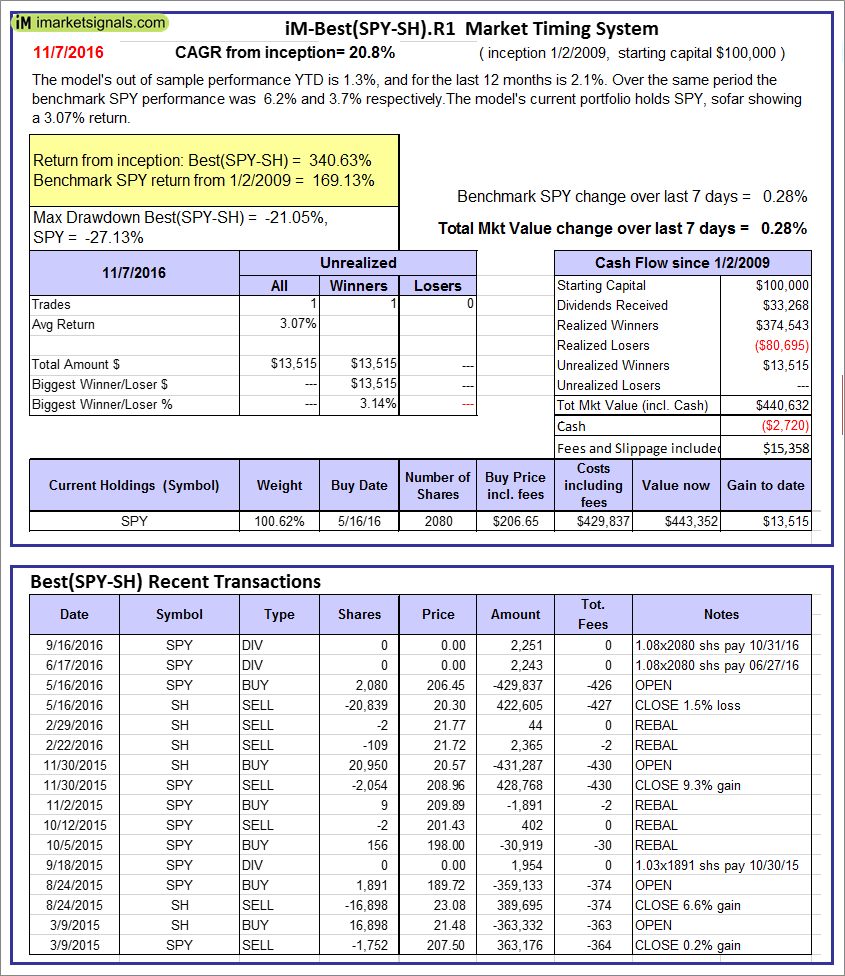 |
iM-Best(SPY-SH).R1: The model’s out of sample performance YTD is 1.3%, and for the last 12 months is 2.1%. Over the same period the benchmark SPY performance was 6.2% and 3.7% respectively. Over the previous week the market value of Best(SPY-SH) gained 0.28% at a time when SPY gained 0.28%. A starting capital of $100,000 at inception on 1/2/2009 would have grown to $440,632 which includes -$2,720 cash and excludes $15,358 spent on fees and slippage. |
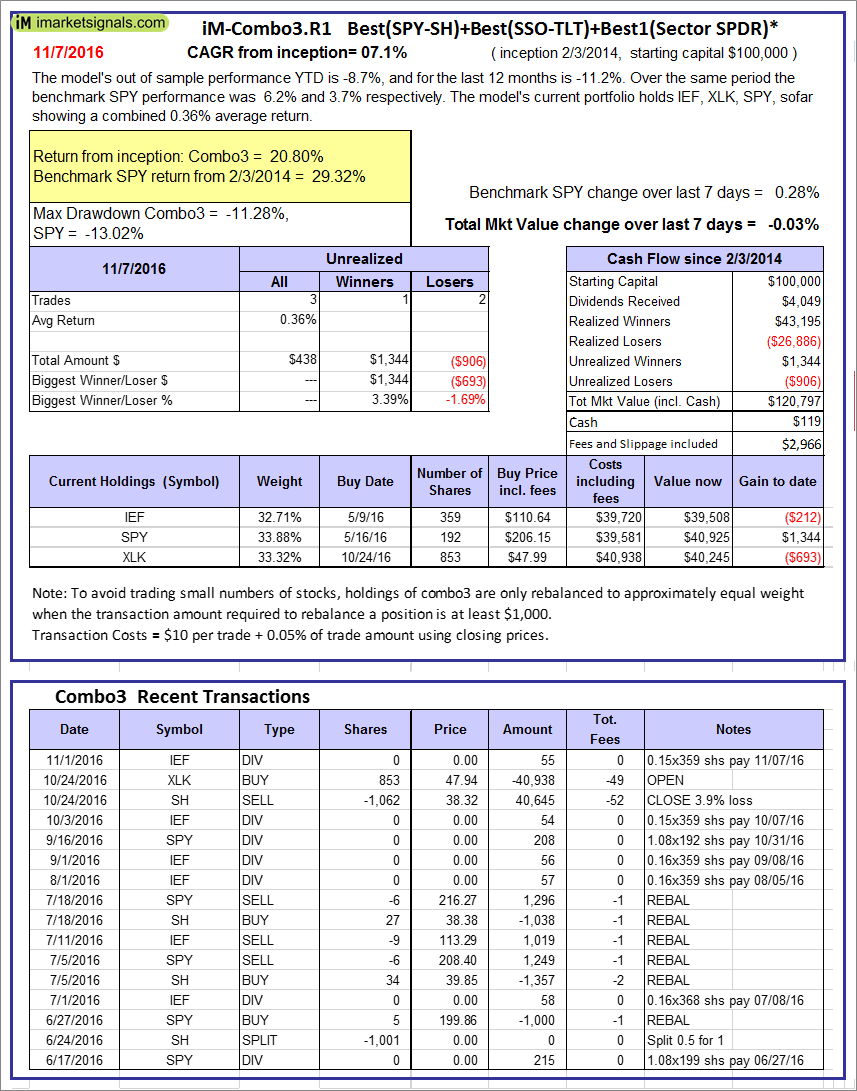 |
iM-Combo3.R1: The model’s out of sample performance YTD is -8.7%, and for the last 12 months is -11.2%. Over the same period the benchmark SPY performance was 6.2% and 3.7% respectively. Over the previous week the market value of iM-Combo3.R1 gained -0.03% at a time when SPY gained 0.28%. A starting capital of $100,000 at inception on 2/3/2014 would have grown to $120,797 which includes $119 cash and excludes $2,966 spent on fees and slippage. |
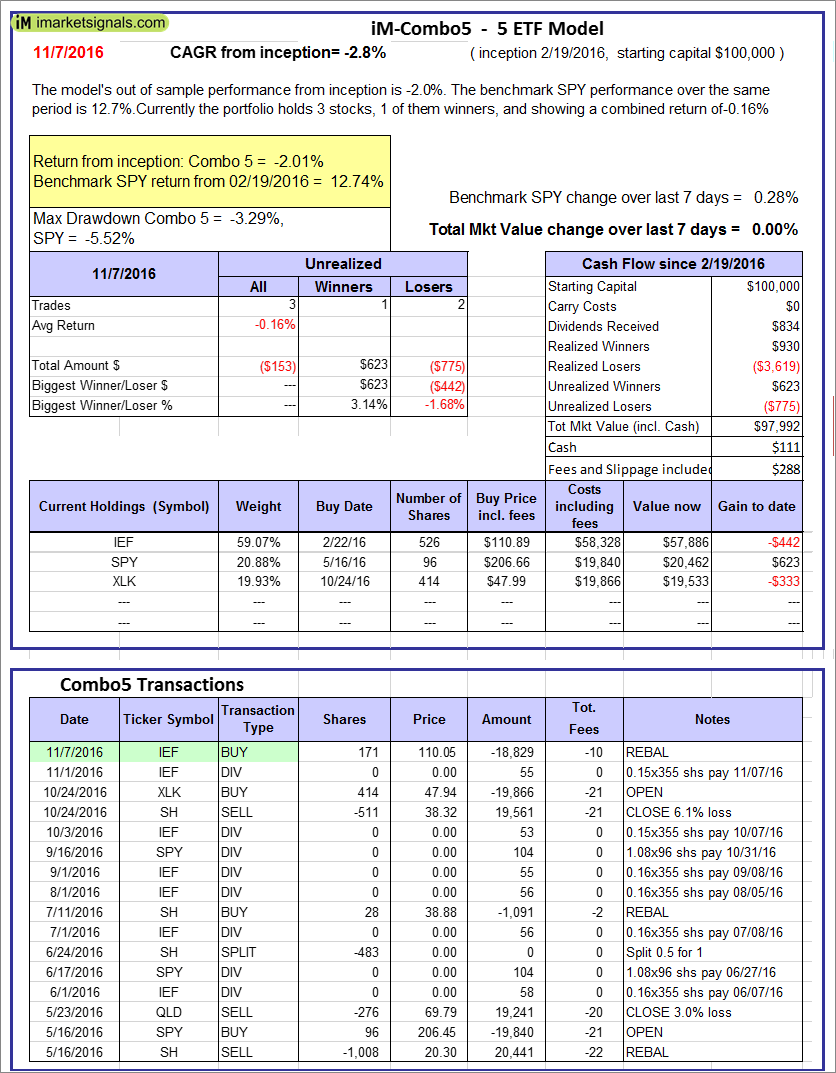 |
iM-Combo5: The model’s out of sample performance from inception is -2.0%. The benchmark SPY performance over the same period is 12.7%. Over the previous week the market value of iM-Combo5 gained 0.00% at a time when SPY gained 0.28%. A starting capital of $100,000 at inception on 2/22/2016 would have grown to $97,992 which includes $111 cash and excludes $288 spent on fees and slippage. |
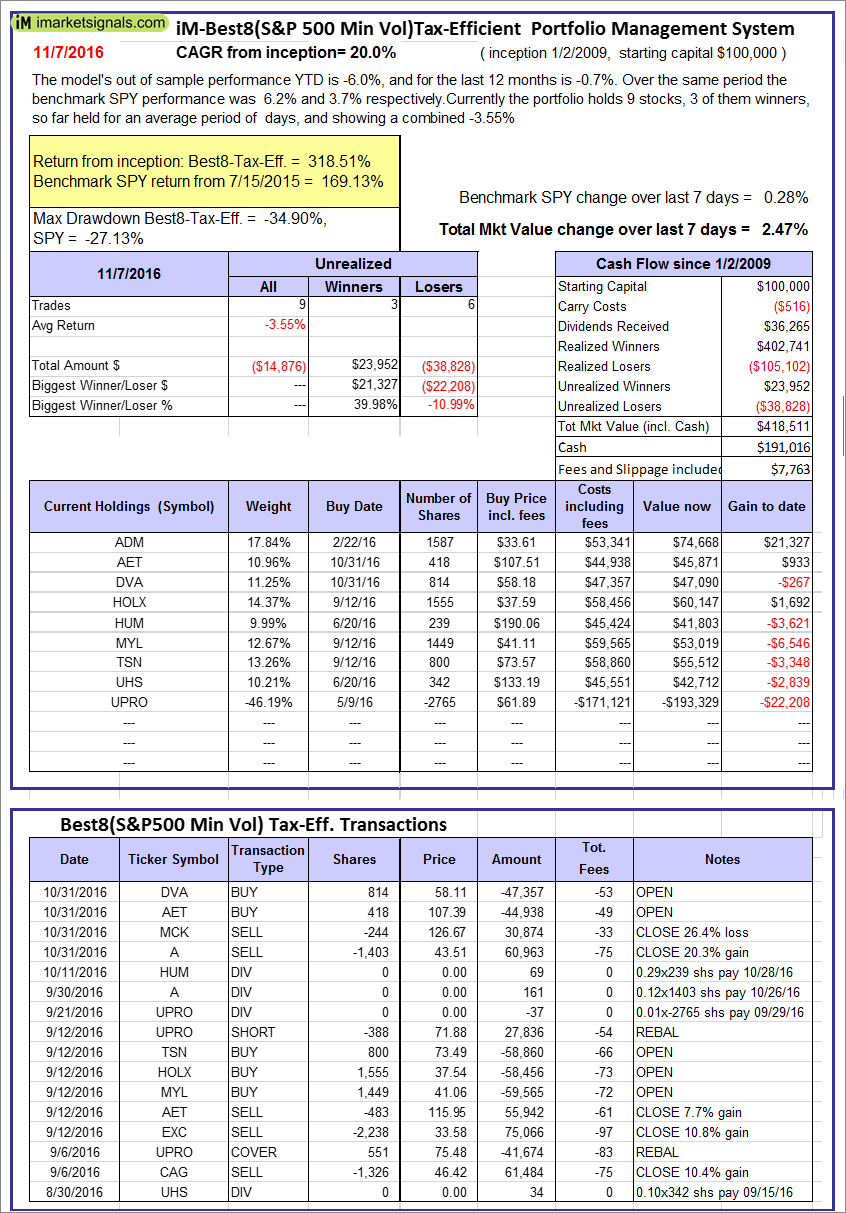 |
The iM-Best8(S&P500 Min Vol)Tax-Efficient The model’s out of sample performance YTD is -6.0%, and for the last 12 months is -0.7%. Over the same period the benchmark SPY performance was 6.2% and 3.7% respectively. Over the previous week the market value of iM-Best8(S&P 500)Tax-Eff. gained 2.47% at a time when SPY gained 0.28%. A starting capital of $100,000 at inception on 1/2/2009 would have grown to $418,511 which includes $191,016 cash and excludes $7,763 spent on fees and slippage. |
 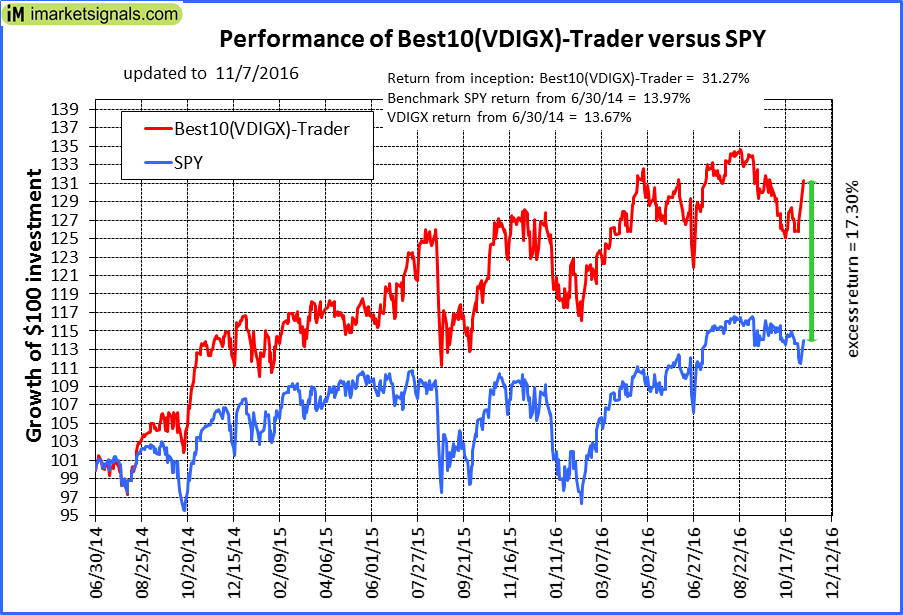 |
iM-Best10(VDIGX)-Trader: The model’s out of sample performance YTD is 4.1%, and for the last 12 months is 3.6%. Over the same period the benchmark SPY performance was 6.2% and 3.7% respectively. Since inception, on 7/1/2014, the model gained 31.27% while the benchmark SPY gained 13.97% and the ETF VDIGX gained 13.67% over the same period. Over the previous week the market value of iM-Best10(VDIGX) gained 4.27% at a time when SPY gained 0.28%. A starting capital of $100,000 at inception on 7/1/2014 would have grown to $131,268 which includes -$44 cash and excludes $1,408 spent on fees and slippage. |
 |
iM-Best2 MC-Score ETF System: The model’s out of sample performance from inception is -4.1%. The benchmark SPY performance over the same period is 2.3%. Over the previous week the market value of iM-BESTOGA-3 gained -0.28% at a time when SPY gained 0.28%. A starting capital of $100,000 at inception on 2/3/2014 would have grown to $43 which includes $103 cash and excludes Gain to date spent on fees and slippage. |
 |
iM-BESTOGA-3: The model’s out of sample performance YTD is 13.4%, and for the last 12 months is 18.0%. Over the same period the benchmark SPY performance was 6.2% and 3.7% respectively. Over the previous week the market value of iM-BESTOGA-3 gained 0.24% at a time when SPY gained 0.28%. A starting capital of $100,000 at inception on 2/3/2014 would have grown to $208,396 which includes $20,041 cash and excludes $767 spent on fees and slippage. |
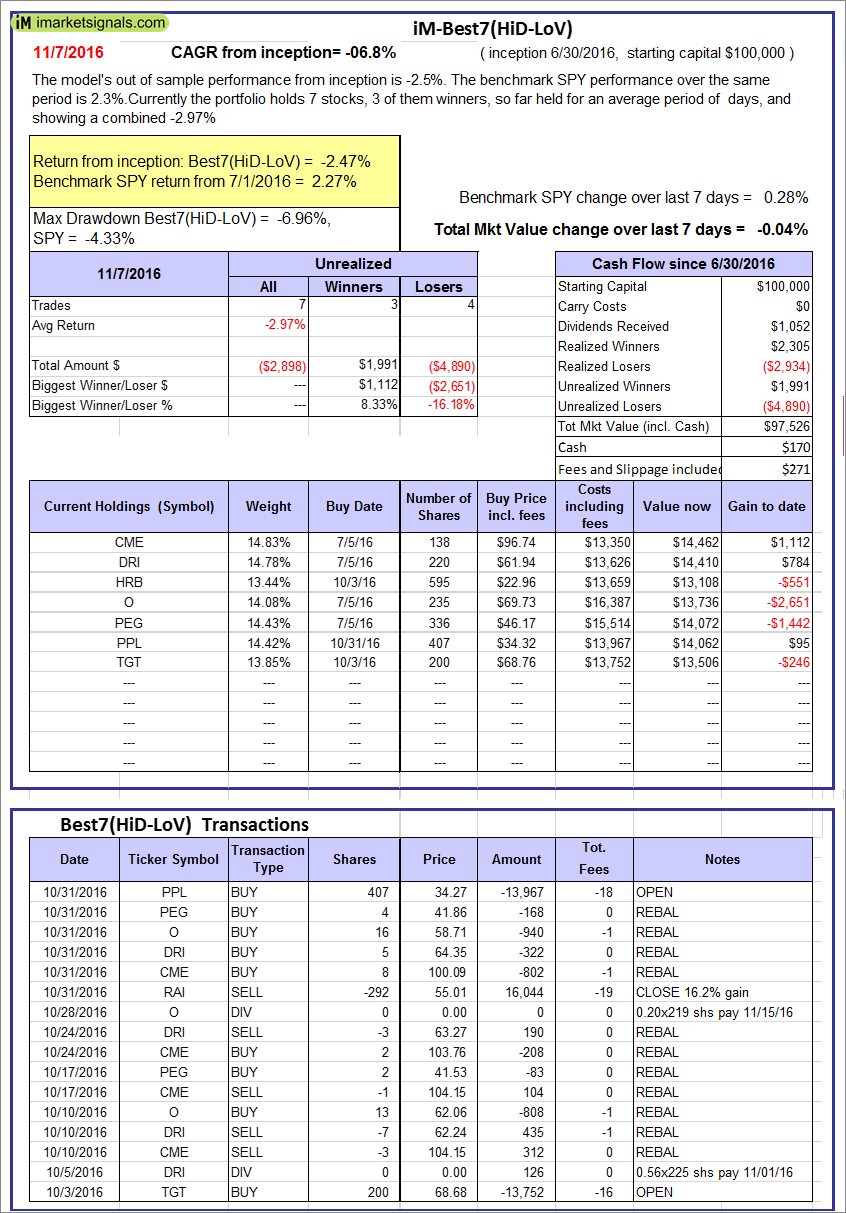 |
iM-Best7(HiD-LoV): The model’s out of sample performance from inception is -2.5%. The benchmark SPY performance over the same period is 2.3%. Over the previous week the market value of iM-BESTOGA-3 gained -0.04% at a time when SPY gained 0.28%. A starting capital of $100,000 at inception on 2/3/2014 would have grown to $97,526 which includes $170 cash and excludes $271 spent on fees and slippage. |
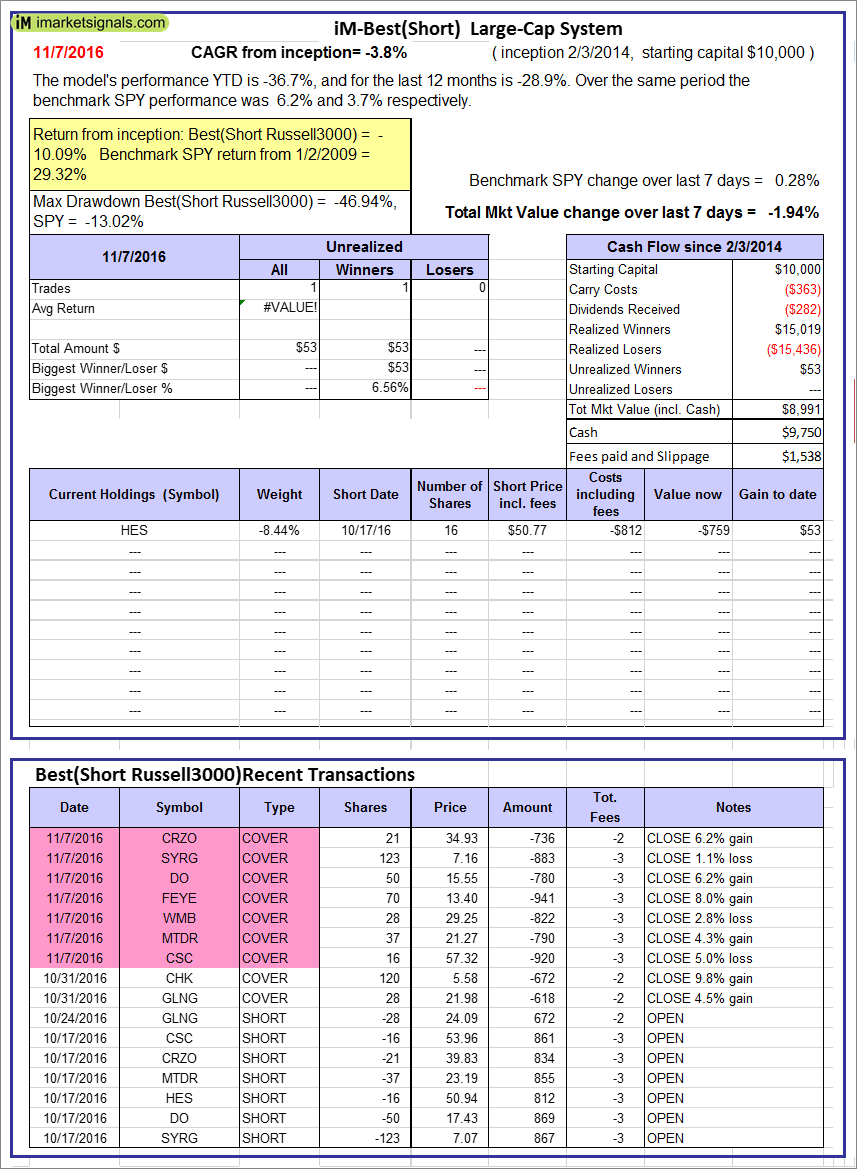 |
iM-Best10(Short Russell3000): The model’s performance YTD is -36.7%, and for the last 12 months is -28.9%. Over the same period the benchmark SPY performance was 6.2% and 3.7% respectively. Over the previous week the market value of iM-Best10(Short Russell3000) gained -1.94% at a time when SPY gained 0.28%. Over the period 2/3/2014 to 11/7/2016 the starting capital of $100,000 would have grown to $8,991 which includes $9,750 cash and excludes $1,538 spent on fees and slippage. |
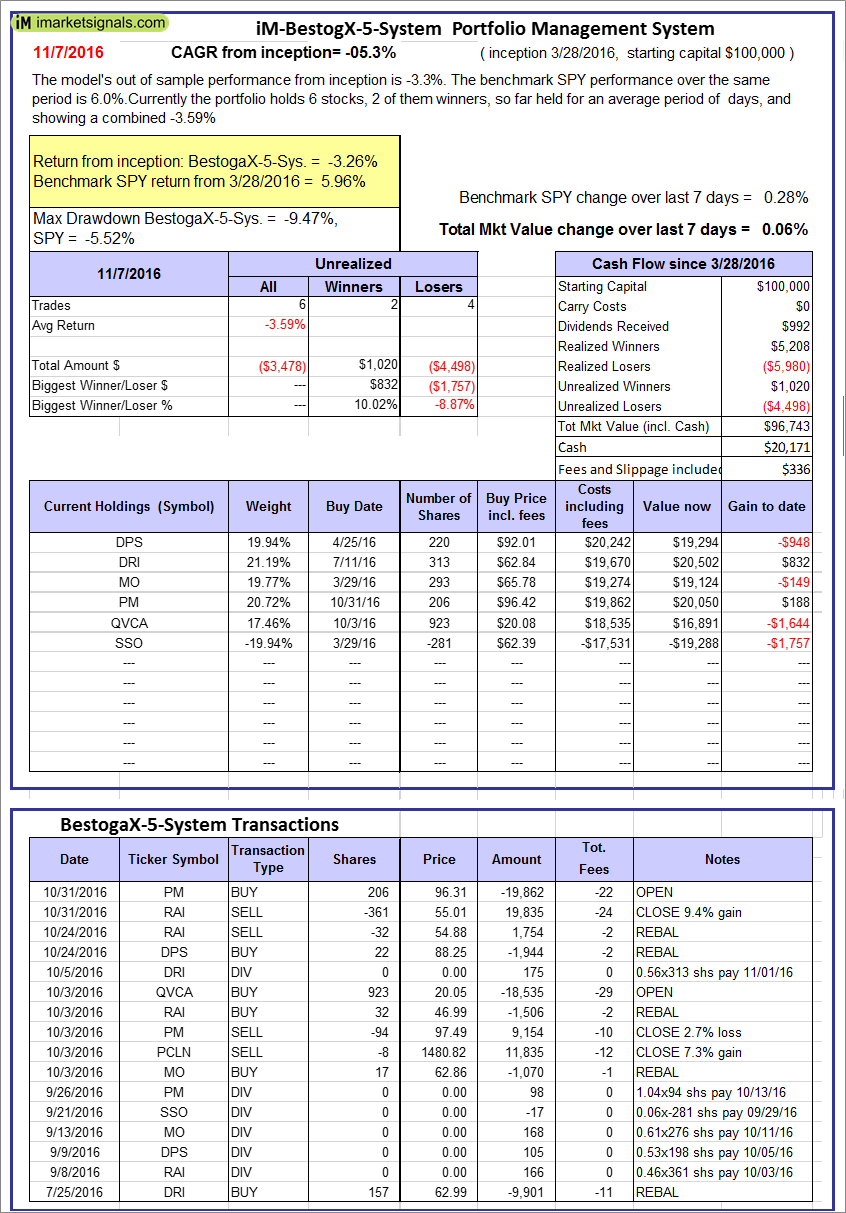 |
iM-BestogaX5-System: The model’s out of sample performance from inception is -3.3%. The benchmark SPY performance over the same period is 6.0%. Over the previous week the market value of iM-Best8(S&P 500)Tax-Eff. gained 0.06% at a time when SPY gained 0.28%. A starting capital of $100,000 at inception on 1/2/2009 would have grown to $96,743 which includes $20,171 cash and excludes $336 spent on fees and slippage. |
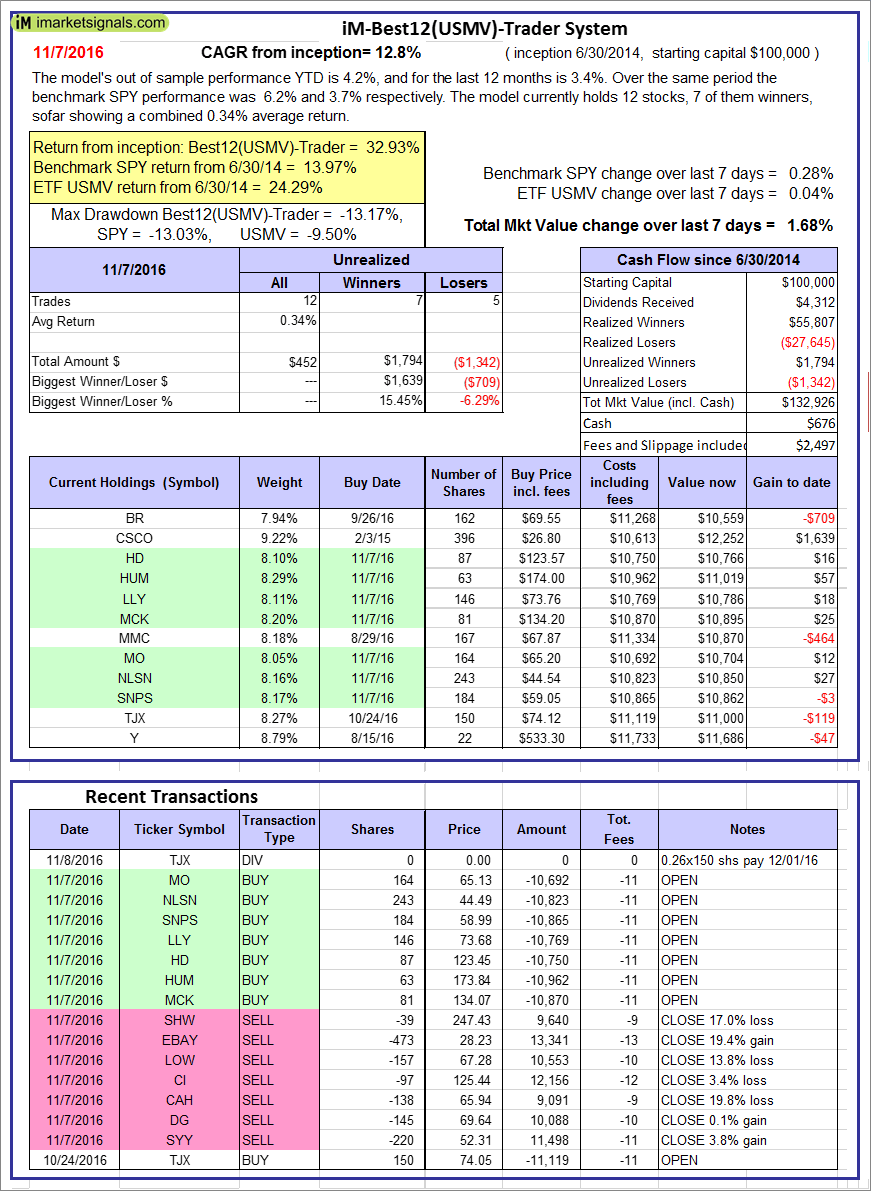 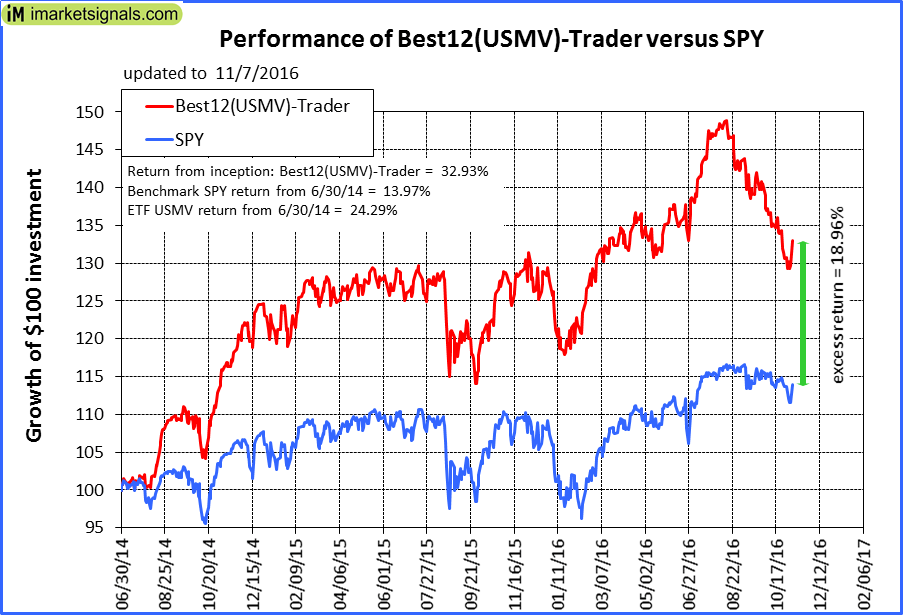 |
iM-Best12(USMV)-Trader: The model’s out of sample performance YTD is 4.2%, and for the last 12 months is 3.4%. Over the same period the benchmark SPY performance was 6.2% and 3.7% respectively. Since inception, on 7/1/2014, the model gained 32.93% while the benchmark SPY gained 13.97% and the ETF USMV gained 24.29% over the same period. Over the previous week the market value of iM-Best12(USMV)-Trader gained 1.68% at a time when SPY gained 0.28%. A starting capital of $100,000 at inception on 7/1/2014 would have grown to $132,926 which includes $676 cash and excludes $2,497 spent on fees and slippage. |
 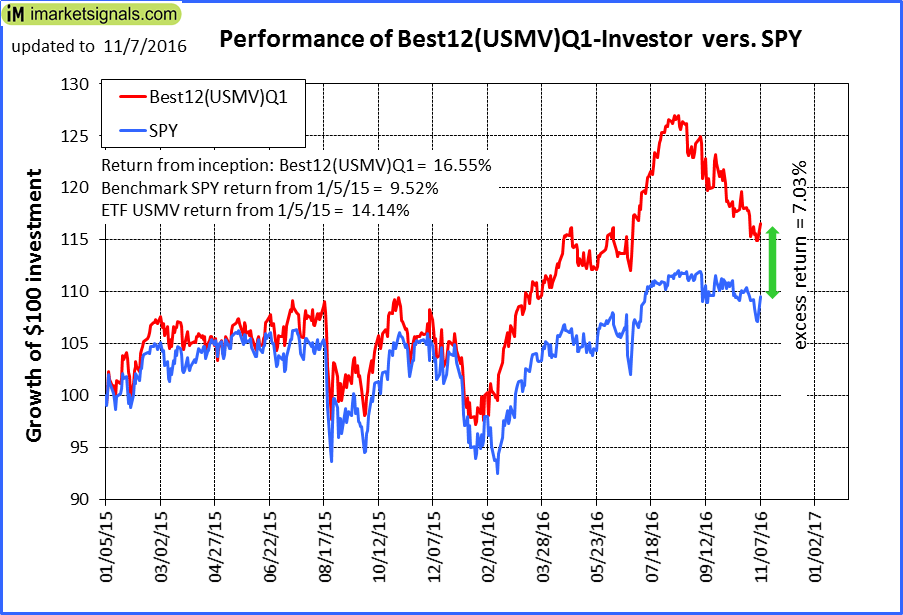 |
iM-Best12(USMV)Q1-Investor: The model’s out of sample performance YTD is 11.7%, and for the last 12 months is 8.8%. Over the same period the benchmark SPY performance was 6.2% and 3.7% respectively. Since inception, on 1/5/2015, the model gained 16.55% while the benchmark SPY gained 9.52% and the ETF USMV gained 14.14% over the same period. Over the previous week the market value of iM-Best12(USMV)Q1 gained 0.24% at a time when SPY gained 0.28%. A starting capital of $100,000 at inception on 1/5/2015 would have grown to $116,551 which includes -$439 cash and excludes $579 spent on fees and slippage. |
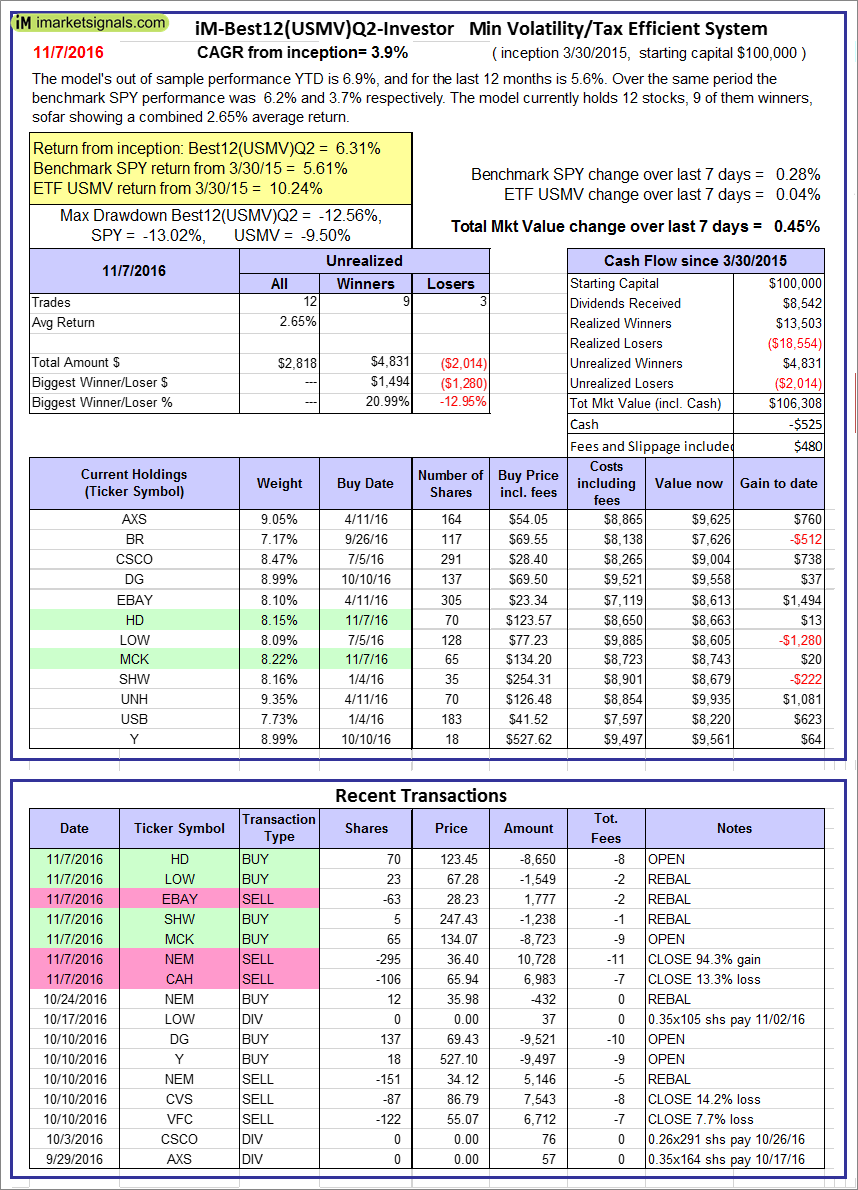 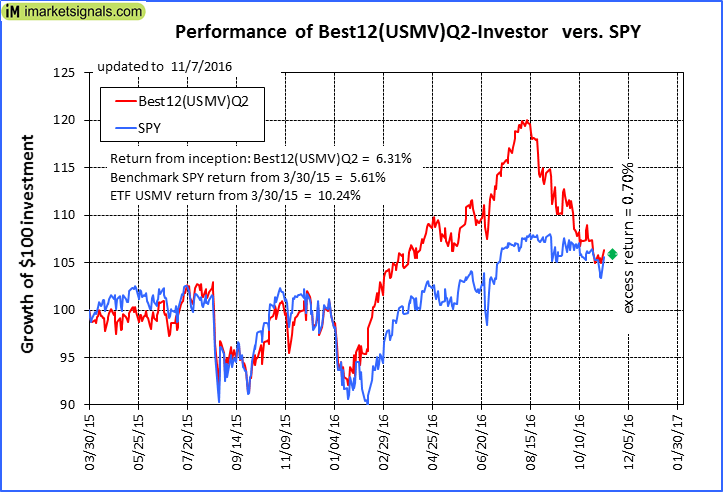 |
iM-Best12(USMV)Q2-Investor: The model’s out of sample performance YTD is 6.9%, and for the last 12 months is 5.6%. Over the same period the benchmark SPY performance was 6.2% and 3.7% respectively. Since inception, on 3/31/2015, the model gained 6.31% while the benchmark SPY gained 5.61% and the ETF USMV gained 10.24% over the same period. Over the previous week the market value of iM-Best12(USMV)Q2 gained 0.45% at a time when SPY gained 0.28%. A starting capital of $100,000 at inception on 3/31/2015 would have grown to $106,308 which includes -$525 cash and excludes $480 spent on fees and slippage. |
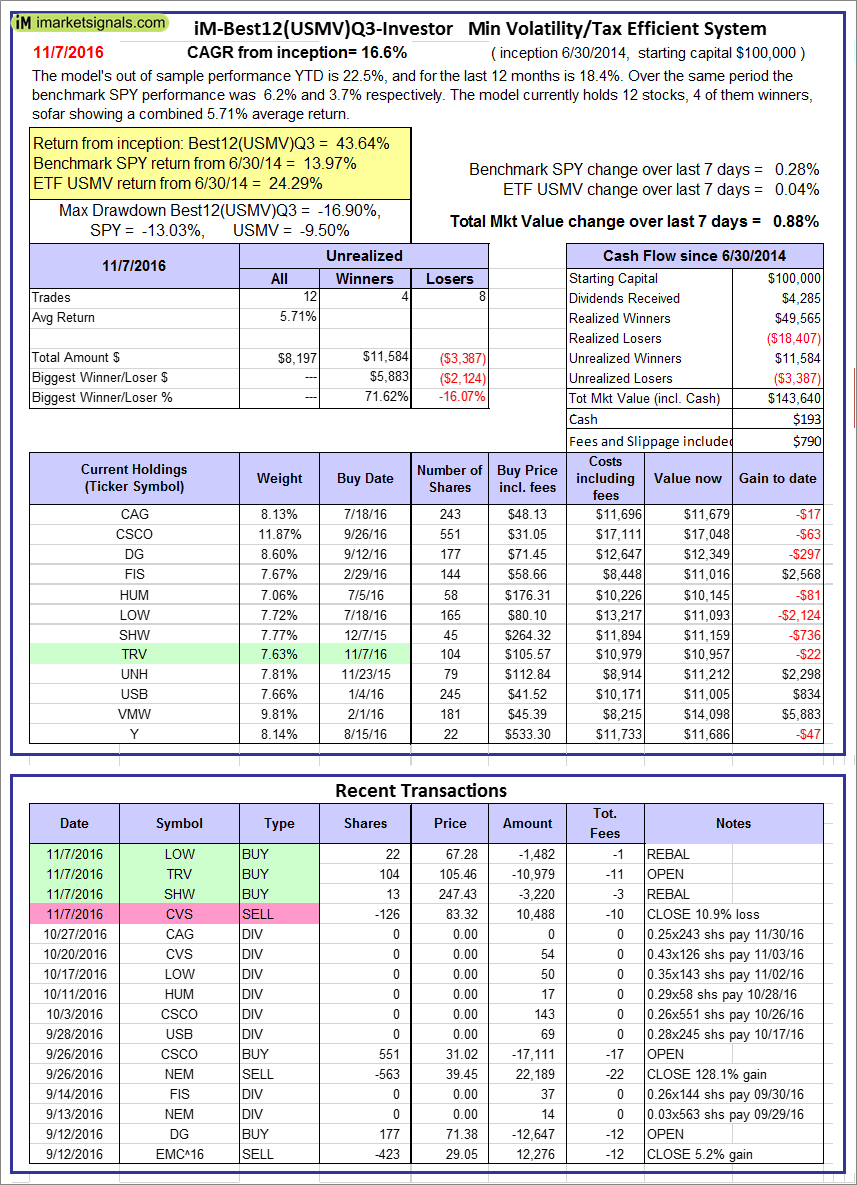 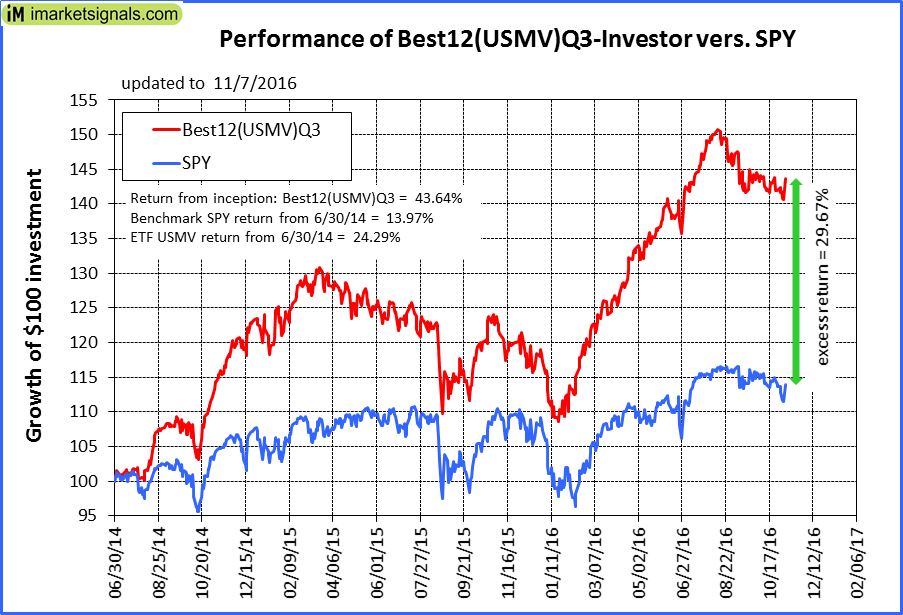 |
iM-Best12(USMV)Q3-Investor: The model’s out of sample performance YTD is 22.5%, and for the last 12 months is 18.4%. Over the same period the benchmark SPY performance was 6.2% and 3.7% respectively. Since inception, on 7/1/2014, the model gained 43.64% while the benchmark SPY gained 13.97% and the ETF USMV gained 24.29% over the same period. Over the previous week the market value of iM-Best12(USMV)Q3 gained 0.88% at a time when SPY gained 0.28%. A starting capital of $100,000 at inception on 7/1/2014 would have grown to $143,640 which includes $193 cash and excludes $790 spent on fees and slippage. |
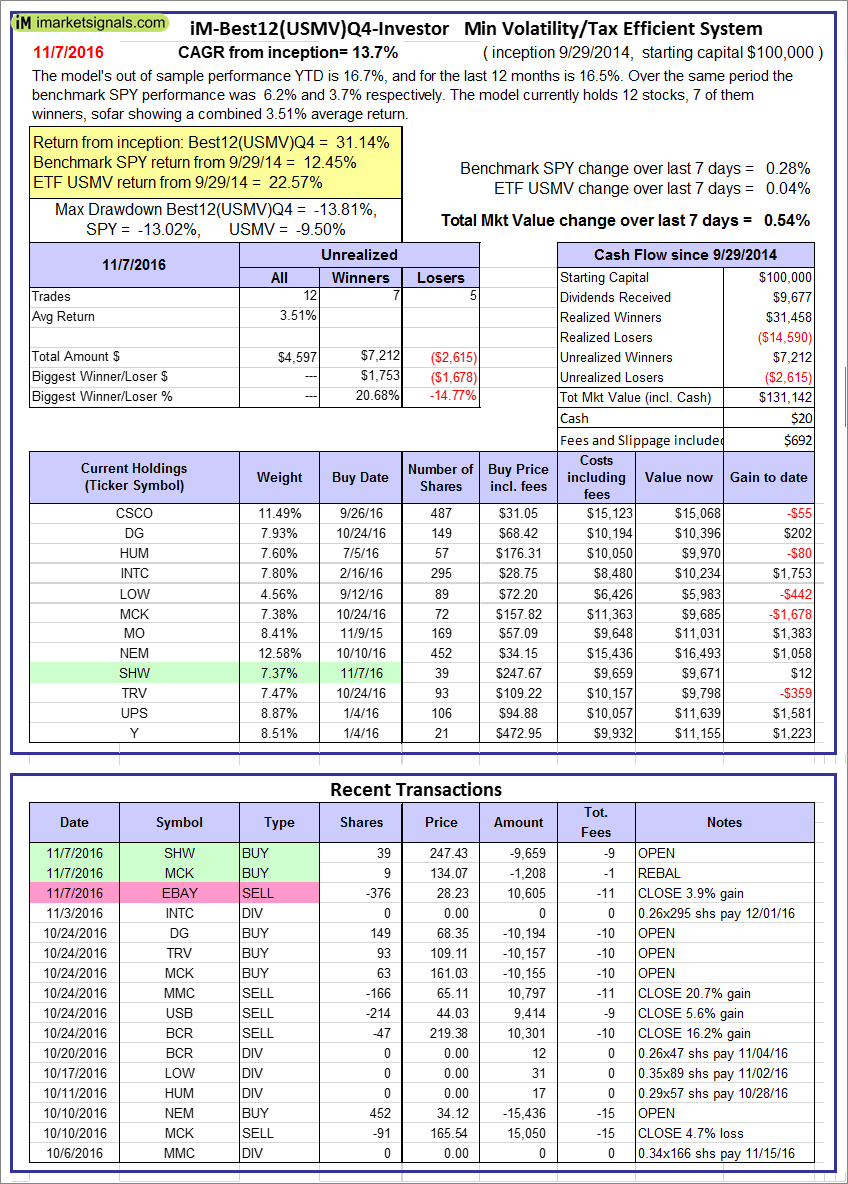 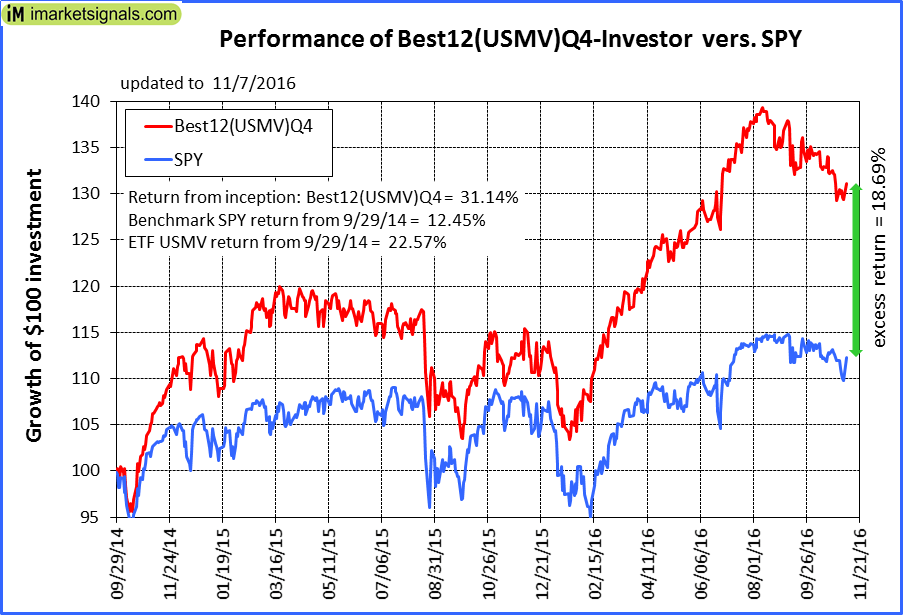 |
iM-Best12(USMV)Q4-Investor: Since inception, on 9/30/2014, the model gained 31.14% while the benchmark SPY gained 12.45% and the ETF USMV gained 22.57% over the same period. Over the previous week the market value of iM-Best12(USMV)Q4 gained 0.54% at a time when SPY gained 0.28%. A starting capital of $100,000 at inception on 9/30/2014 would have grown to $131,142 which includes $20 cash and excludes $692 spent on fees and slippage. |
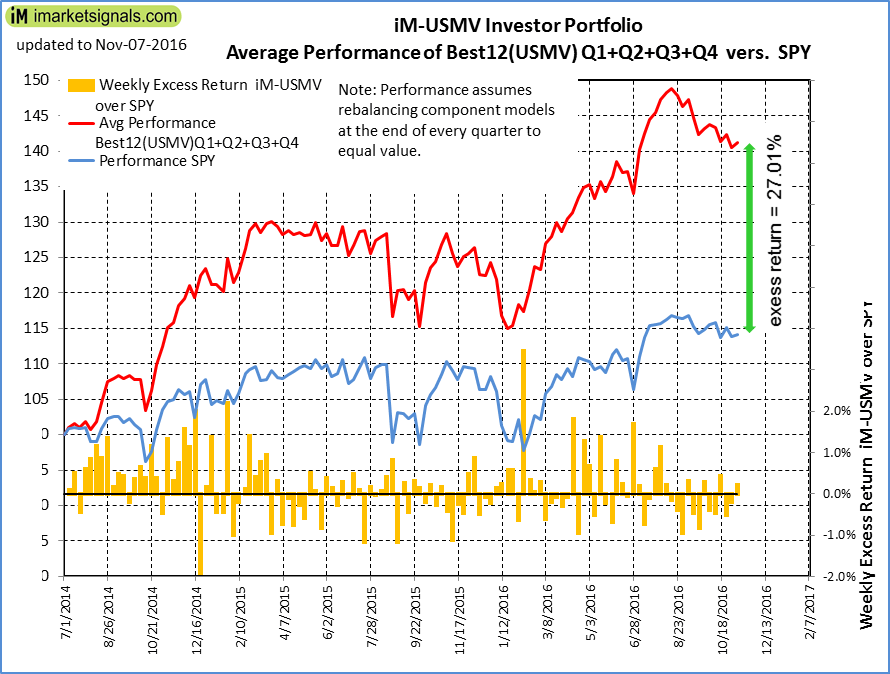 |
Average Performance of iM-Best12(USMV)Q1+Q2+Q3+Q4-Investor resulted in an excess return of 27.01% over SPY. (see iM-USMV Investor Portfolio) |
 |
iM-Best(Short): The model’s out of sample performance YTD is -7.2%, and for the last 12 months is -3.7%. Over the same period the benchmark SPY performance was 6.2% and 3.7% respectively. Over the previous week the market value of iM-Best(Short) gained -0.19% at a time when SPY gained 0.28%. Over the period 1/2/2009 to 11/7/2016 the starting capital of $100,000 would have grown to $97,142 which includes $137,208 cash and excludes $20,585 spent on fees and slippage. |

Blog Archives
iM-Best Reports – 11/7/2016
Posted in pmp SPY-SH
iM-Best Reports – 9/12/2016
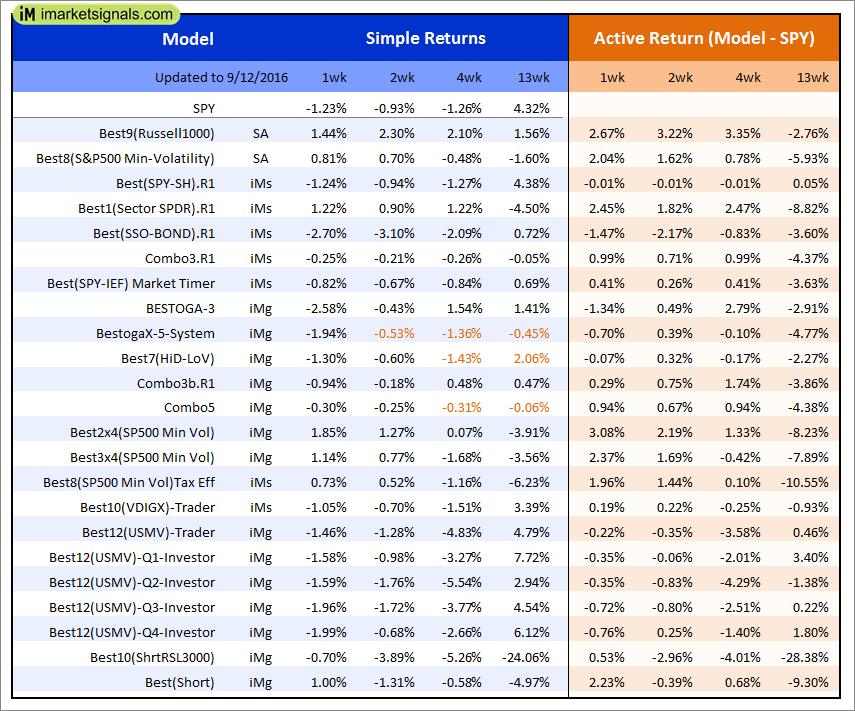 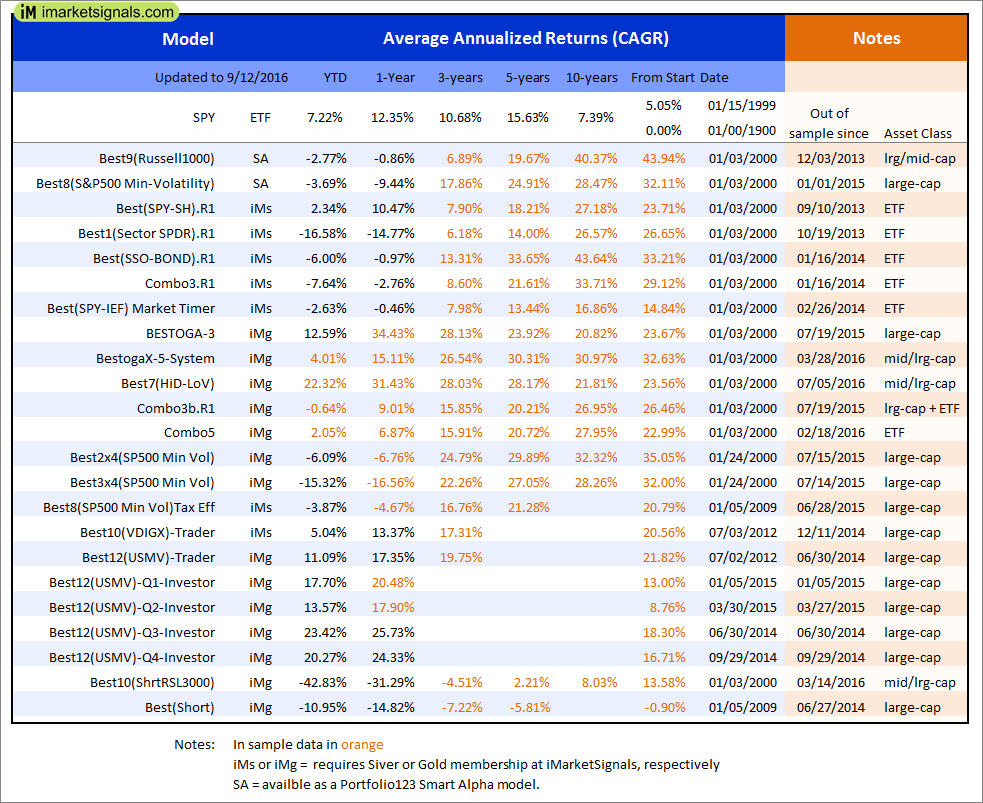 |
Out of sample performance summary of our models for the past 1, 2, 4 and 13 week periods. The active active return indicates how the models over- or underperformed the benchmark ETF SPY. Also the YTD, and the 1-, 3-, 5- and 10-year annualized returns are shown in the second table |
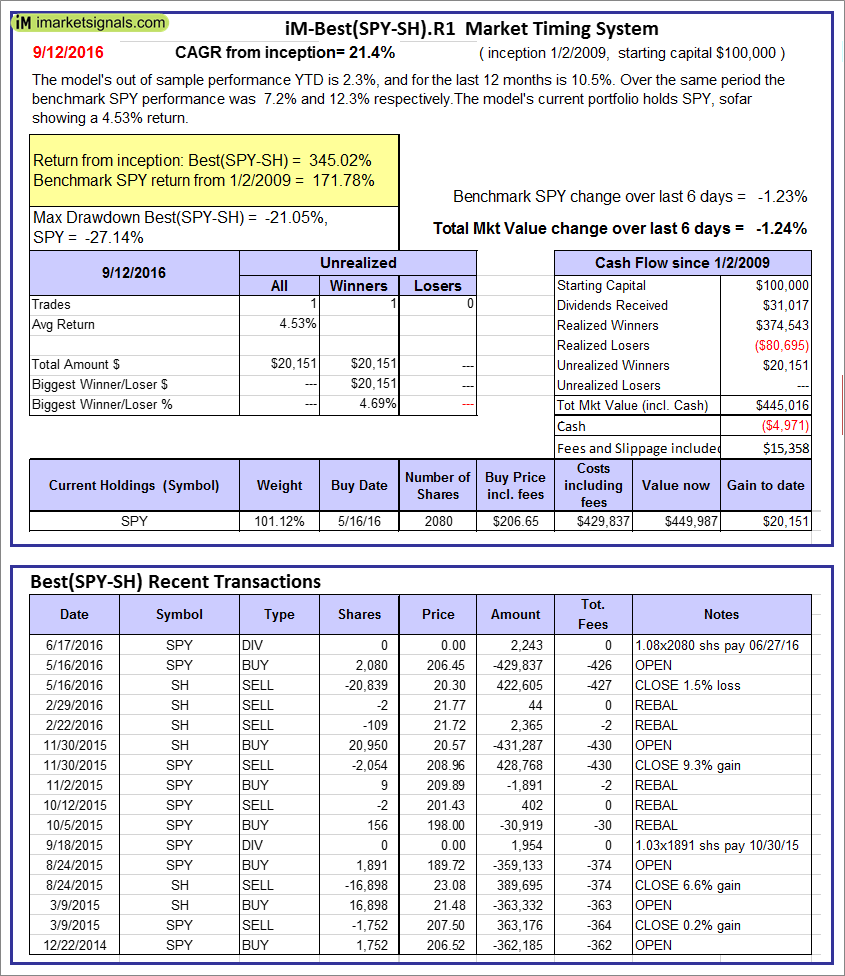 |
iM-Best(SPY-SH).R1: The model’s out of sample performance YTD is 2.3%, and for the last 12 months is 10.5%. Over the same period the benchmark SPY performance was 7.2% and 12.3% respectively. Over the previous week the market value of Best(SPY-SH) gained -1.24% at a time when SPY gained -1.23%. A starting capital of $100,000 at inception on 1/2/2009 would have grown to $445,016 which includes -$4,971 cash and excludes $15,358 spent on fees and slippage. |
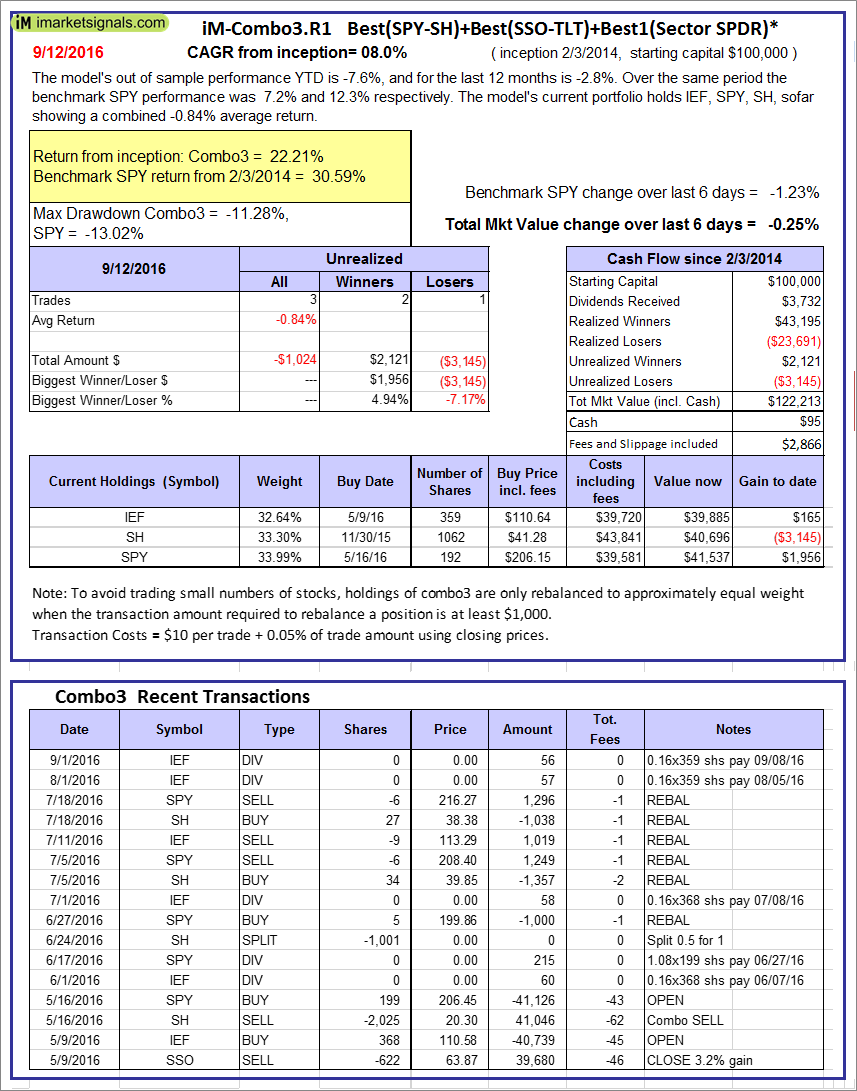 |
iM-Combo3.R1: The model’s out of sample performance YTD is -7.6%, and for the last 12 months is -2.8%. Over the same period the benchmark SPY performance was 7.2% and 12.3% respectively. Over the previous week the market value of iM-Combo3.R1 gained -0.25% at a time when SPY gained -1.23%. A starting capital of $100,000 at inception on 2/3/2014 would have grown to $122,213 which includes $95 cash and excludes $2,866 spent on fees and slippage. |
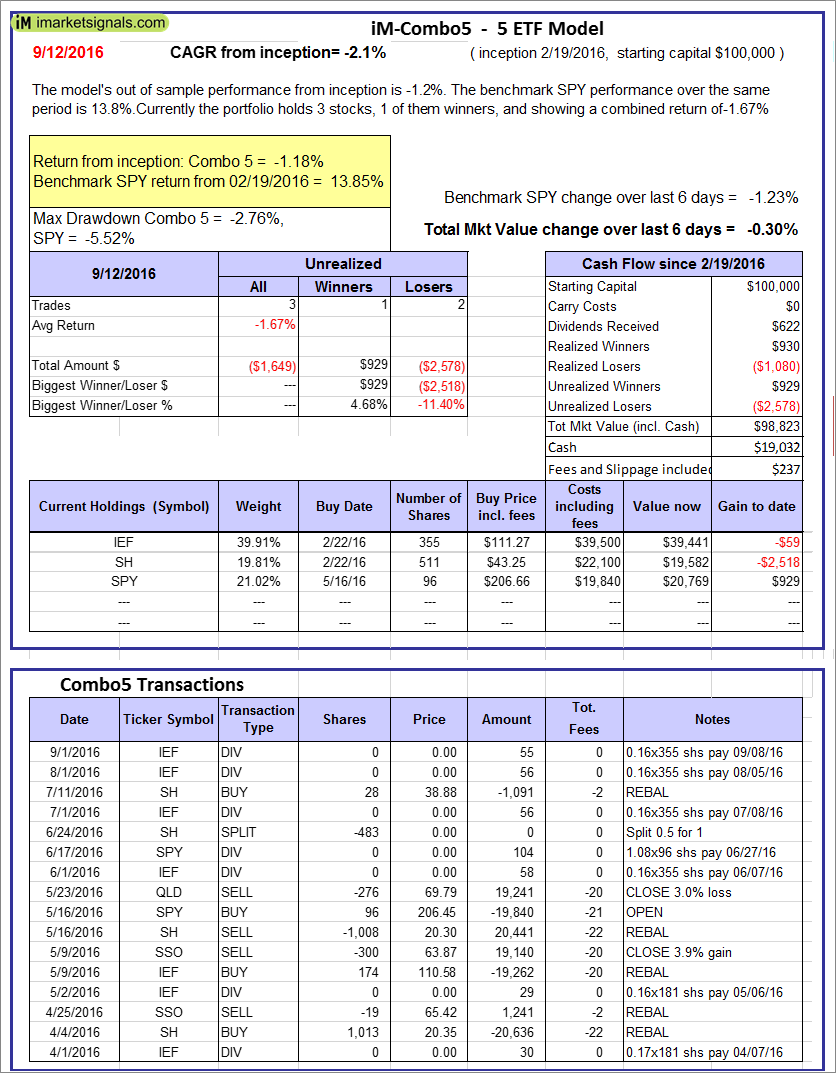 |
iM-Combo5: The model’s out of sample performance from inception is -1.2%. The benchmark SPY performance over the same period is 13.8%. Over the previous week the market value of iM-Combo5 gained -0.30% at a time when SPY gained -1.23%. A starting capital of $100,000 at inception on 2/22/2016 would have grown to $98,823 which includes $19,032 cash and excludes $237 spent on fees and slippage. |
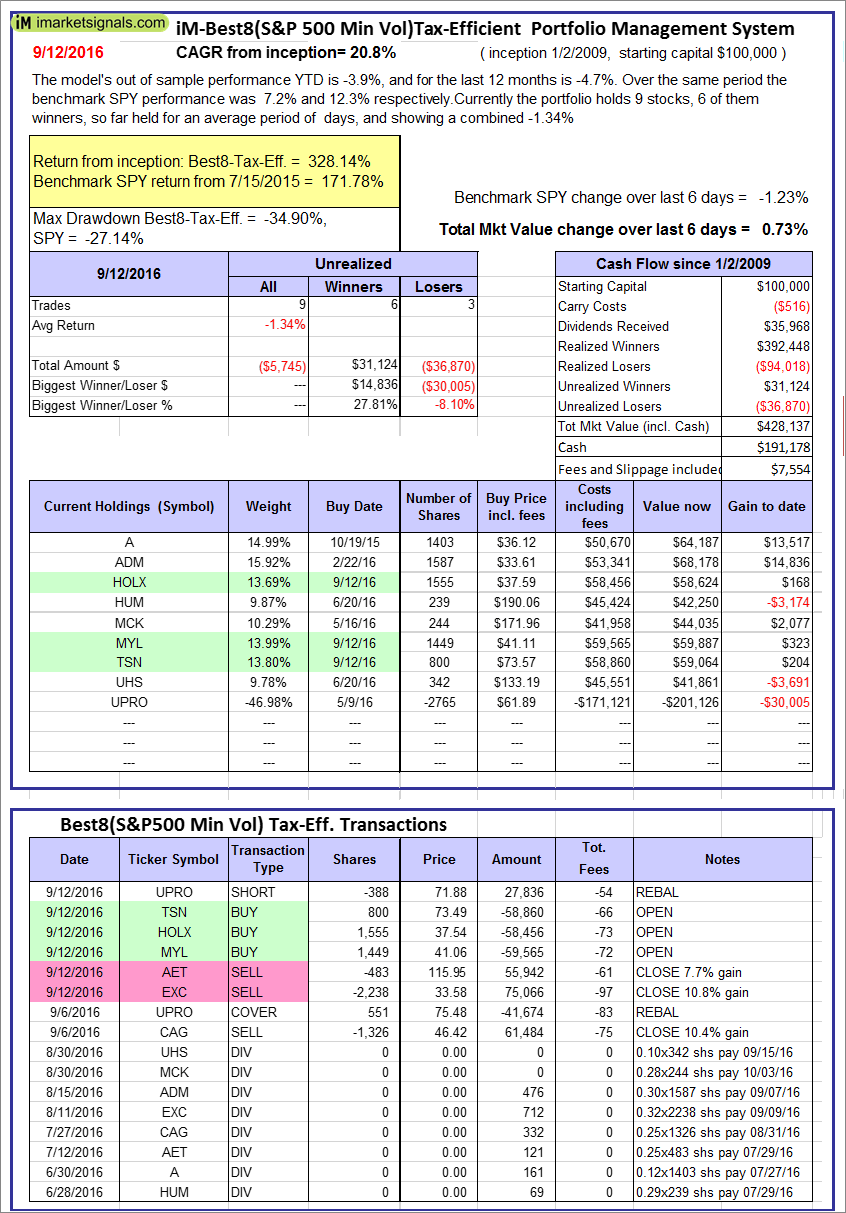 |
The iM-Best8(S&P500 Min Vol)Tax-Efficient The model’s out of sample performance YTD is -3.9%, and for the last 12 months is -4.7%. Over the same period the benchmark SPY performance was 7.2% and 12.3% respectively. Over the previous week the market value of iM-Best8(S&P 500)Tax-Eff. gained 0.73% at a time when SPY gained -1.23%. A starting capital of $100,000 at inception on 1/2/2009 would have grown to $428,137 which includes $191,178 cash and excludes $7,554 spent on fees and slippage. |
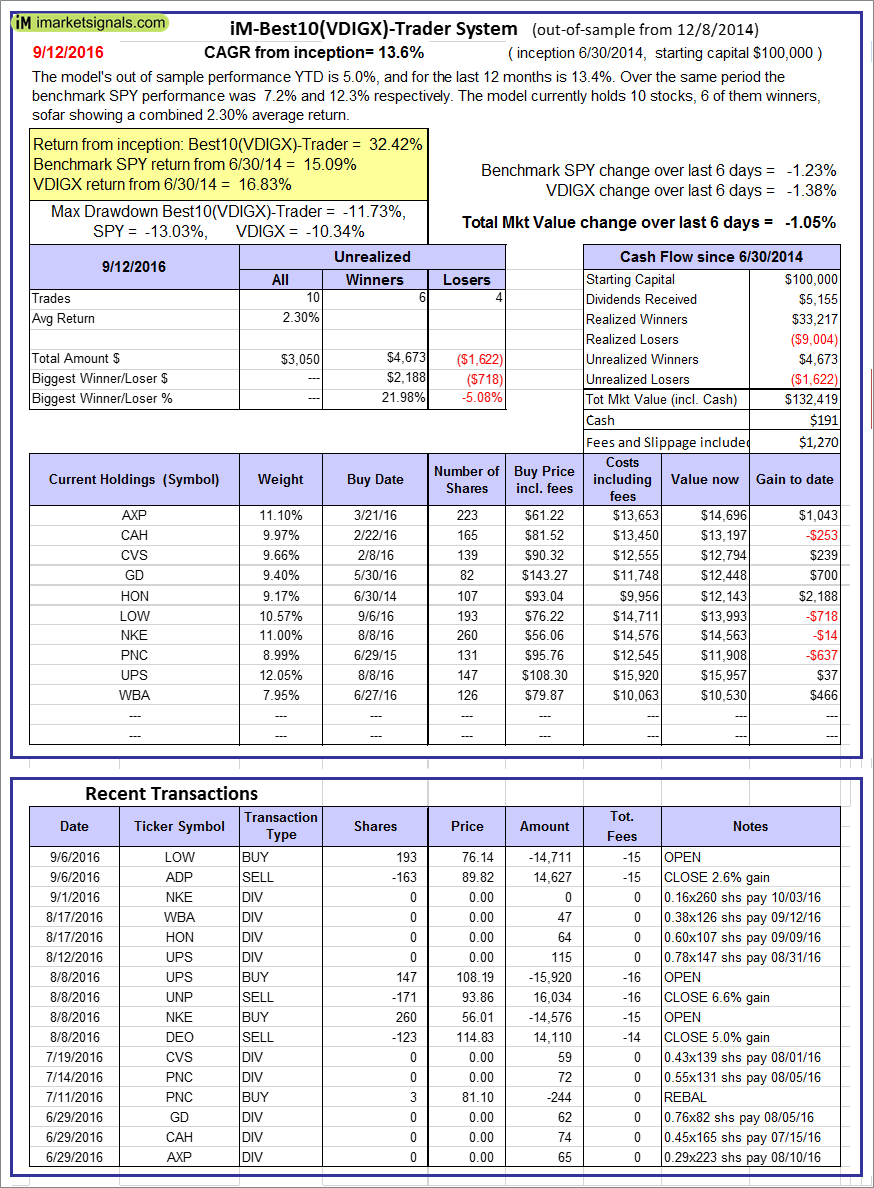 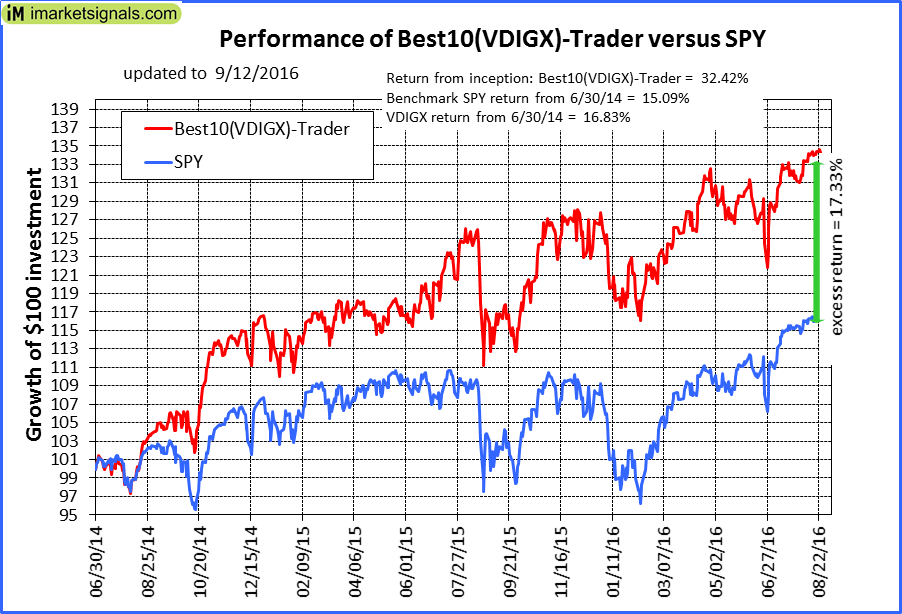 |
iM-Best10(VDIGX)-Trader: The model’s out of sample performance YTD is 5.0%, and for the last 12 months is 13.4%. Over the same period the benchmark SPY performance was 7.2% and 12.3% respectively. Since inception, on 7/1/2014, the model gained 32.42% while the benchmark SPY gained 15.09% and the ETF VDIGX gained 16.83% over the same period. Over the previous week the market value of iM-Best10(VDIGX) gained -1.05% at a time when SPY gained -1.23%. A starting capital of $100,000 at inception on 7/1/2014 would have grown to $132,419 which includes $191 cash and excludes $1,270 spent on fees and slippage. |
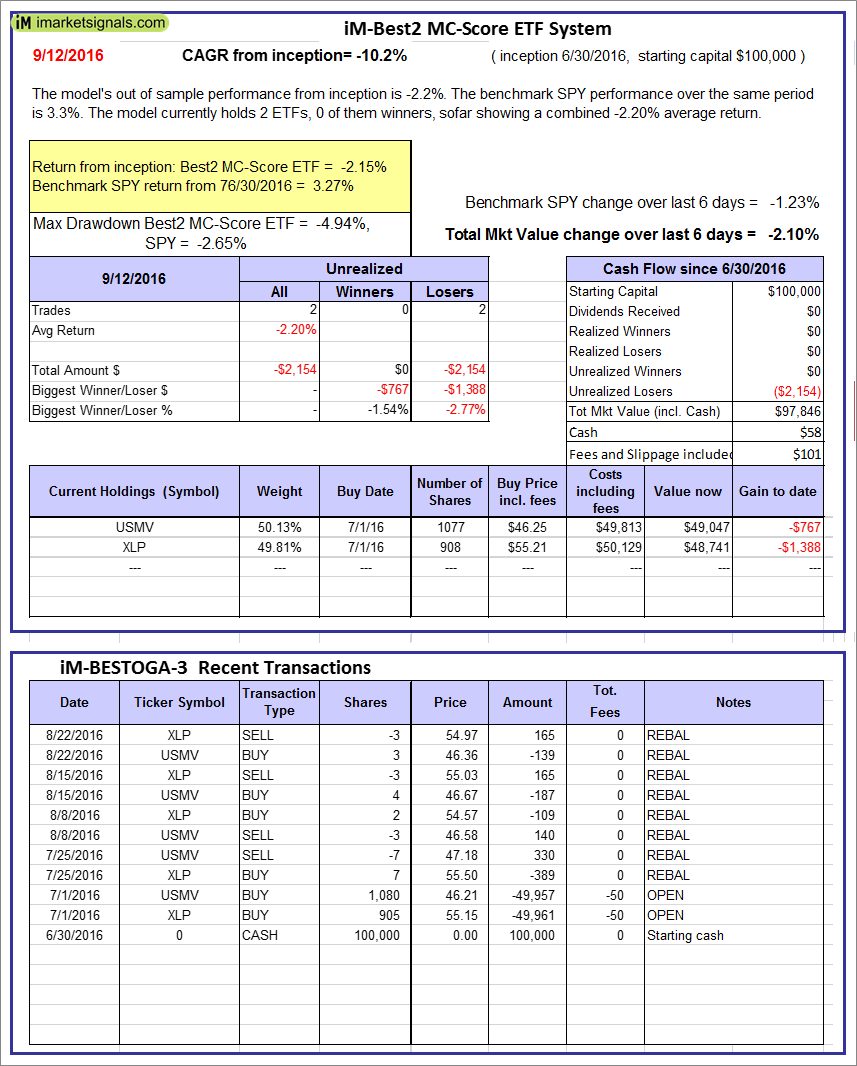 |
iM-Best2 MC-Score ETF System: The model’s out of sample performance from inception is -2.2%. The benchmark SPY performance over the same period is 3.3%. Over the previous week the market value of iM-BESTOGA-3 gained -2.10% at a time when SPY gained -1.23%. A starting capital of $100,000 at inception on 2/3/2014 would have grown to $58 which includes $101 cash and excludes Gain to date spent on fees and slippage. |
 |
iM-BESTOGA-3: The model’s out of sample performance YTD is 12.6%, and for the last 12 months is 34.4%. Over the same period the benchmark SPY performance was 7.2% and 12.3% respectively. Over the previous week the market value of iM-BESTOGA-3 gained -2.58% at a time when SPY gained -1.23%. A starting capital of $100,000 at inception on 2/3/2014 would have grown to $206,880 which includes $18,677 cash and excludes $767 spent on fees and slippage. |
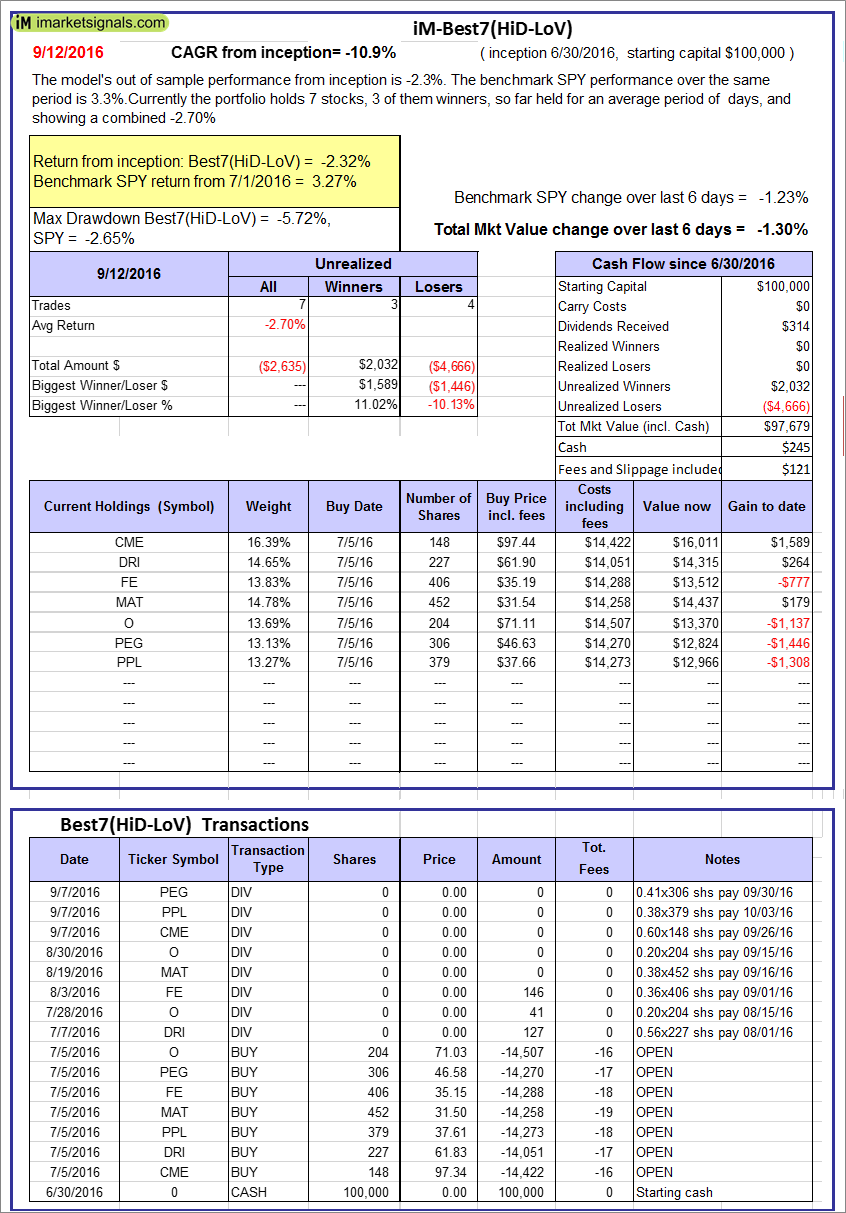 |
iM-Best7(HiD-LoV): The model’s out of sample performance from inception is -2.3%. The benchmark SPY performance over the same period is 3.3%. Over the previous week the market value of iM-BESTOGA-3 gained -1.30% at a time when SPY gained -1.23%. A starting capital of $100,000 at inception on 2/3/2014 would have grown to $97,679 which includes $245 cash and excludes $121 spent on fees and slippage. |
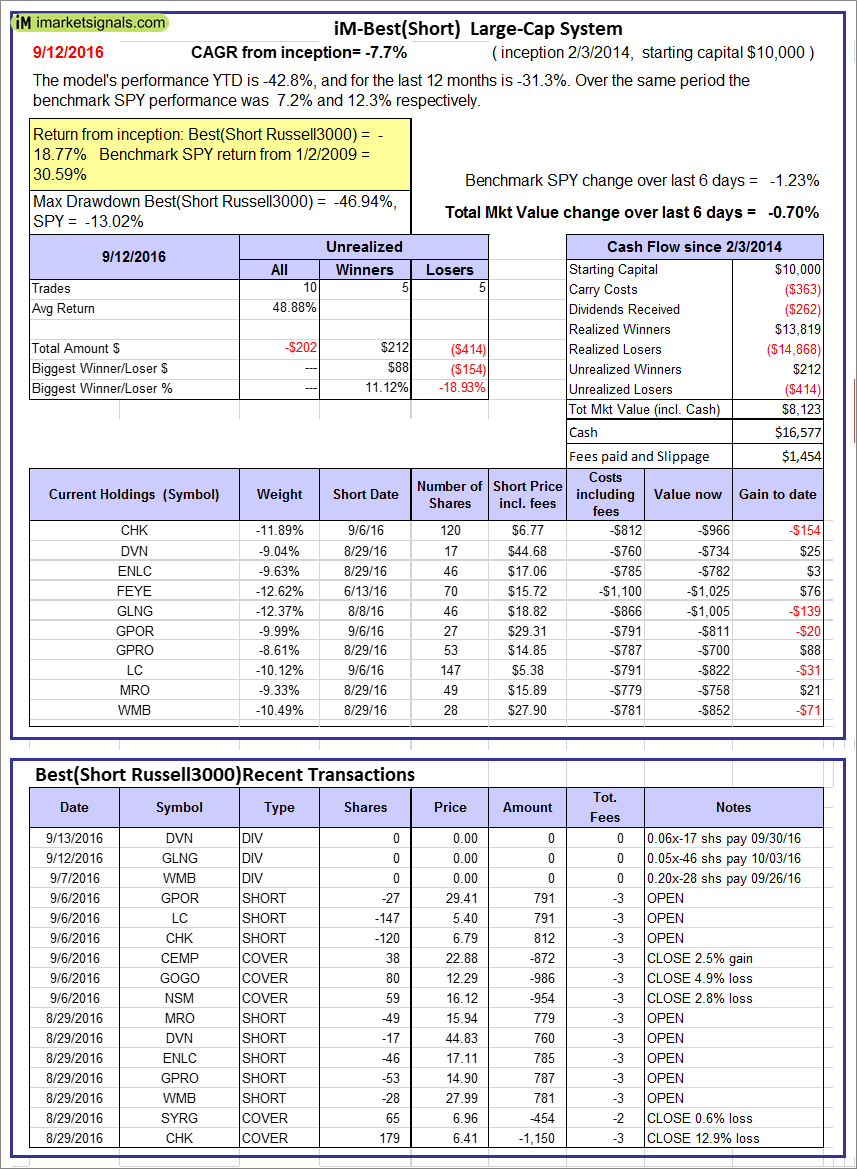 |
iM-Best10(Short Russell3000): The model’s performance YTD is -42.8%, and for the last 12 months is -31.3%. Over the same period the benchmark SPY performance was 7.2% and 12.3% respectively. Over the previous week the market value of iM-Best10(Short Russell3000) gained -0.70% at a time when SPY gained -1.23%. Over the period 2/3/2014 to 9/12/2016 the starting capital of $100,000 would have grown to $8,123 which includes $16,577 cash and excludes $1,454 spent on fees and slippage. |
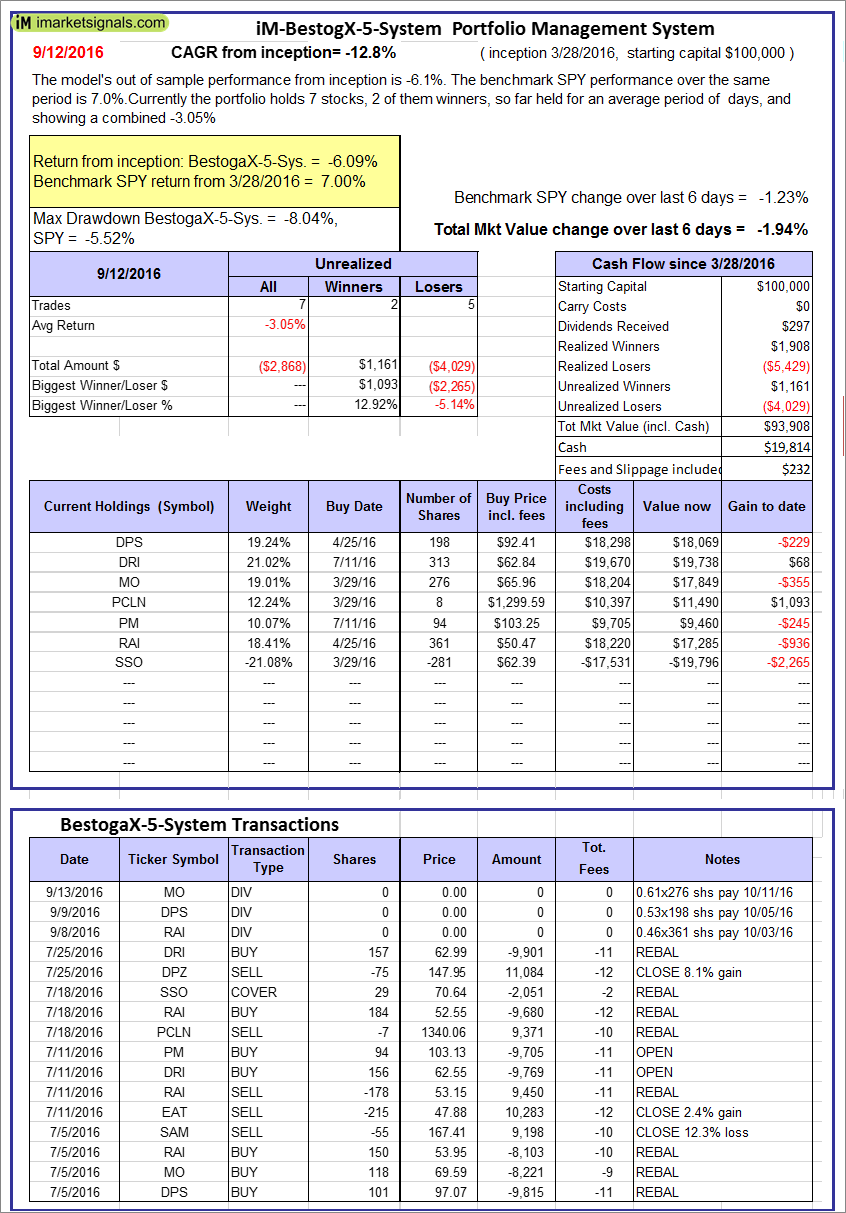 |
iM-BestogaX5-System: The model’s out of sample performance from inception is -6.1%. The benchmark SPY performance over the same period is 7.0%. Over the previous week the market value of iM-Best8(S&P 500)Tax-Eff. gained -1.94% at a time when SPY gained -1.23%. A starting capital of $100,000 at inception on 1/2/2009 would have grown to $93,908 which includes $19,814 cash and excludes $232 spent on fees and slippage. |
 |
iM-Best3x4(S&P 500 Min Vol): The model’s out of sample performance YTD is -15.3%, and for the last 12 months is -16.6%. Over the same period the benchmark SPY performance was 7.2% and 12.3% respectively. Over the previous week the market value of iM-Best3x4 gained 1.14% at a time when SPY gained -1.23%. A starting capital of $100,000 at inception on 7/15/2015 would have grown to $87,008 which includes $1,100 cash and excludes $1,560 spent on fees and slippage. |
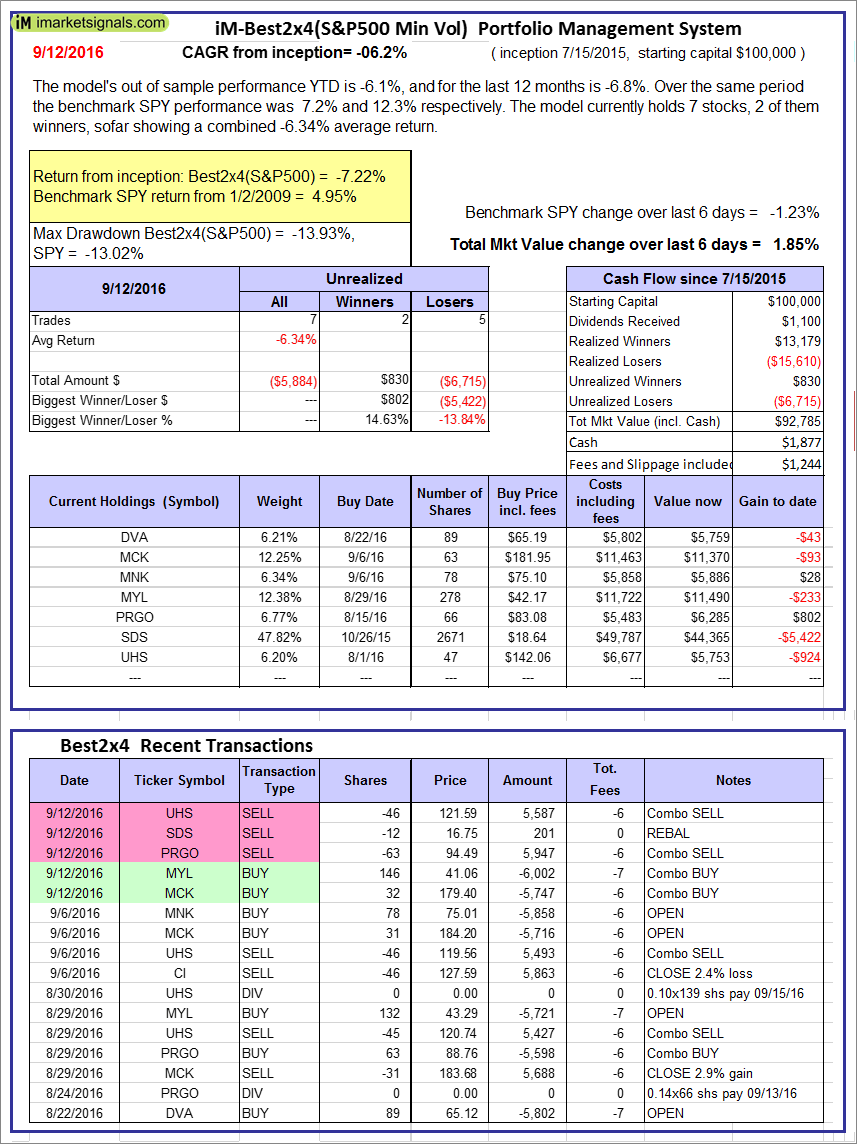 |
iM-Best2x4(S&P 500 Min Vol): The model’s out of sample performance YTD is -6.1%, and for the last 12 months is -6.8%. Over the same period the benchmark SPY performance was 7.2% and 12.3% respectively. Over the previous week the market value of iM-Best2x4 gained 1.85% at a time when SPY gained -1.23%. A starting capital of $100,000 at inception on 7/16/2015 would have grown to $92,785 which includes $1,877 cash and excludes $1,244 spent on fees and slippage. |
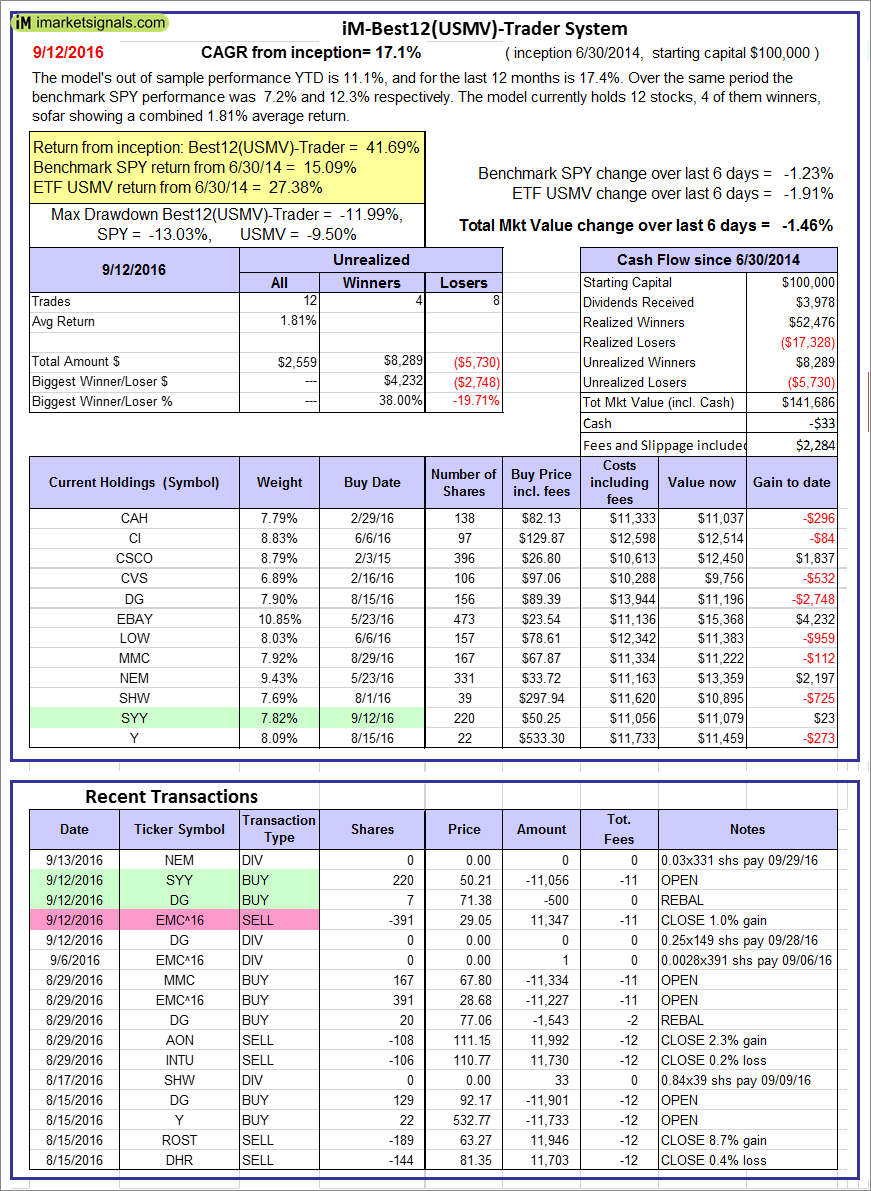 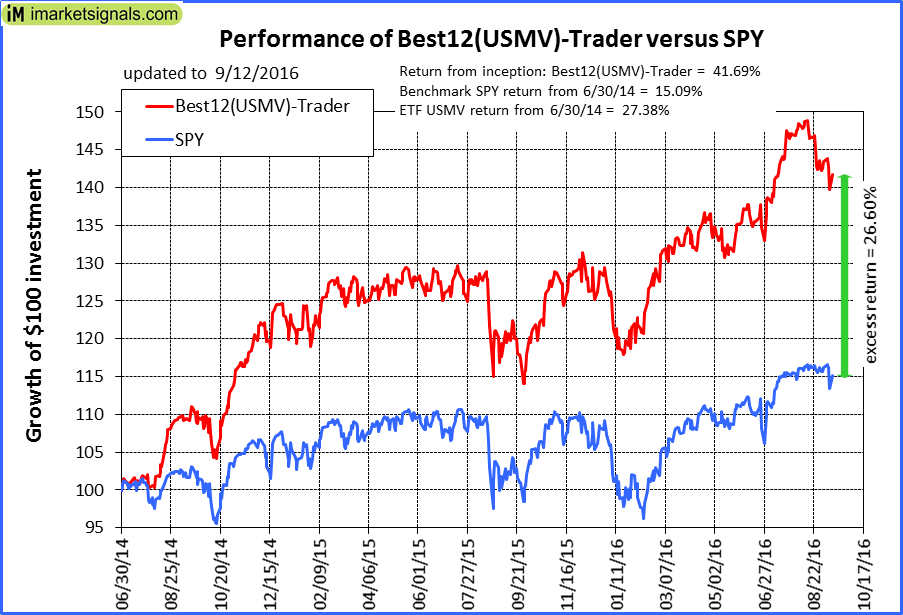 |
iM-Best12(USMV)-Trader: The model’s out of sample performance YTD is 11.1%, and for the last 12 months is 17.4%. Over the same period the benchmark SPY performance was 7.2% and 12.3% respectively. Since inception, on 7/1/2014, the model gained 41.69% while the benchmark SPY gained 15.09% and the ETF USMV gained 27.38% over the same period. Over the previous week the market value of iM-Best12(USMV)-Trader gained -1.46% at a time when SPY gained -1.23%. A starting capital of $100,000 at inception on 7/1/2014 would have grown to $141,686 which includes -$33 cash and excludes $2,284 spent on fees and slippage. |
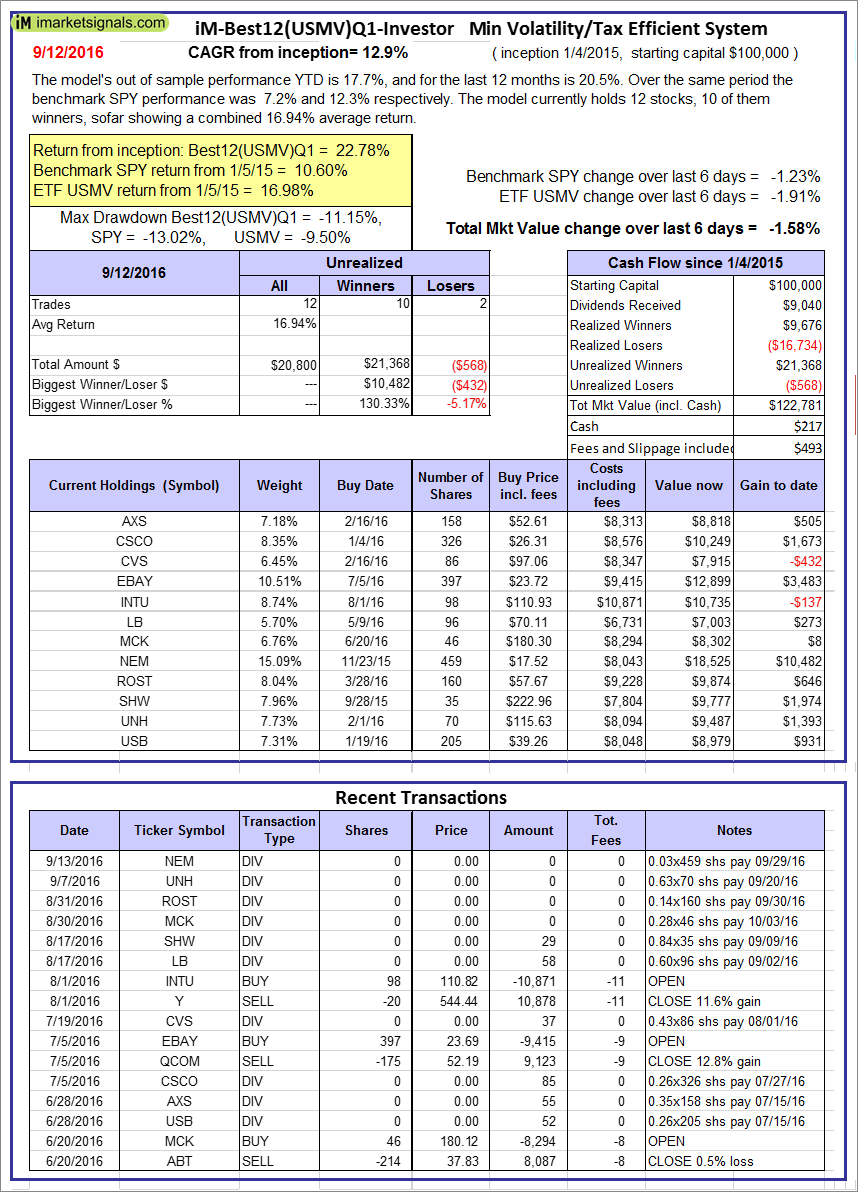 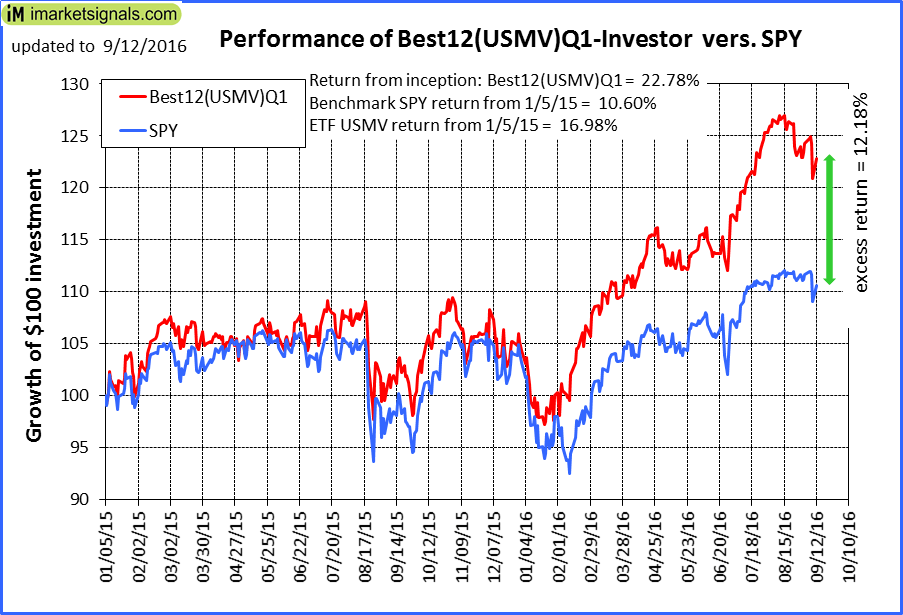 |
iM-Best12(USMV)Q1-Investor: The model’s out of sample performance YTD is 17.7%, and for the last 12 months is 20.5%. Over the same period the benchmark SPY performance was 7.2% and 12.3% respectively. Since inception, on 1/5/2015, the model gained 22.78% while the benchmark SPY gained 10.60% and the ETF USMV gained 16.98% over the same period. Over the previous week the market value of iM-Best12(USMV)Q1 gained -1.58% at a time when SPY gained -1.23%. A starting capital of $100,000 at inception on 1/5/2015 would have grown to $122,781 which includes $217 cash and excludes $493 spent on fees and slippage. |
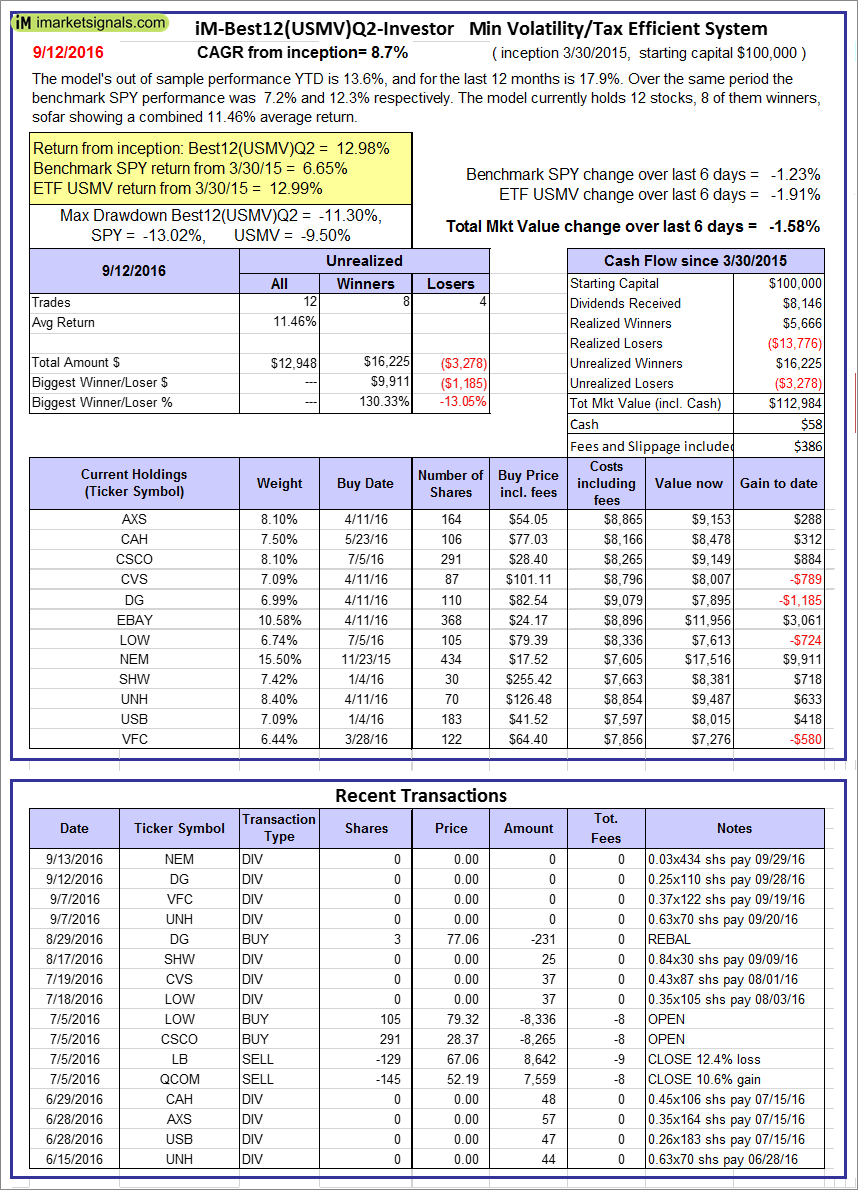 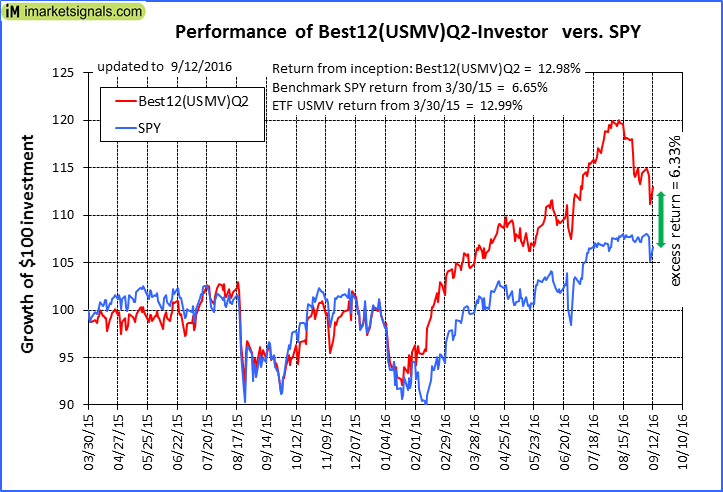 |
iM-Best12(USMV)Q2-Investor: The model’s out of sample performance YTD is 13.6%, and for the last 12 months is 17.9%. Over the same period the benchmark SPY performance was 7.2% and 12.3% respectively. Since inception, on 3/31/2015, the model gained 12.98% while the benchmark SPY gained 6.65% and the ETF USMV gained 12.99% over the same period. Over the previous week the market value of iM-Best12(USMV)Q2 gained -1.58% at a time when SPY gained -1.23%. A starting capital of $100,000 at inception on 3/31/2015 would have grown to $112,984 which includes $58 cash and excludes $386 spent on fees and slippage. |
 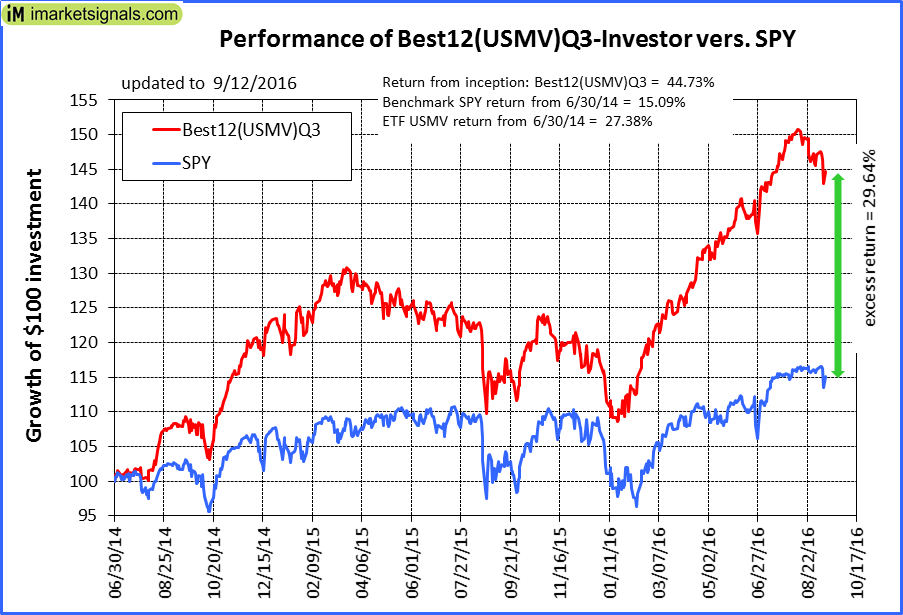 |
iM-Best12(USMV)Q3-Investor: The model’s out of sample performance YTD is 23.4%, and for the last 12 months is 25.7%. Over the same period the benchmark SPY performance was 7.2% and 12.3% respectively. Since inception, on 7/1/2014, the model gained 44.73% while the benchmark SPY gained 15.09% and the ETF USMV gained 27.38% over the same period. Over the previous week the market value of iM-Best12(USMV)Q3 gained -1.96% at a time when SPY gained -1.23%. A starting capital of $100,000 at inception on 7/1/2014 would have grown to $144,731 which includes -$126 cash and excludes $725 spent on fees and slippage. |
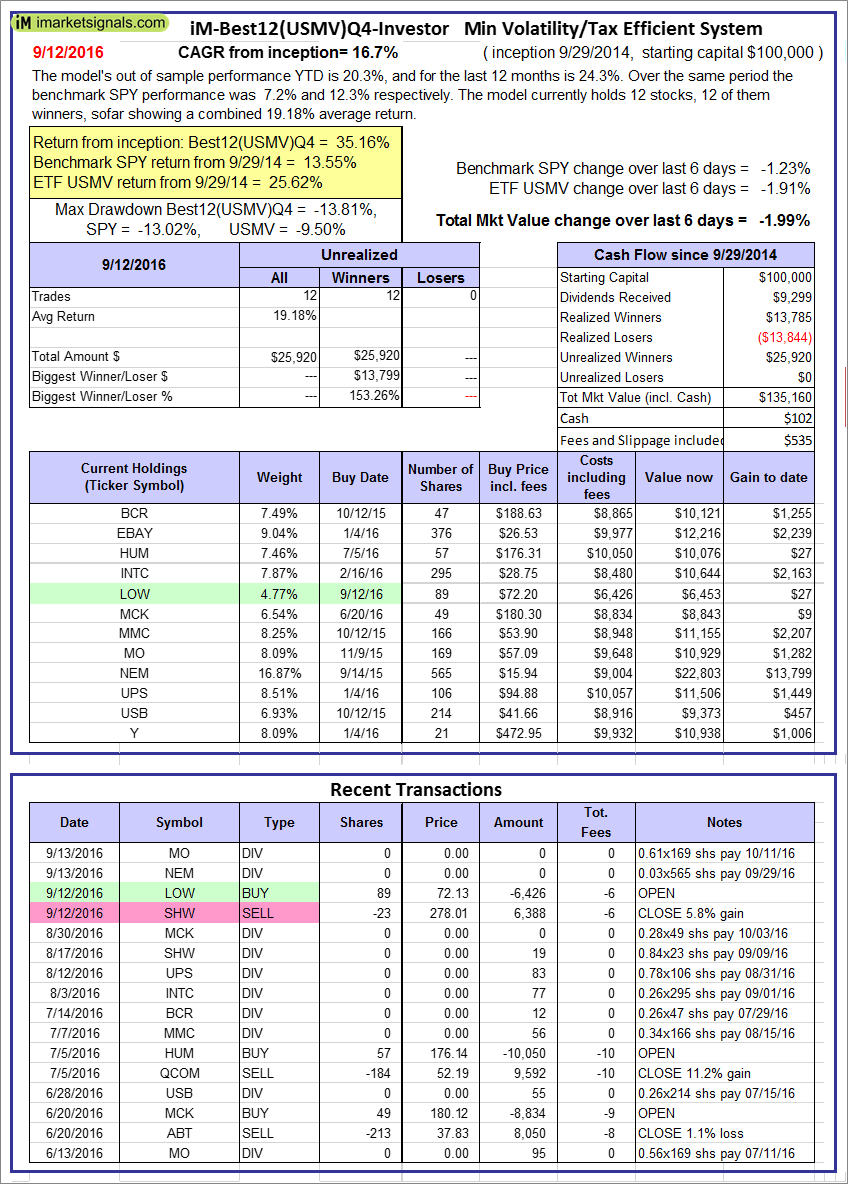  |
iM-Best12(USMV)Q4-Investor: Since inception, on 9/30/2014, the model gained 35.16% while the benchmark SPY gained 13.55% and the ETF USMV gained 25.62% over the same period. Over the previous week the market value of iM-Best12(USMV)Q4 gained -1.99% at a time when SPY gained -1.23%. A starting capital of $100,000 at inception on 9/30/2014 would have grown to $135,160 which includes $102 cash and excludes $535 spent on fees and slippage. |
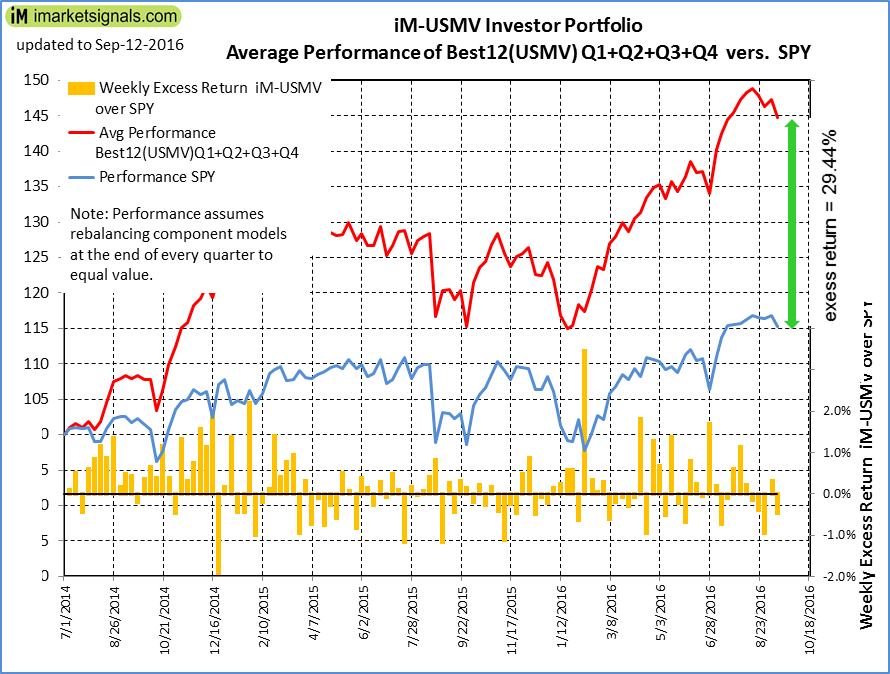 |
Average Performance of iM-Best12(USMV)Q1+Q2+Q3+Q4-Investor resulted in an excess return of 29.44% over SPY. (see iM-USMV Investor Portfolio) |
 |
iM-Best(Short): The model’s out of sample performance YTD is -11.0%, and for the last 12 months is -14.8%. Over the same period the benchmark SPY performance was 7.2% and 12.3% respectively. Over the previous week the market value of iM-Best(Short) gained 0.99% at a time when SPY gained -1.23%. Over the period 1/2/2009 to 9/12/2016 the starting capital of $100,000 would have grown to $93,231 which includes $149,322 cash and excludes $20,164 spent on fees and slippage. |
Posted in pmp SPY-SH
With reference to Section 202(a)(11)(D) of the Investment Advisers Act:
We are Engineers and not Investment Advisers,
read more ...
By the mere act of reading this page and navigating this site you acknowledge, agree to, and abide by the
Terms of Use / Disclaimer