- The ratio of federal debt to the GDP is expected to rise dramatically due to the covid-19 pandemic fiscal stimulus. This should result in a significant gold price rally.
- The analysis shows that a trading strategy for gold miners is preferable to a buy-and-hold investment strategy of individual mining stocks.
- This momentum strategy selects periodically one gold mining stock from a set of three: AngloGold Ashanti Ltd (AU), Newmont Corp. (NEM) and Sibanye-Stillwater Ltd. (SBSW).
- The selection is based on the momentum of the percentage price change and the up/down volume ratio of the stocks.
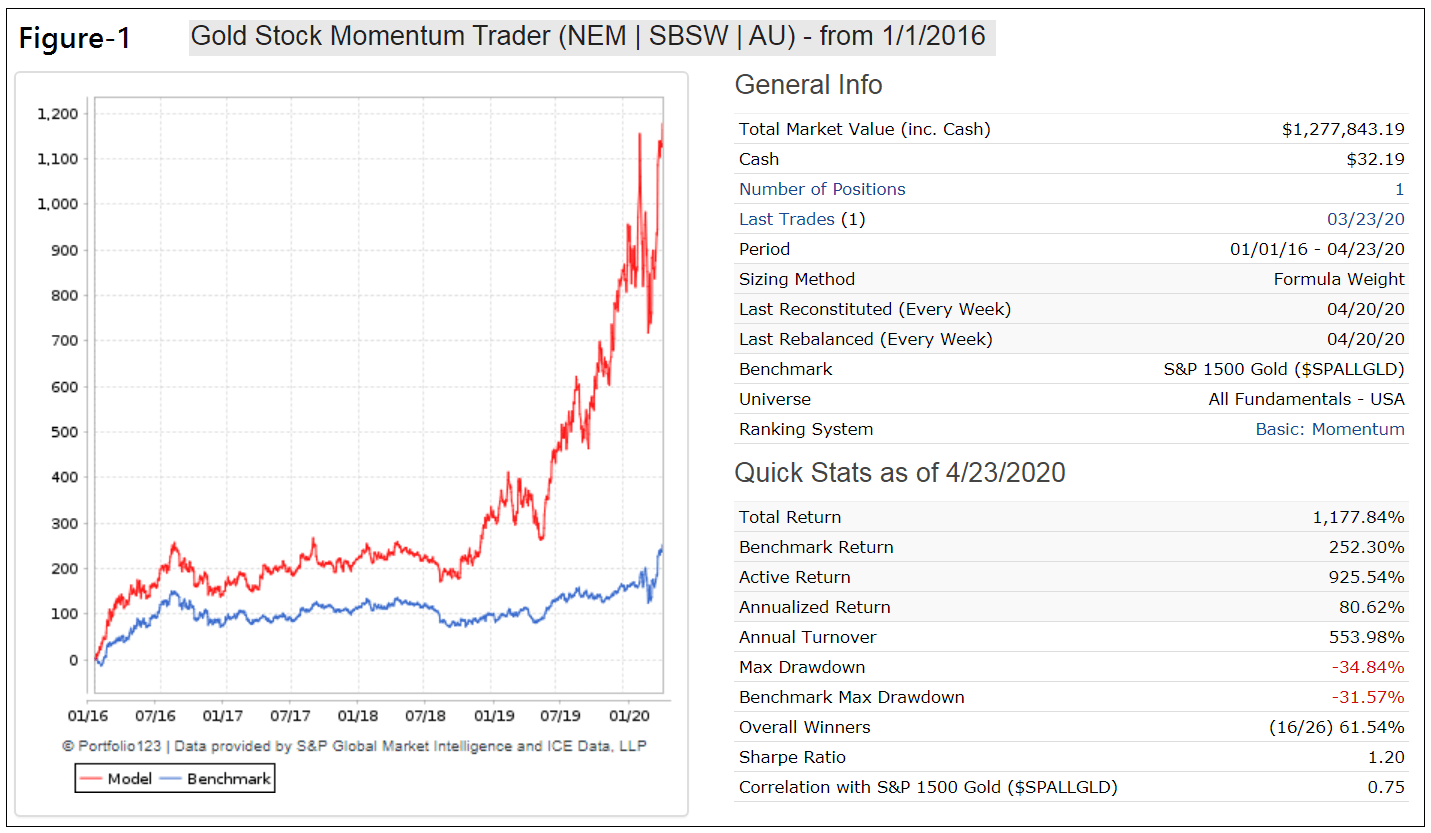
- From Jan-2016 to Apr-2019 this strategy would have produced an annualized return (CAGR) of 80.6%, much more than that of the best performing single stock of the three considered.
US Debt/GDP vs Gold Price
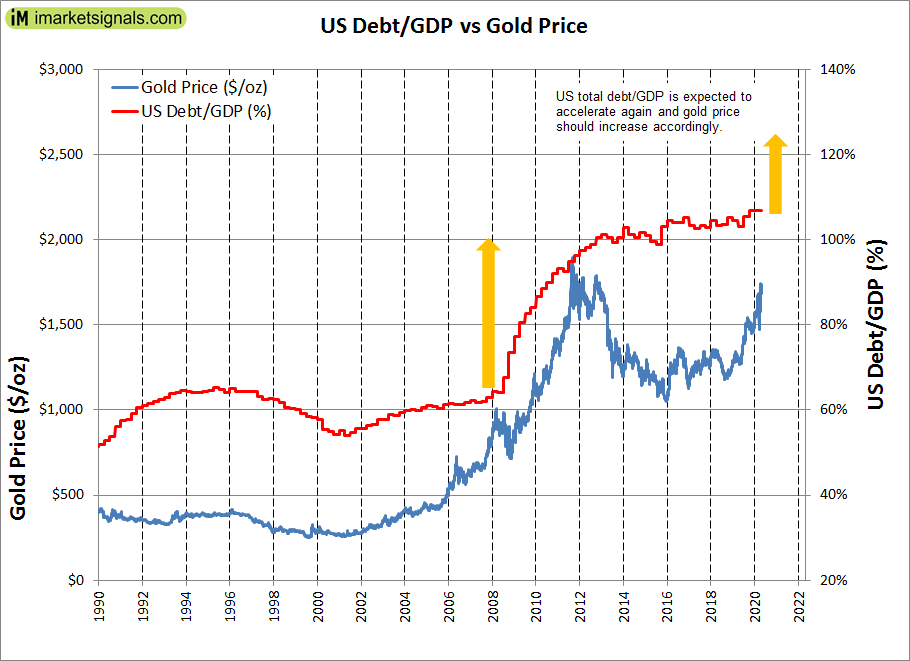
The ratio of federal debt to the economic output of the U.S. is expected to rise dramatically by the end of 2020 as a result of the covid-19 pandemic fiscal stimulus. This, and low interest rates should result in a significant rally in gold, similar to the post 2008 gold price increase, as shown in the figure below.
An upward trend of the gold price should benefit gold mining stocks. Instead of a static investment, a trading strategy between three stocks is proposed, all of which have significant upside potential on their own according to various analysts.
The Gold Mining Stocks:
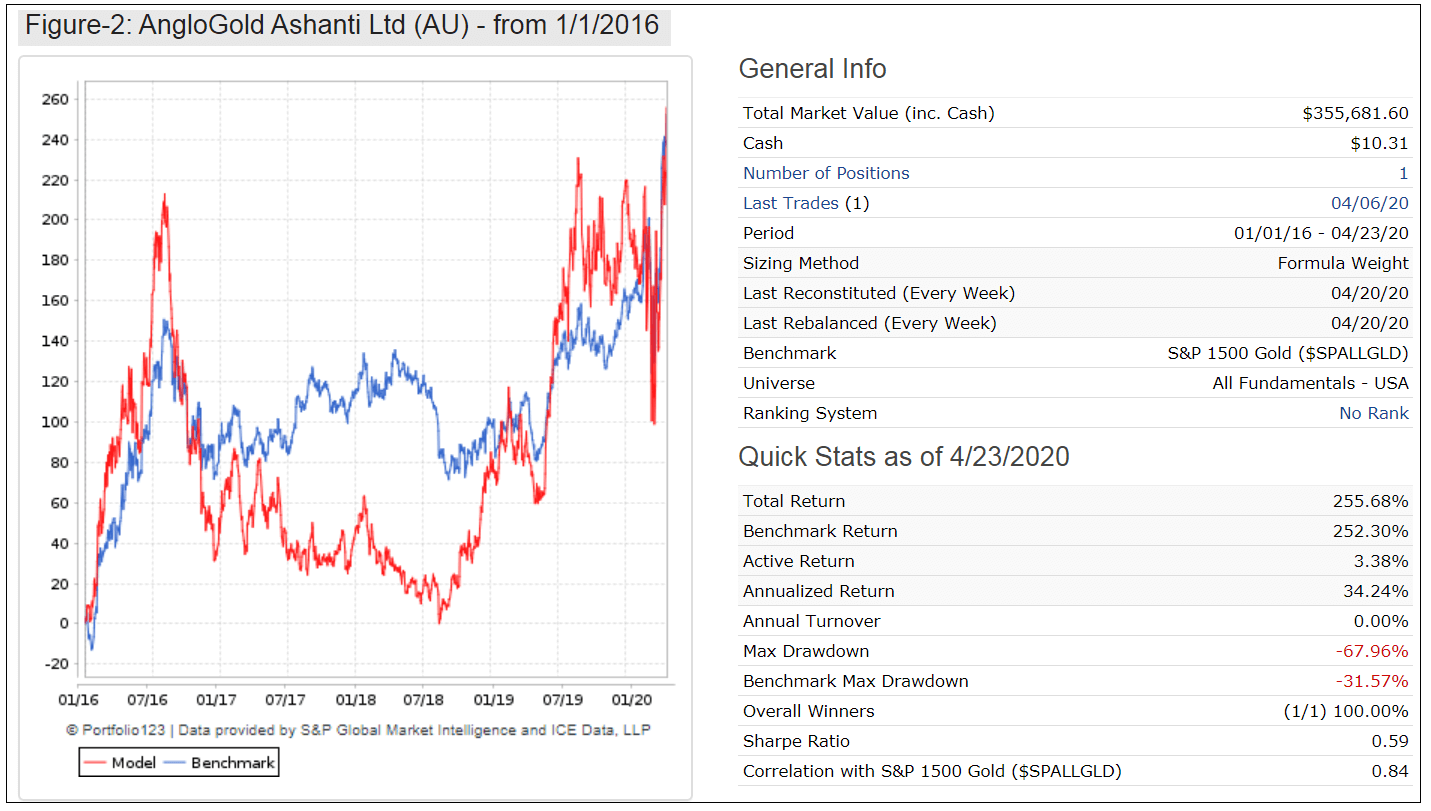
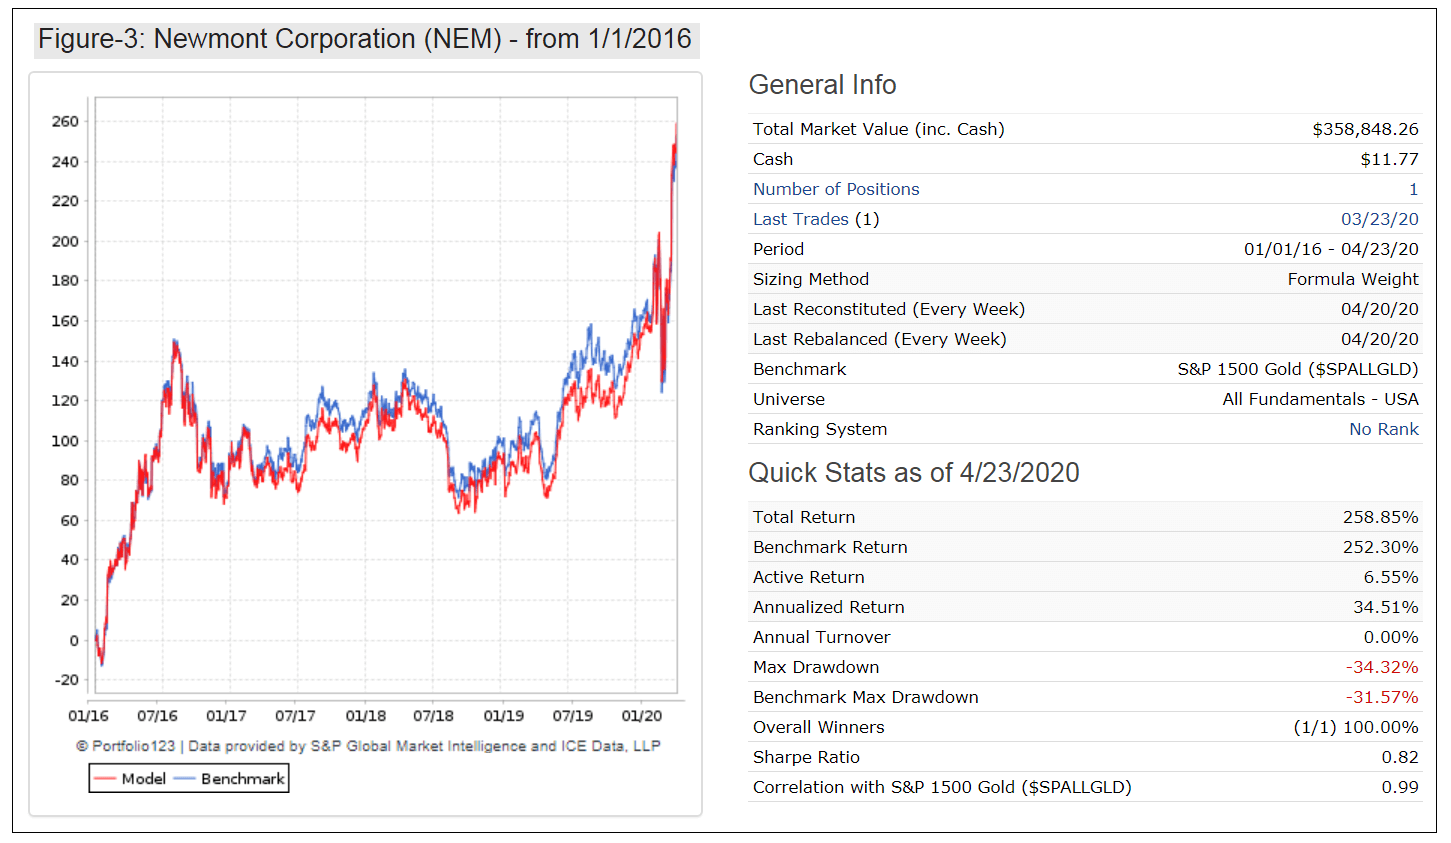
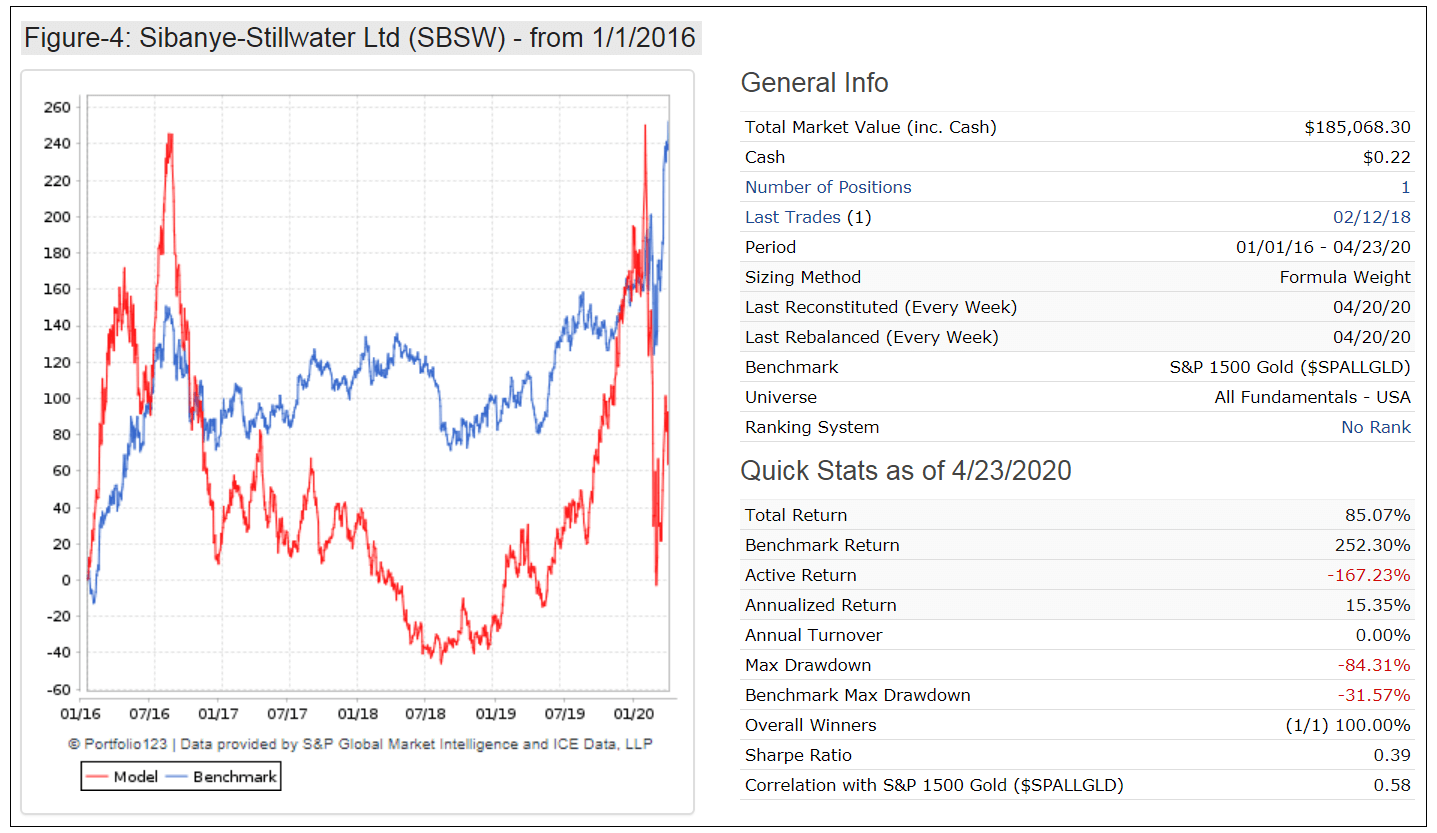
The three gold mining stocks used in the strategy and their performance statistics are listed in the table below and also shown in figures 2, 3 and 4 in the appendix.
| Ticker | Name | MktCap $-million | CAGR from 1/1/2016 | Max Draw-down | Sharpe Ratio |
| AU | AngloGold Ashanti Ltd | 10,922 | 34.2% | -68.0% | 0.59 |
| NEM | Newmont Corporation | 50,451 | 34.5% | -34.3% | 0.82 |
| SBSW | Sibanye-Stillwater Limited | 5,066 | 15.4% | -84.3% | 0.39 |
| Trading Strategy (Figure-1) | 80.6% | -34.8% | 1.20 |
Trading Strategy:
Only one stock of the set of three is held at any one time. The stock selection criteria are from a standard Portfolio 123 ranking system. The approach ranks stocks based on percent price change over four separate time periods: 120 trading days, 140 days, 160 days and 180 days. Also the up-down ratio over more recent time intervals, 20, 60 and 120 days is considered to guard against diminishing investor sentiment.
There are two sell criteria. One compares the current drawdown of a stock over a 200 trading day period with the current drawdown of the benchmark over the same period. The other is the current percentage decline from the highest closing price since the position was started.
Strategy Performance:
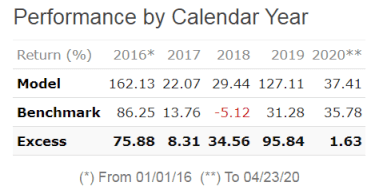
Performance of the trading strategy from Jan-1-2016 to Apr-23-2020 is shown in figure-1, and includes trading costs of about 0.2% of each trade amount. An initial investment of $100.000 would have grown to $1,278,000 over this period for an annualized return of 80.6%. The calendar year percentage return is listed in table below.
Conclusion:
The analysis shows that a momentum driven trading strategy for gold miners is preferable to a buy-and-hold investment strategy of individual mining stocks.
At iMarketSignals one can follow this strategy where it is updated weekly before the first trading day of the week. The current holding since 2/24/2020 is (NEM), all other historic realized trades are listed in the appendix.
Disclaimer:
All results shown are hypothetical and the result of backtesting over the period 2016 to 2020. The future out-of-sample performance may be significantly less if ranking-, buy-, and sell rules are not as effective as they were during the backtest period, or if the expected uptrend of the gold price does not materialize. Backtesting involves optimizing parameters by looking at past data. Even if parameter values may be optimal going forward, future returns may generally not be as high as past returns. No claim is made about future performance.
Appendix:
Figures 2, 3 and 4 show the buy-and-hold performance of AU, NEM and SBSW, respectively.
List of Realized Trades:
| Symbol | Open | Close | Days | % Return* |
| SBSW | 11/25/2019 | 02/24/2020 | 91 | 50.10% |
| AU | 11/11/2019 | 11/25/2019 | 14 | -2.60% |
| SBSW | 09/30/2019 | 11/11/2019 | 42 | 27.00% |
| AU | 08/05/2019 | 09/30/2019 | 56 | -6.20% |
| SBSW | 07/22/2019 | 08/05/2019 | 14 | 0.20% |
| AU | 05/20/2019 | 07/22/2019 | 63 | 66.50% |
| SBSW | 04/15/2019 | 05/20/2019 | 35 | -16.80% |
| AU | 03/25/2019 | 04/15/2019 | 21 | -10.00% |
| SBSW | 03/04/2019 | 03/25/2019 | 21 | 9.50% |
| AU | 09/24/2018 | 03/04/2019 | 161 | 50.80% |
| SBSW | 09/10/2018 | 09/24/2018 | 14 | 0.00% |
| AU | 08/20/2018 | 09/10/2018 | 21 | 5.80% |
| NEM | 11/27/2017 | 08/20/2018 | 266 | -12.70% |
| SBSW | 10/30/2017 | 11/27/2017 | 28 | 7.50% |
| NEM | 09/11/2017 | 10/30/2017 | 49 | -7.70% |
| SBSW | 08/21/2017 | 09/11/2017 | 21 | -1.40% |
| NEM | 04/17/2017 | 08/21/2017 | 126 | 4.50% |
| SBSW | 04/03/2017 | 04/17/2017 | 14 | 18.50% |
| NEM | 08/15/2016 | 04/03/2017 | 231 | -26.80% |
| SBSW | 08/01/2016 | 08/15/2016 | 14 | 7.10% |
| NEM | 05/16/2016 | 08/01/2016 | 77 | 26.20% |
| AU | 04/04/2016 | 05/16/2016 | 42 | 13.00% |
| NEM | 03/21/2016 | 04/04/2016 | 14 | -3.70% |
| AU | 02/22/2016 | 03/21/2016 | 28 | 24.10% |
| SBSW | 01/04/2016 | 02/22/2016 | 49 | 90.00% |
*) Percent return does not include dividends.

In the absence of a good trading strategy I’ve been having to settle for GLD and GDX, so this is very helpful. Thanks.
A few questions:
Why did you choose those three miners and only three?
Why only a 4+ year backtest?
Did you look at combining this strategy with one of your ETF timing strategies which uses GLD?
Most of the gold stocks move together according to the gold price.
SBSW and AU appear to react differently from each other to the gold price, because SBSW derives only about 35% of its income from gold and the remainder from other precious metals.
NEM is the least volatile, presumably because it is the only gold mining stock in the S&P 500.
The backtest is only for the last few years because this seems to be the period when gold became of interest again to investors.
It would be interesting to see how the drawdown would be impacted by using the choice from this model in a pairs trade where the short position would be GDX (or long a miners inverse fund).
Tom C
Thanks for posting this, Georg and Anton!
Is there a typo in the strategy description that reads, “four separate time periods: 120 trading days, 180 days, 160 days and 180 days?” Looks like 180 is repeated, or I misunderstood something.
This looks like a very timely strategy. I’d like to give it a try if I can figure out how to replicate it, or if you are planning to post new trades in the comments here or on the home page.
I had stopped following the country rotation system last month, so have some cash I could put to work using a new strategy.
Yes, there is a typo (now corrected, thank you), should read 120, 140, 160 and 180.
The model is still hold NEM (as of 5/15/2020 up over 8% since posting of this article). We will provide weekly updates on this model shortly.
Is this strategy still with NEM as of today (Sunday, May 3)?
I hope you include the current selection for this strategy as a Mother’s Day gift on Sunday.
Apologies for late reply. Model still holds NEM.
Great work. Have you ever attempted a momentum strategy using the royalty companies (FNV, RGLD, WPM) ?
Tom C
Yes, we have tried the streamers. Problem with those is that they behave very similarly and thus don’t give you much of an upside by switching between them.
could you provide the correlation coefficient for this strategy vs. the 5HedgeFundSelect strategy?
also perhaps a longer lookback period for backtest data if possible? We have data on all three back to 2013. Would this be possible to provide?
From Jan-2013
Gold Stock Momentum Trader (NEM | SBSW | AU)
Consensus holdings of 5 Hedge Funds
Correlation is 0.07
Backtest performance of a combo 50 : 50
Period 01/02/13 – 09/25/20
Benchmark S&P 500 (SPY)
Quick Stats as of 9/25/2020
Total Return 1,348.18%
Benchmark Return 162.03%
Active Return 1,186.15%
Annualized Return 41.28%
Max Drawdown -31.24%
Benchmark Max Drawdown -33.72%
Sharpe Ratio 1.36
Correlation with S&P 500 (SPY) 0.23
this model updates have disappeared off the main page
Is the gold momentum strategy currently in AU or NEM. There seems to be a discrepancy between the web page and the strategy sheet.
The strategy holds AUM since 1/31/22.
Thank you for reporting the discrepancy.
Georg,
Can you give the trades since 02/24/2020. Thanks,
T.
Symbol Open Close Pct
NEM 3/21/2022 –
AU 3/7/2022 3/21/2022 -7.80%
NEM 2/14/2022 3/7/2022 19.20%
AU 1/31/2022 2/14/2022 15.10%
NEM 1/10/2022 1/31/2022 1.10%
AU 10/11/2021 1/10/2022 6.40%
NEM 8/23/2021 10/11/2021 -5.80%
SBSW 10/12/2020 8/23/2021 23.20%
NEM 9/21/2020 10/12/2020 -1.20%
SBSW 8/17/2020 9/21/2020 -11.90%
NEM 8/3/2020 8/17/2020 -1.20%
AU 7/13/2020 8/3/2020 5.40%
NEM 6/29/2020 7/13/2020 -0.20%
SBSW 6/15/2020 6/29/2020 7.90%
AU 6/1/2020 6/15/2020 -1.50%
NEM 2/24/2020 6/1/2020 20.10%
Thanks, Georg
So the website shows Current Holdings AU but it shows most recent BUY on 5/16 as NEM and SELL as AU
***PLEASE ADVISE*** So the website shows Current Holdings AU but it shows most recent BUY on 5/16 as NEM and SELL as AU
was the email today correct or is the website accurate? AU or NEM?
Thank you for reporting – fixed now.