
  |
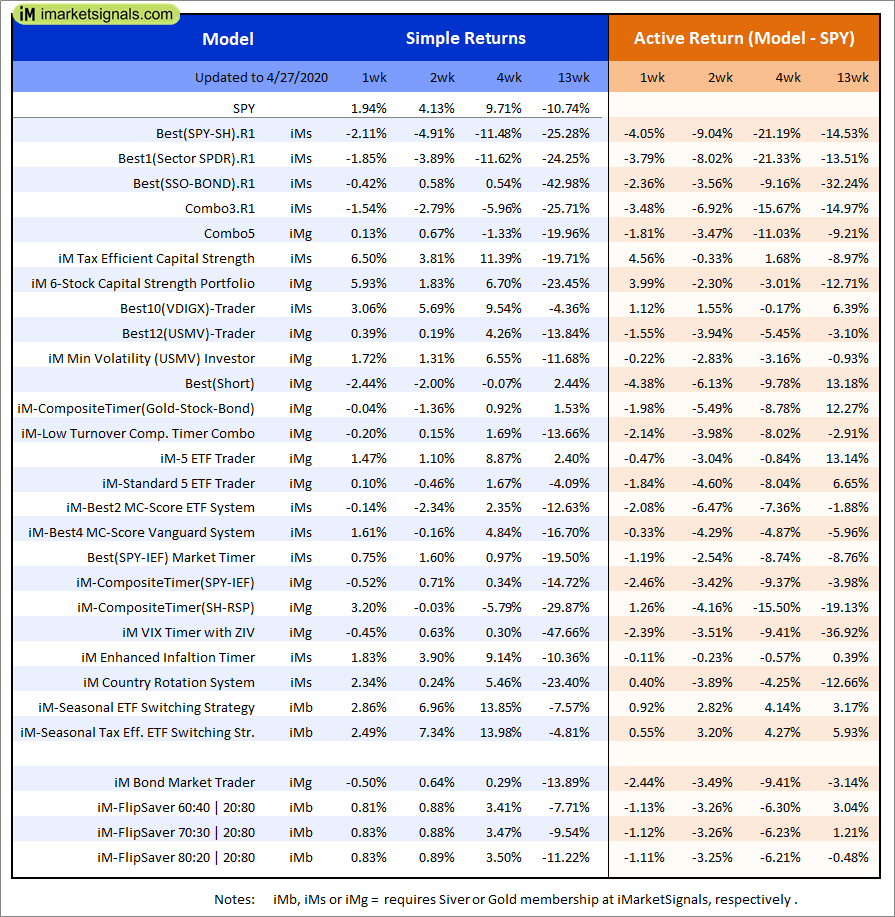
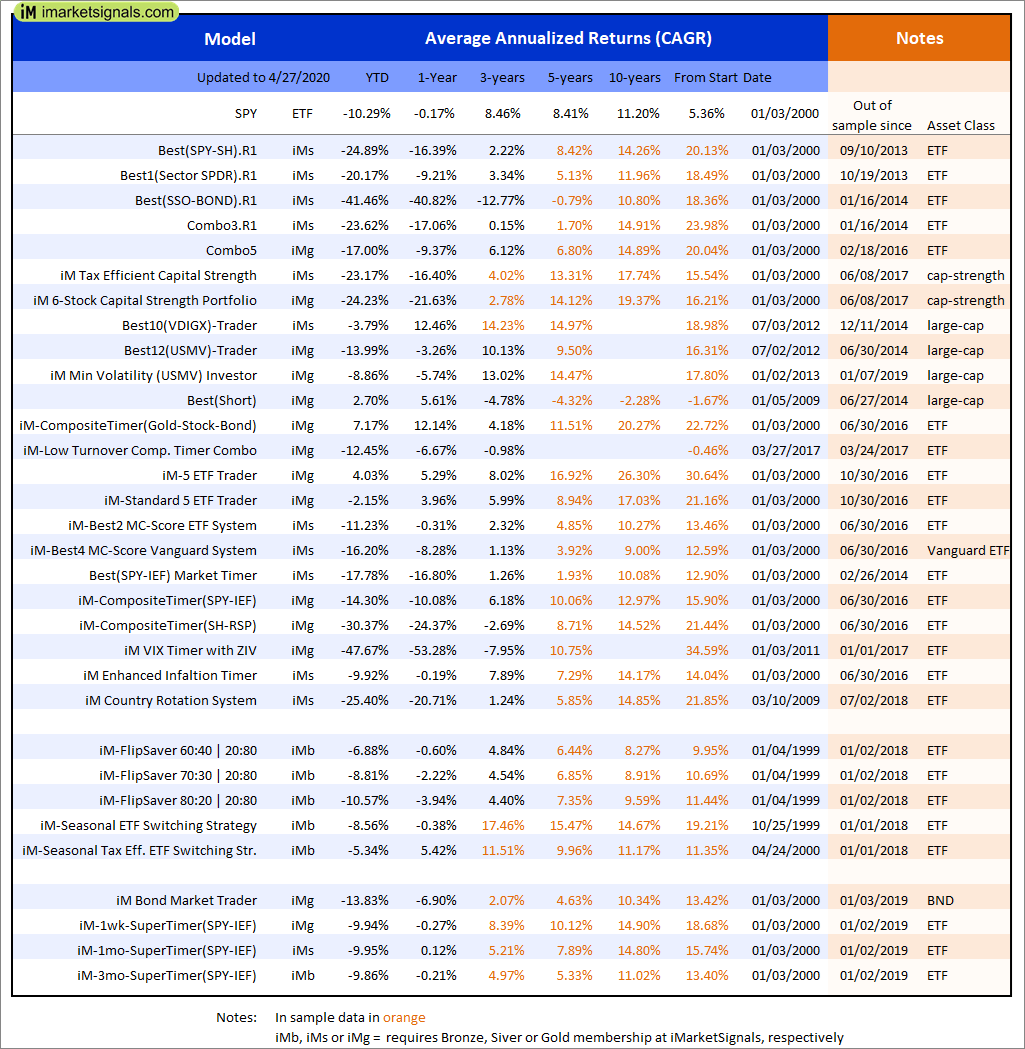
Out of sample performance summary of our models for the past 1, 2, 4 and 13 week periods. The active active return indicates how the models over- or underperformed the benchmark ETF SPY. Also the YTD, and the 1-, 3-, 5- and 10-year annualized returns are shown in the second table |
 |
iM-FlipSaver 60:40 | 20:80 – 2017: The model’s out of sample performance YTD is -7.0%, and for the last 12 months is -0.7%. Over the same period the benchmark E60B40 performance was -3.6% and 4.9% respectively. Over the previous week the market value of iM-FlipSaver 80:20 | 20:80 gained 0.82% at a time when SPY gained 1.11%. A starting capital of $100,000 at inception on 7/16/2015 would have grown to $120,402 which includes -$3,563 cash and excludes $1,528 spent on fees and slippage. |
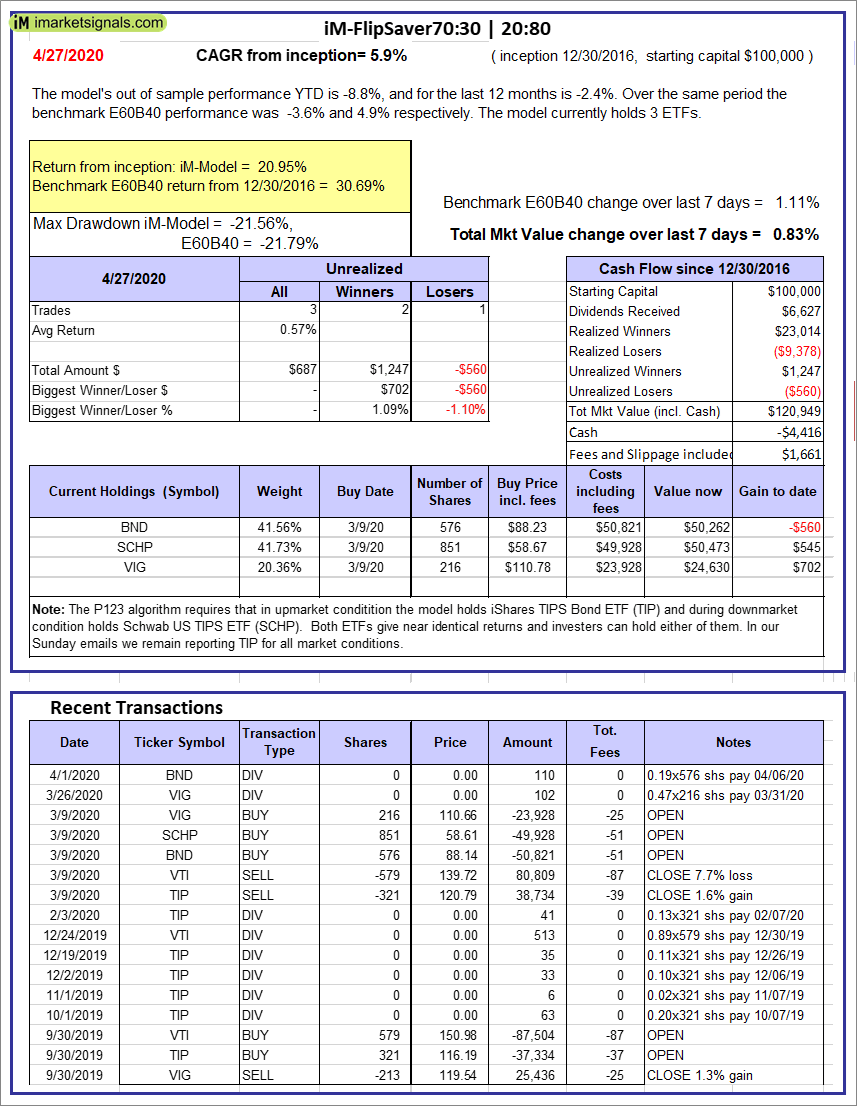 |
iM-FlipSaver 70:30 | 20:80 – 2017: The model’s out of sample performance YTD is -8.8%, and for the last 12 months is -2.4%. Over the same period the benchmark E60B40 performance was -3.6% and 4.9% respectively. Over the previous week the market value of iM-FlipSaver 70:30 | 20:80 gained 0.83% at a time when SPY gained 1.11%. A starting capital of $100,000 at inception on 7/15/2015 would have grown to $120,949 which includes -$4,416 cash and excludes $1,661 spent on fees and slippage. |
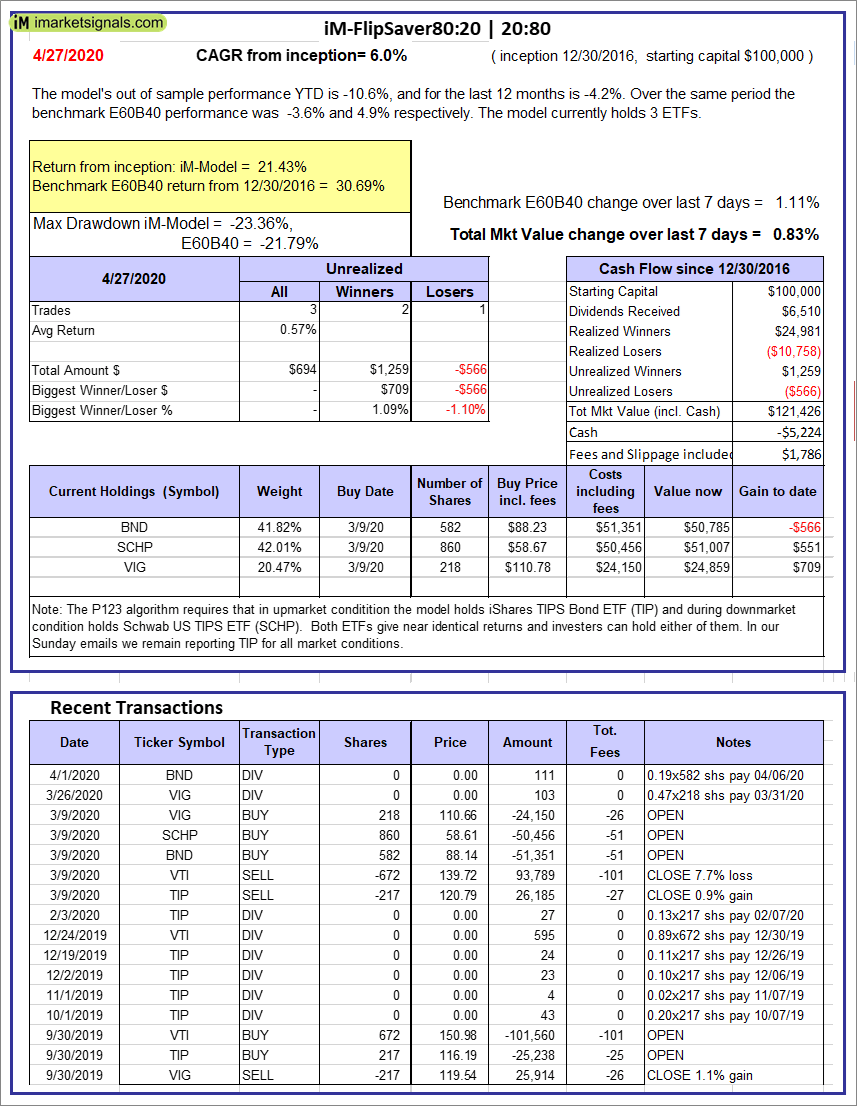 |
iM-FlipSaver 80:20 | 20:80 – 2017: The model’s out of sample performance YTD is -10.6%, and for the last 12 months is -4.2%. Over the same period the benchmark E60B40 performance was -3.6% and 4.9% respectively. Over the previous week the market value of iM-FlipSaver 80:20 | 20:80 gained 0.83% at a time when SPY gained 1.11%. A starting capital of $100,000 at inception on 1/2/2017 would have grown to $121,426 which includes -$5,224 cash and excludes $1,786 spent on fees and slippage. |
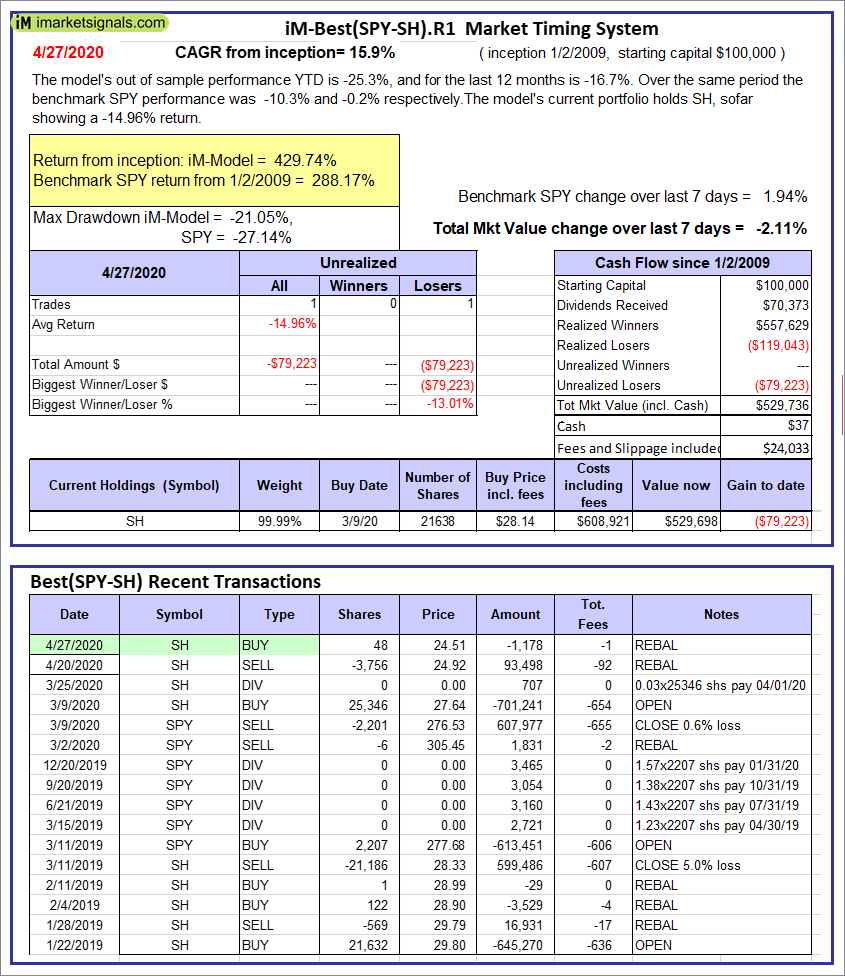 |
iM-Best(SPY-SH).R1: The model’s out of sample performance YTD is -25.3%, and for the last 12 months is -16.7%. Over the same period the benchmark SPY performance was -10.3% and -0.2% respectively. Over the previous week the market value of Best(SPY-SH) gained -2.11% at a time when SPY gained 1.94%. A starting capital of $100,000 at inception on 1/2/2009 would have grown to $529,736 which includes $37 cash and excludes $24,033 spent on fees and slippage. |
 |
iM-Combo3.R1: The model’s out of sample performance YTD is -23.7%, and for the last 12 months is -17.2%. Over the same period the benchmark SPY performance was -10.3% and -0.2% respectively. Over the previous week the market value of iM-Combo3.R1 gained -1.54% at a time when SPY gained 1.94%. A starting capital of $100,000 at inception on 2/3/2014 would have grown to $135,036 which includes $2,757 cash and excludes $6,084 spent on fees and slippage. |
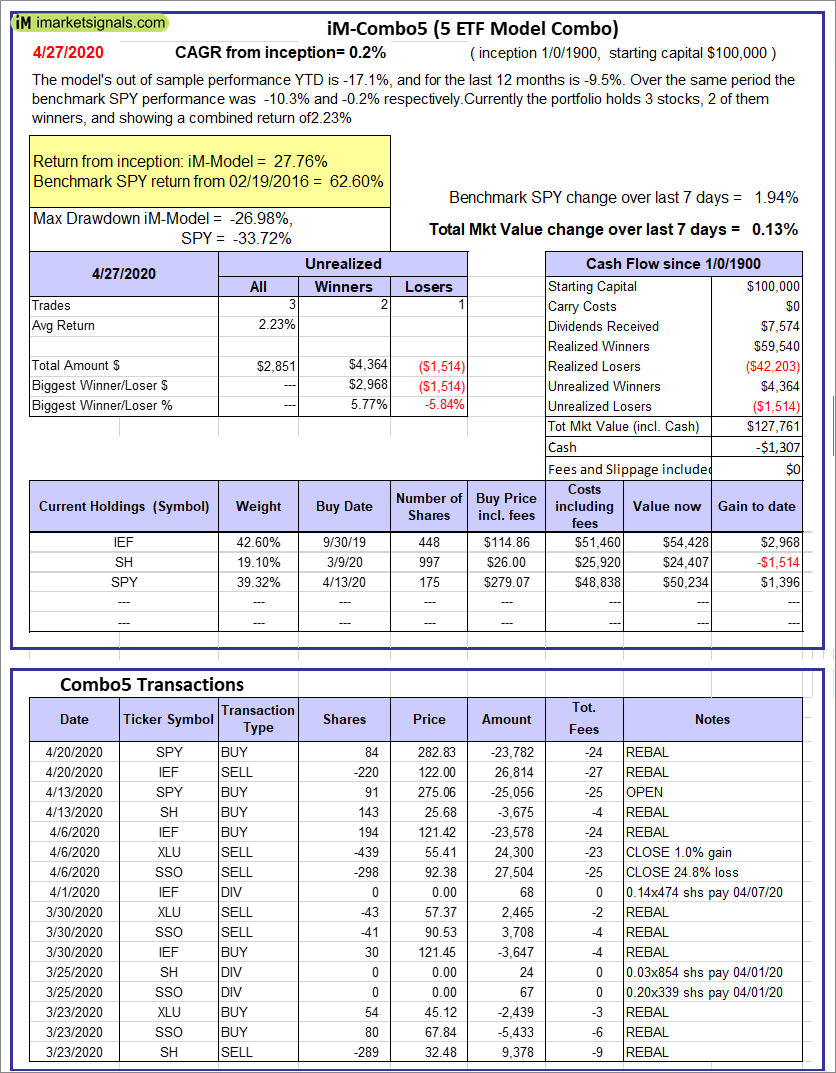 |
iM-Combo5: The model’s out of sample performance YTD is -17.1%, and for the last 12 months is -9.5%. Over the same period the benchmark SPY performance was -10.3% and -0.2% respectively. Over the previous week the market value of iM-Combo5 gained 0.13% at a time when SPY gained 1.94%. A starting capital of $100,000 at inception on 2/22/2016 would have grown to $127,761 which includes -$1,307 cash and excludes $0 spent on fees and slippage. |
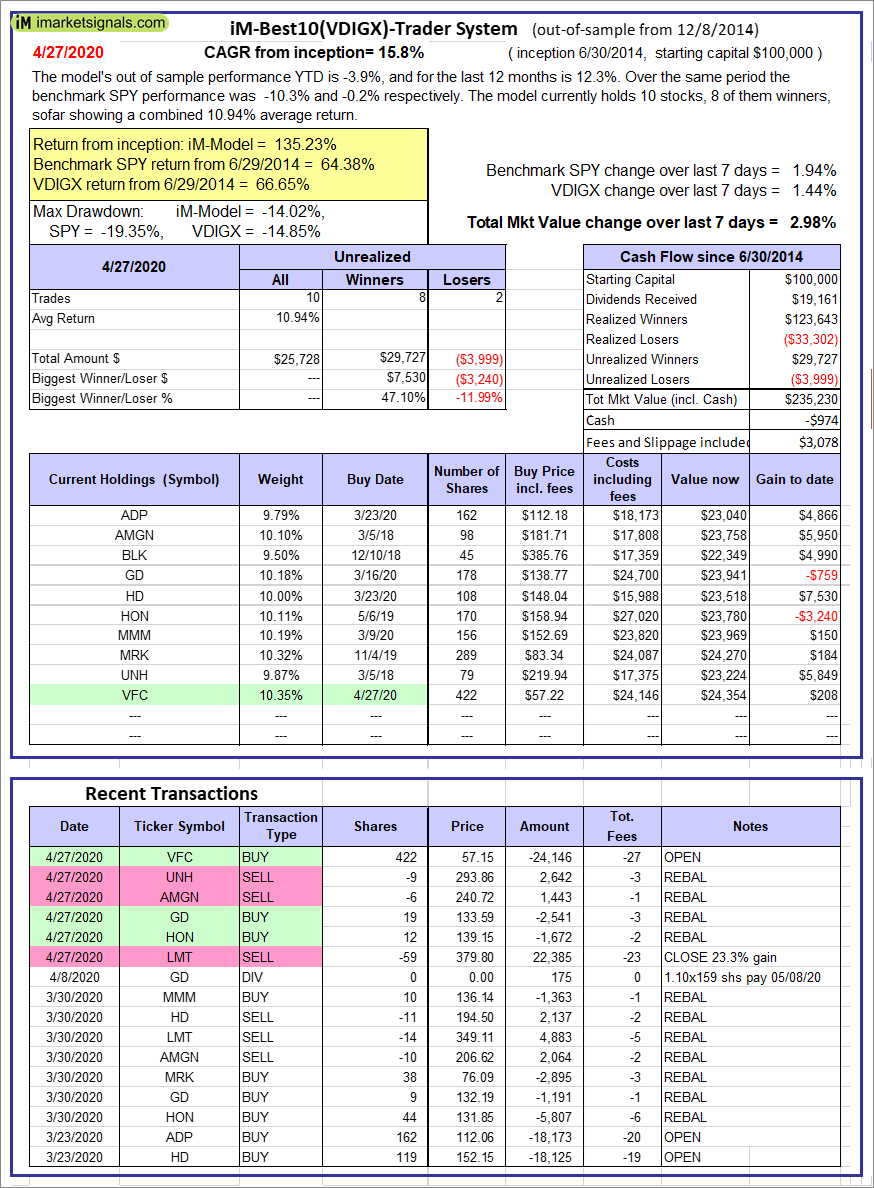 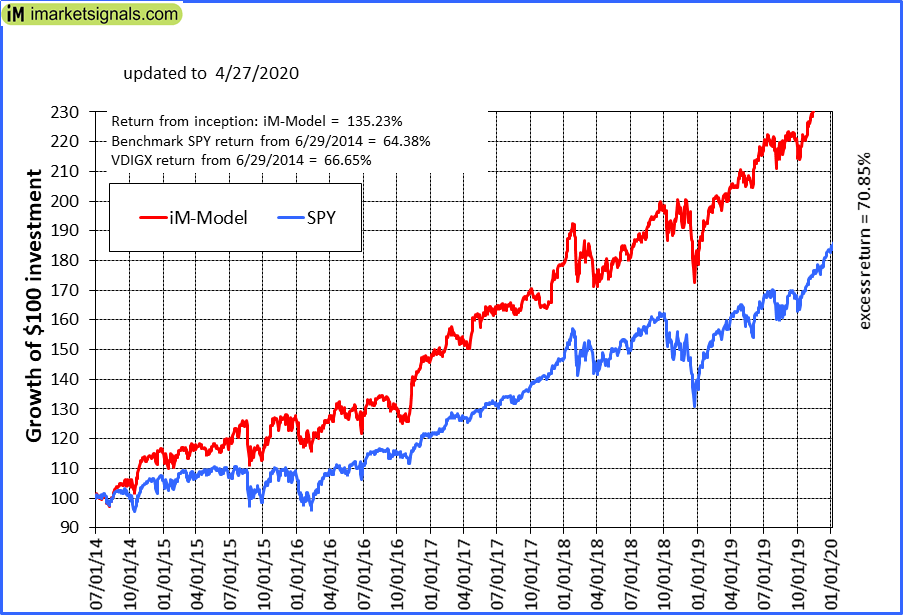 |
iM-Best10(VDIGX)-Trader: The model’s out of sample performance YTD is -3.9%, and for the last 12 months is 12.3%. Over the same period the benchmark SPY performance was -10.3% and -0.2% respectively. Since inception, on 7/1/2014, the model gained 135.23% while the benchmark SPY gained 64.38% and VDIGX gained 66.65% over the same period. Over the previous week the market value of iM-Best10(VDIGX) gained 2.98% at a time when SPY gained 1.94%. A starting capital of $100,000 at inception on 7/1/2014 would have grown to $235,230 which includes -$974 cash and excludes $3,078 spent on fees and slippage. |
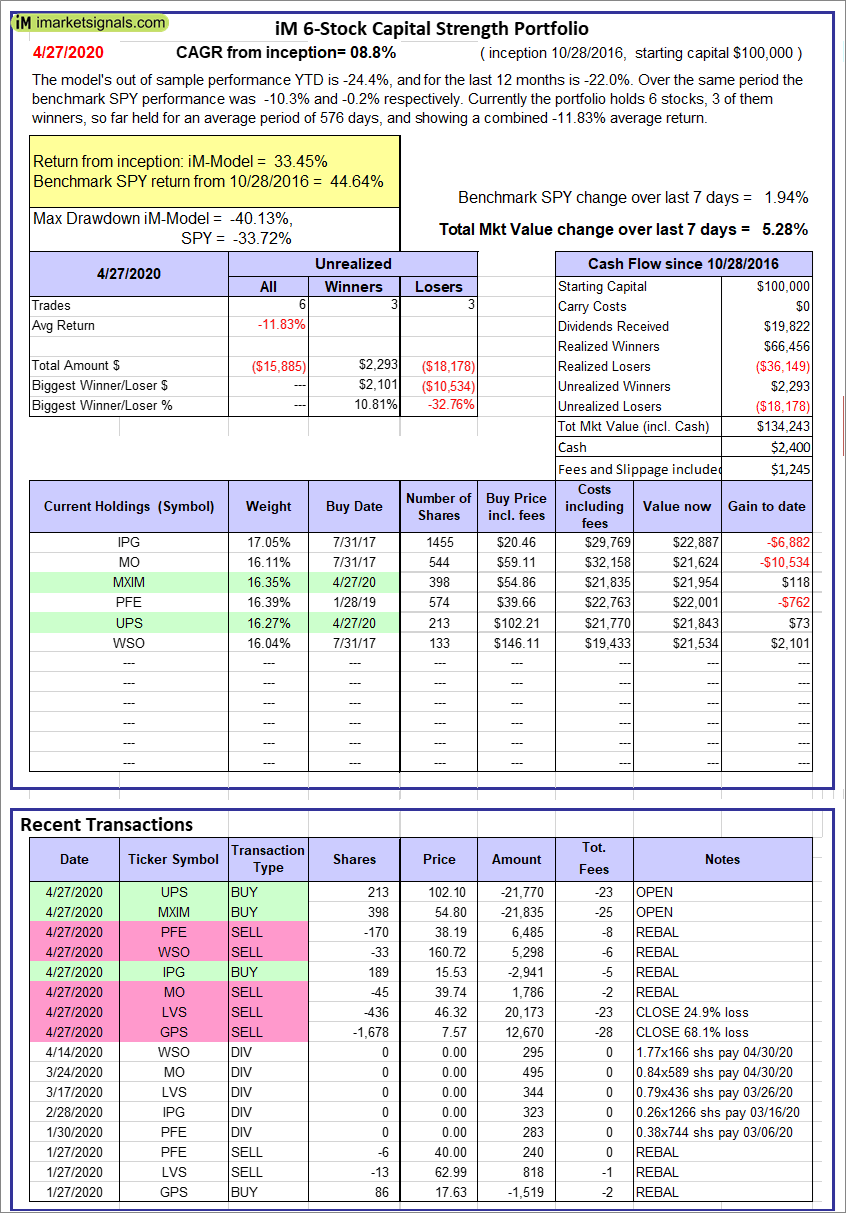 |
iM 6-Stock Capital Strength Portfolio: The model’s out of sample performance YTD is -24.4%, and for the last 12 months is -22.0%. Over the same period the benchmark SPY performance was -10.3% and -0.2% respectively. Over the previous week the market value of the iM 6-Stock Capital Strength Portfolio gained 5.28% at a time when SPY gained 1.94%. A starting capital of $100,000 at inception on 10/28/2016 would have grown to $134,243 which includes $2,400 cash and excludes $1,245 spent on fees and slippage. |
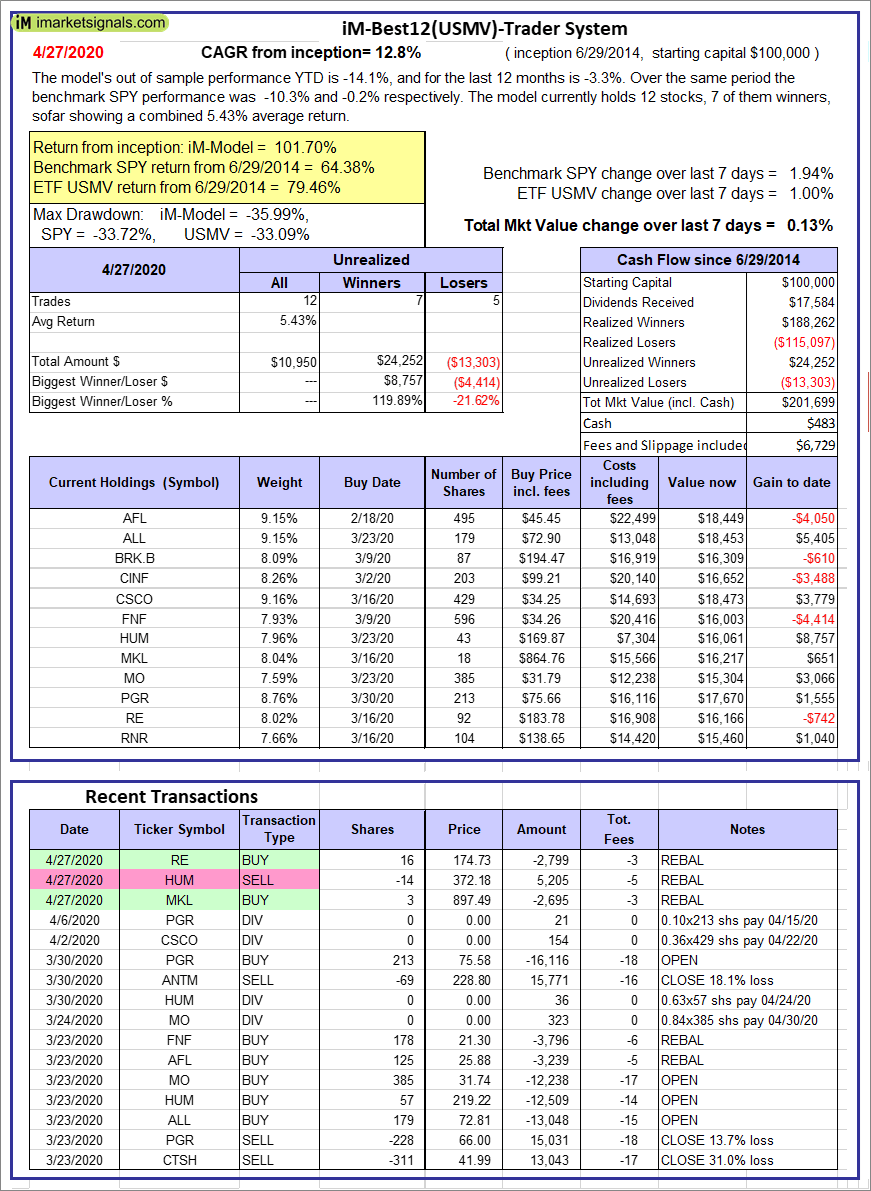 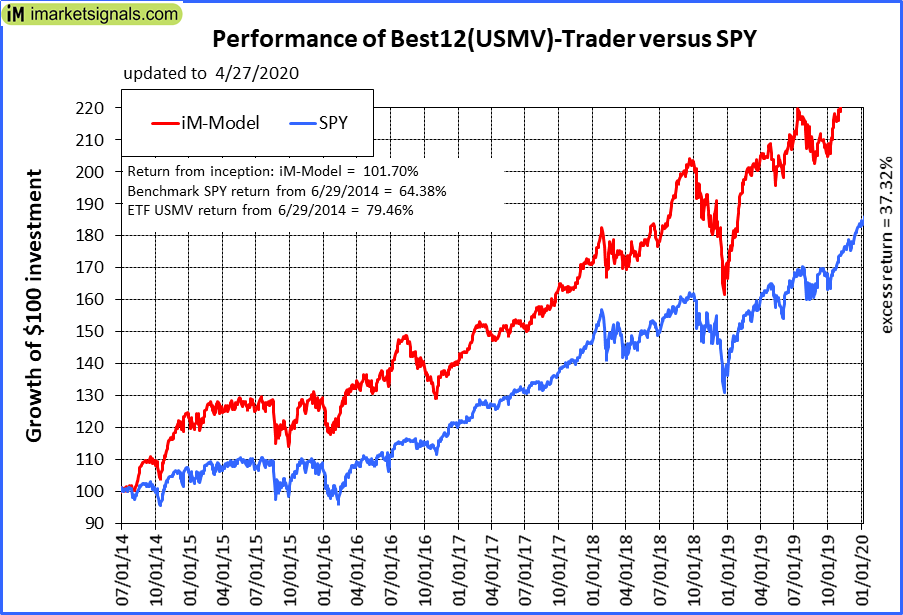 |
iM-Best12(USMV)-Trader: The model’s out of sample performance YTD is -14.1%, and for the last 12 months is -3.3%. Over the same period the benchmark SPY performance was -10.3% and -0.2% respectively. Since inception, on 6/30/2014, the model gained 101.70% while the benchmark SPY gained 64.38% and the ETF USMV gained 79.46% over the same period. Over the previous week the market value of iM-Best12(USMV)-Trader gained 0.13% at a time when SPY gained 1.94%. A starting capital of $100,000 at inception on 6/30/2014 would have grown to $201,699 which includes $483 cash and excludes $6,729 spent on fees and slippage. |
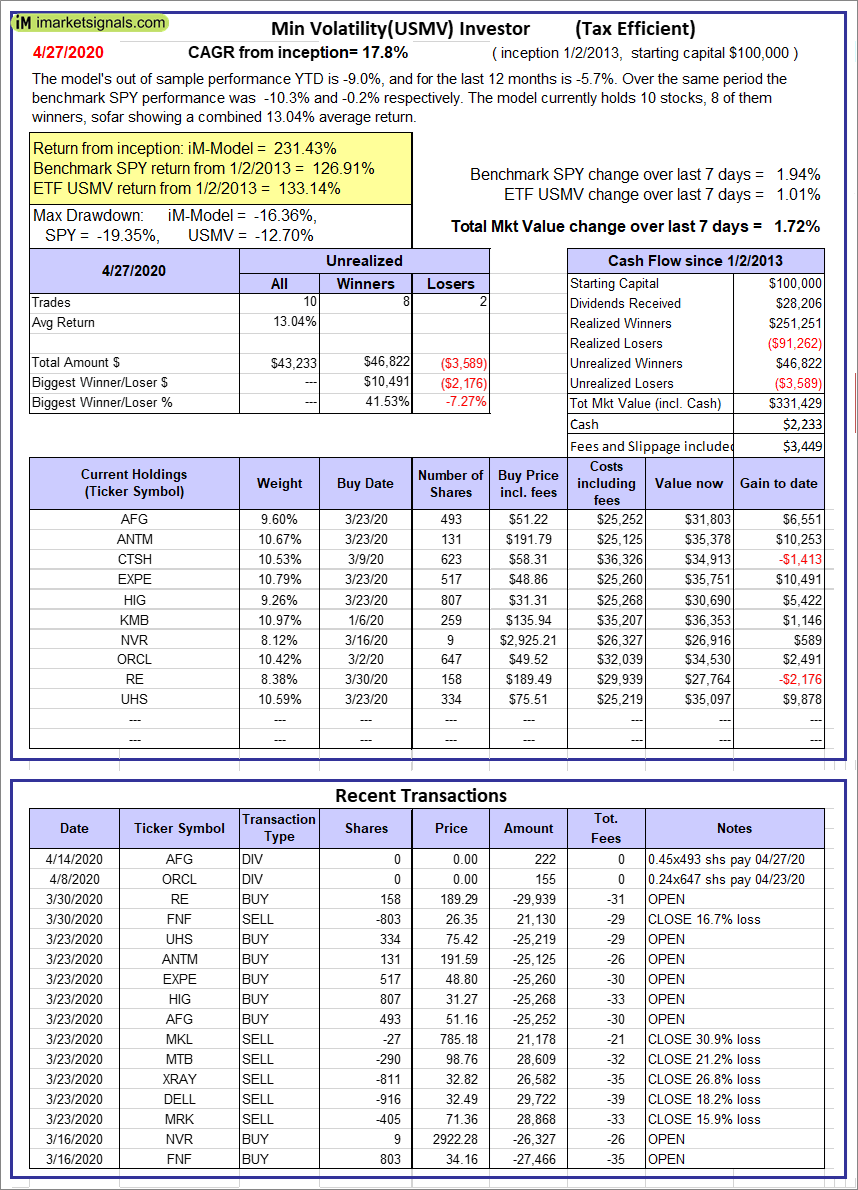 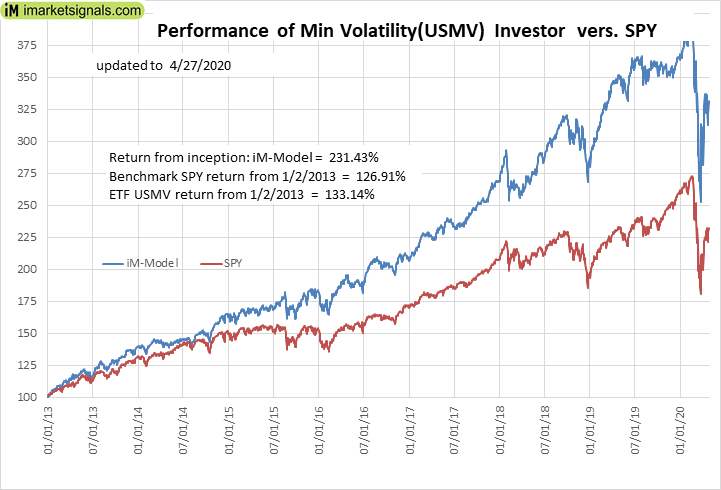 |
iM-Min Volatility(USMV) Investor (Tax Efficient): The model’s out of sample performance YTD is -9.0%, and for the last 12 months is -5.7%. Over the same period the benchmark SPY performance was -10.3% and -0.2% respectively. Since inception, on 1/3/2013, the model gained 231.43% while the benchmark SPY gained 126.91% and the ETF USMV gained 133.14% over the same period. Over the previous week the market value of iM-Best12(USMV)Q1 gained 1.72% at a time when SPY gained 1.94%. A starting capital of $100,000 at inception on 1/3/2013 would have grown to $331,429 which includes $2,233 cash and excludes $3,449 spent on fees and slippage. |
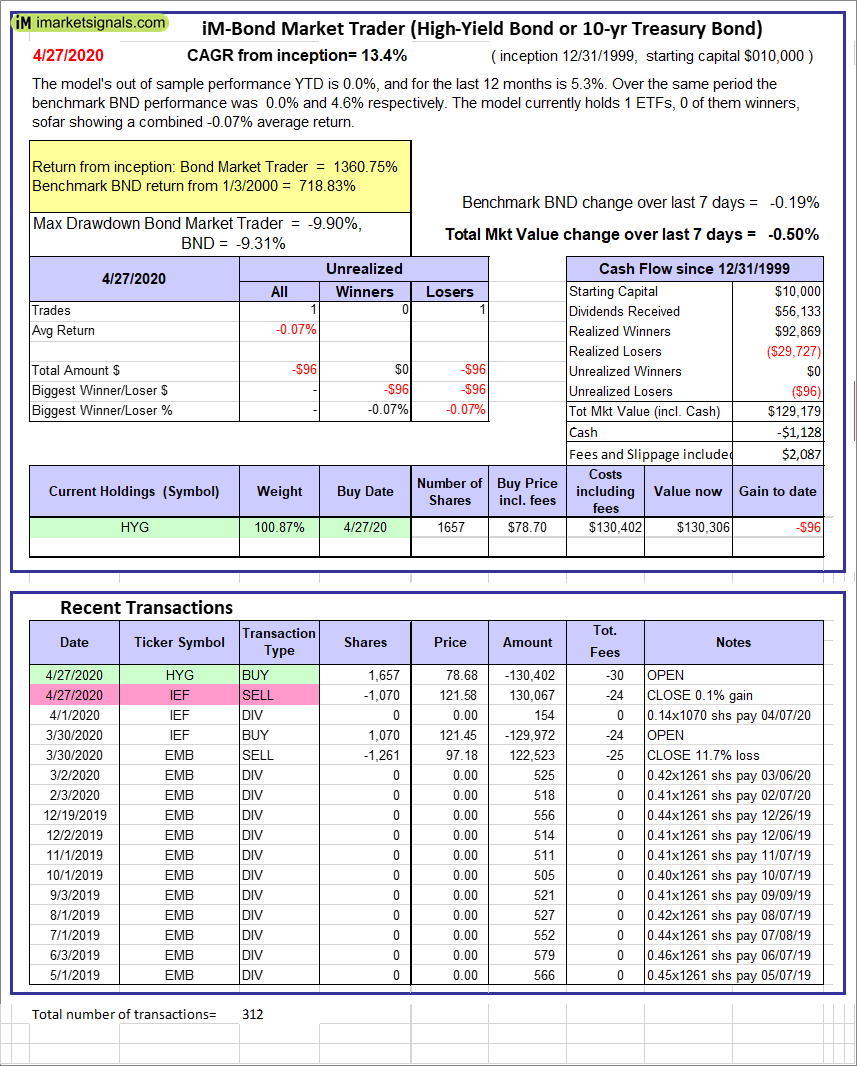 |
iM-Bond Market Trader (High-Yield Bond or 10-yr Treasury Bond): The model’s out of sample performance YTD is -32.1%, and for the last 12 months is -32.0%. Over the same period the benchmark SPY performance was -10.3% and -0.2% respectively. Over the previous week the market value of the iM-Bond Market Trader (High-Yield Bond or 10-yr Treasury Bond) gained -0.50% at a time when BND gained -0.19%. A starting capital of $100,000 at inception on 10/30/2016 would have grown to $129,179 which includes -$1,128 cash and excludes $2,087 spent on fees and slippage. |
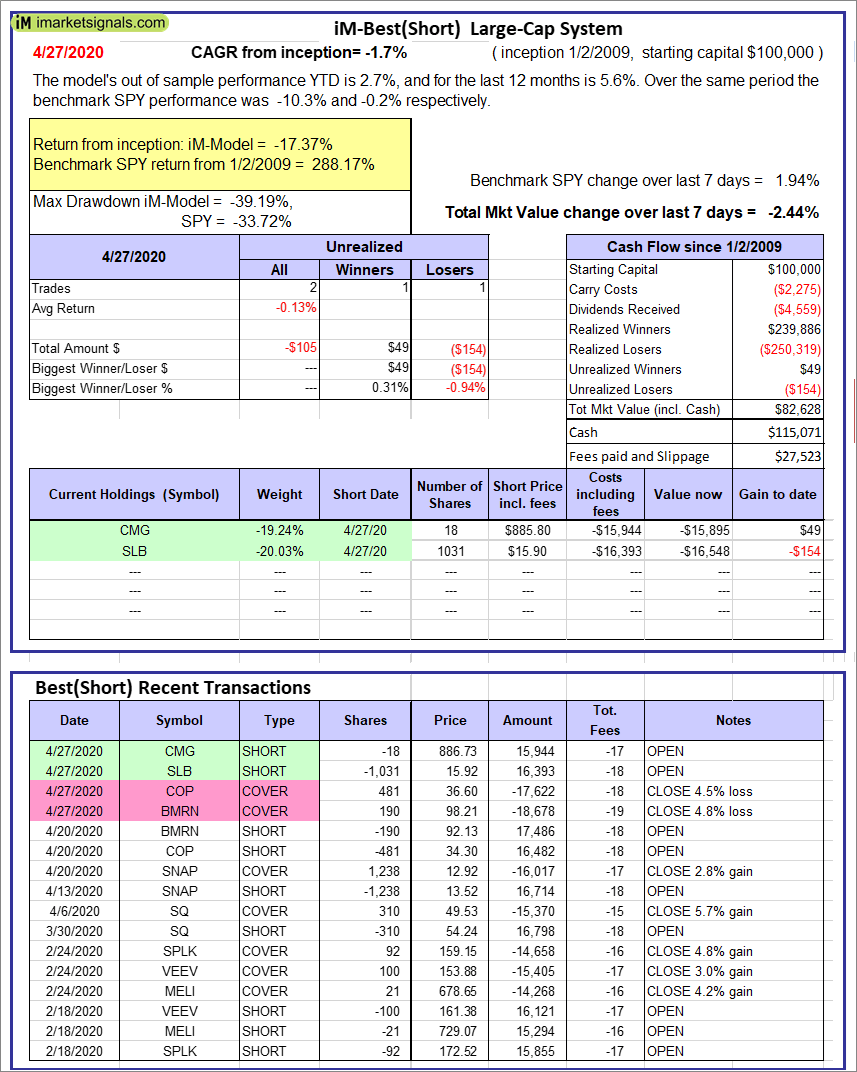 |
iM-Best(Short): The model’s out of sample performance YTD is 2.7%, and for the last 12 months is 5.6%. Over the same period the benchmark SPY performance was -10.3% and -0.2% respectively. Over the previous week the market value of iM-Best(Short) gained -2.44% at a time when SPY gained 1.94%. Over the period 1/2/2009 to 4/27/2020 the starting capital of $100,000 would have grown to $82,628 which includes $115,071 cash and excludes $27,523 spent on fees and slippage. |
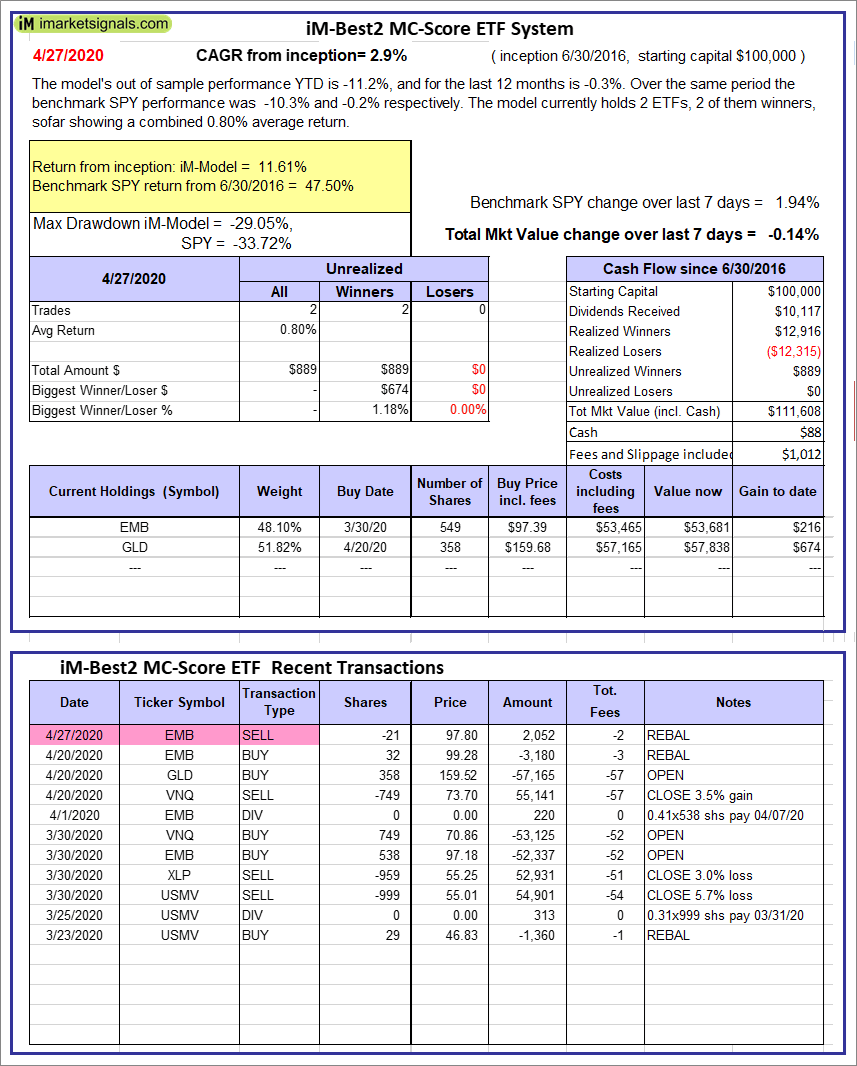 |
iM-Best2 MC-Score ETF System: The model’s out of sample performance YTD is -11.2%, and for the last 12 months is -0.3%. Over the same period the benchmark SPY performance was -10.3% and -0.2% respectively. Over the previous week the market value of the iM-Best2 MC-Score ETF System gained -0.14% at a time when SPY gained 1.94%. A starting capital of $100,000 at inception on 6/30/2016 would have grown to $111,608 which includes $88 cash and excludes $1,012 spent on fees and slippage. |
 |
iM-Best4 MC-Score Vanguard System: The model’s out of sample performance YTD is -16.2%, and for the last 12 months is -8.3%. Over the same period the benchmark SPY performance was -10.3% and -0.2% respectively. Over the previous week the market value of the iM-Best4 MC-Score Vanguard System gained 1.61% at a time when SPY gained 1.94%. A starting capital of $100,000 at inception on 6/30/2016 would have grown to $108,761 which includes $1,057 cash and excludes $00 spent on fees and slippage. |
 |
iM-Composite (SH-RSP) Timer: The model’s out of sample performance YTD is -29.7%, and for the last 12 months is -23.9%. Over the same period the benchmark SPY performance was -10.3% and -0.2% respectively. Over the previous week the market value of the iM-Composite (SH-RSP) Timer gained 3.19% at a time when SPY gained 1.94%. A starting capital of $100,000 at inception on 6/30/2016 would have grown to $107,757 which includes $3,151 cash and excludes $932 spent on fees and slippage. |
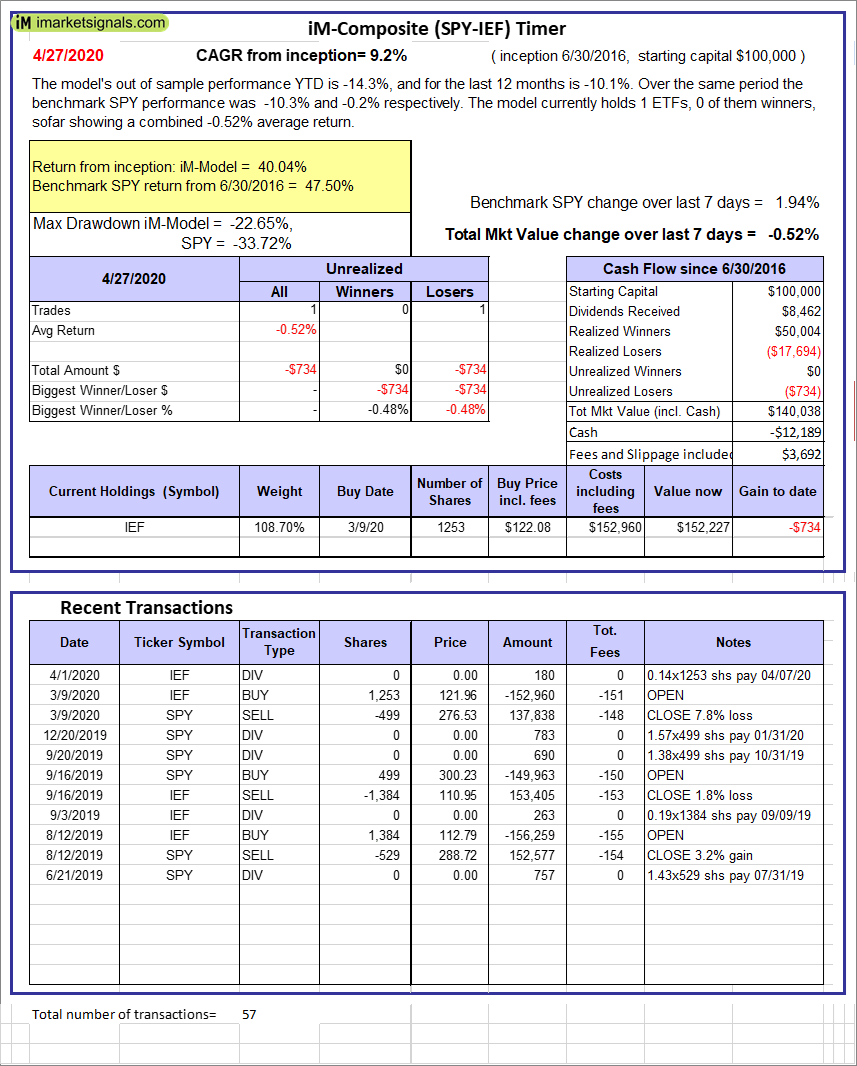 |
iM-Composite (SPY-IEF) Timer: The model’s out of sample performance YTD is -14.3%, and for the last 12 months is -10.1%. Over the same period the benchmark SPY performance was -10.3% and -0.2% respectively. Over the previous week the market value of the iM-Composite (SPY-IEF) Timer gained -0.52% at a time when SPY gained 1.94%. A starting capital of $100,000 at inception on 6/30/2016 would have grown to $140,038 which includes -$12,189 cash and excludes $3,692 spent on fees and slippage. |
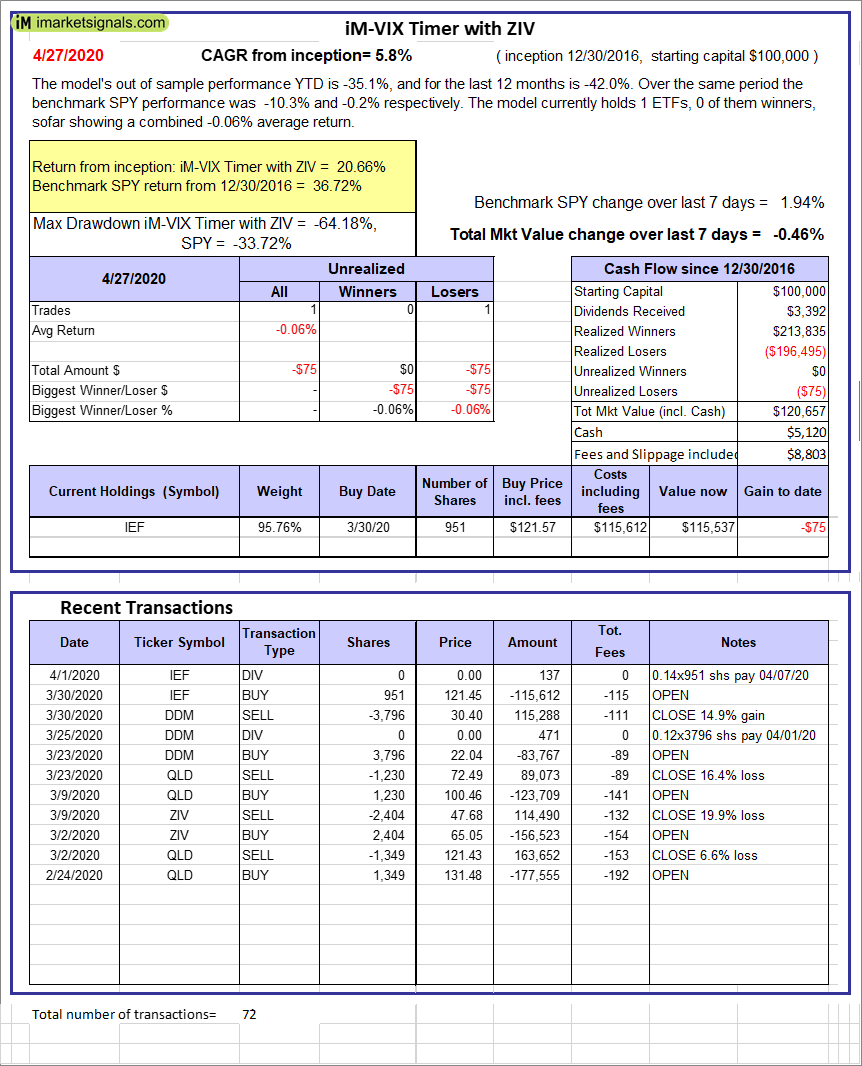 |
iM-VIX Timer with ZIV: The model’s out of sample performance YTD is -35.1%, and for the last 12 months is -42.0%. Over the same period the benchmark SPY performance was -10.3% and -0.2% respectively. Over the previous week the market value of the iM-VIX Timer with ZIV gained -0.46% at a time when SPY gained 1.94%. A starting capital of $100,000 at inception on 6/30/2016 would have grown to $120,657 which includes $5,120 cash and excludes $8,803 spent on fees and slippage. |
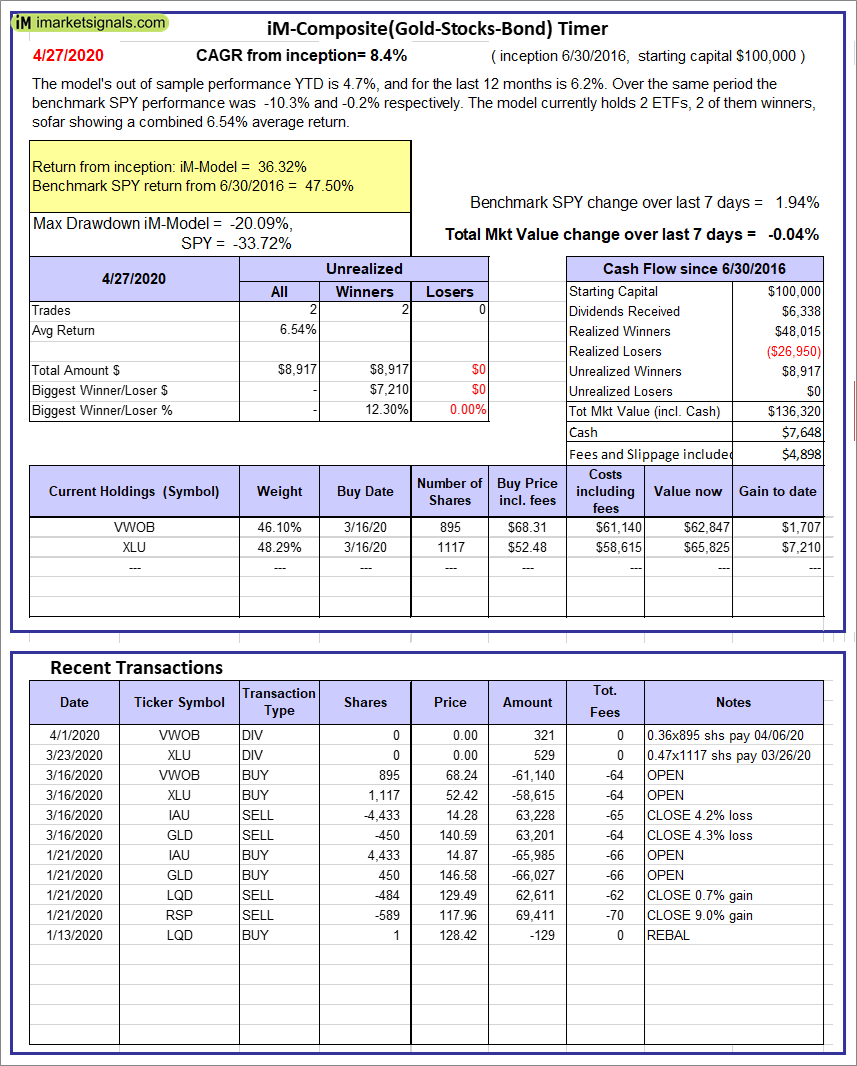 |
iM-Composite(Gold-Stocks-Bond) Timer: The model’s out of sample performance YTD is 4.7%, and for the last 12 months is 6.2%. Over the same period the benchmark SPY performance was -10.3% and -0.2% respectively. Over the previous week the market value of the iM-Composite(Gold-Stocks-Bond) Timer gained -0.04% at a time when SPY gained 1.94%. A starting capital of $100,000 at inception on 6/30/2016 would have grown to $136,320 which includes $7,648 cash and excludes $4,898 spent on fees and slippage. |
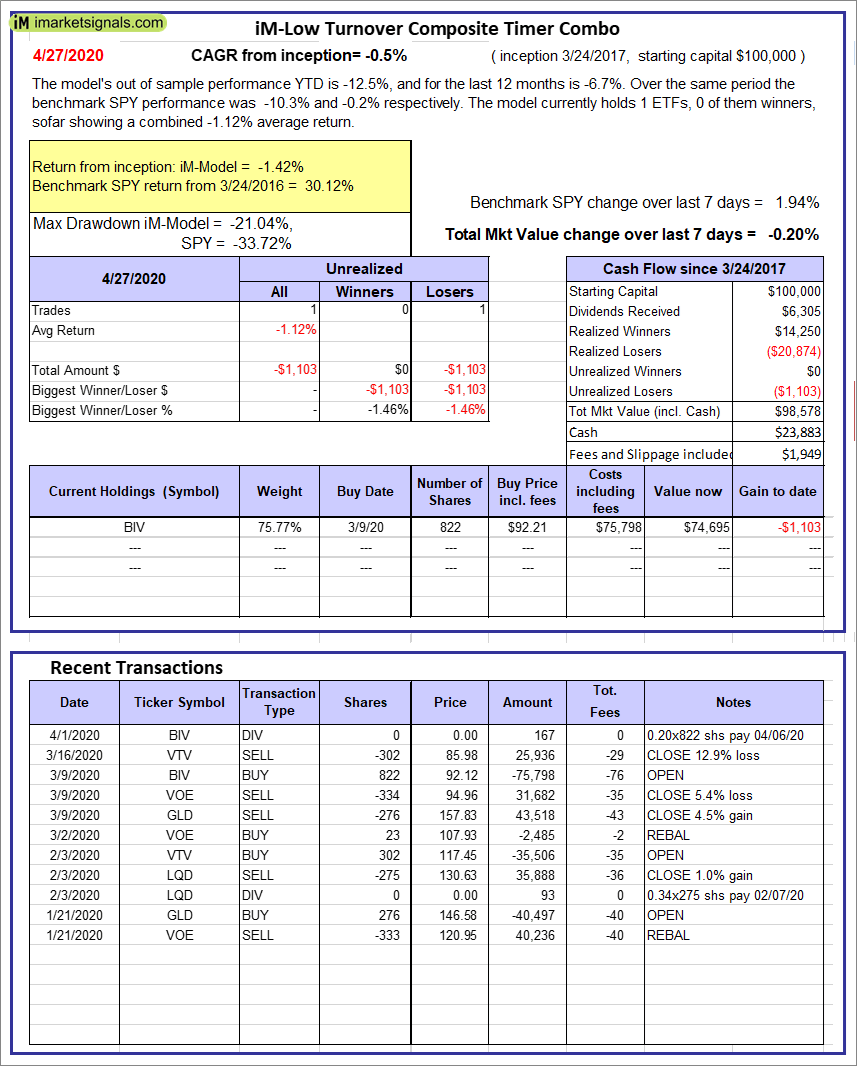 |
iM-Low Turnover Composite Timer Combo: The model’s out of sample performance YTD is -12.5%, and for the last 12 months is -6.7%. Over the same period the benchmark SPY performance was -10.3% and -0.2% respectively. Over the previous week the market value of the iM-Low Turnover Composite Timer Combo gained -0.20% at a time when SPY gained 1.94%. A starting capital of $100,000 at inception on 3/24/27 would have grown to $98,578 which includes $23,883 cash and excludes $1,949 spent on fees and slippage. |
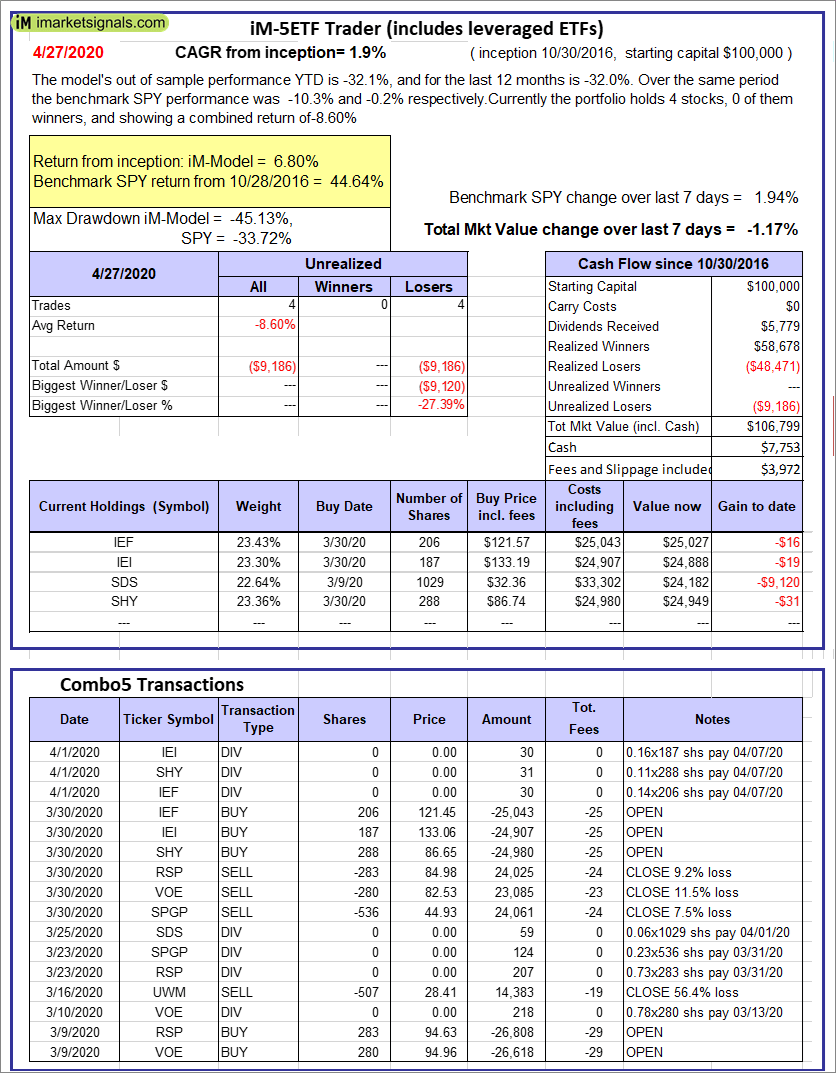 |
iM-5ETF Trader (includes leveraged ETFs): The model’s out of sample performance YTD is -32.1%, and for the last 12 months is -32.0%. Over the same period the benchmark SPY performance was -10.3% and -0.2% respectively. Over the previous week the market value of the iM-5ETF Trader (includes leveraged ETFs) gained -1.17% at a time when SPY gained 1.94%. A starting capital of $100,000 at inception on 10/30/2016 would have grown to $106,799 which includes $7,753 cash and excludes $3,972 spent on fees and slippage. |
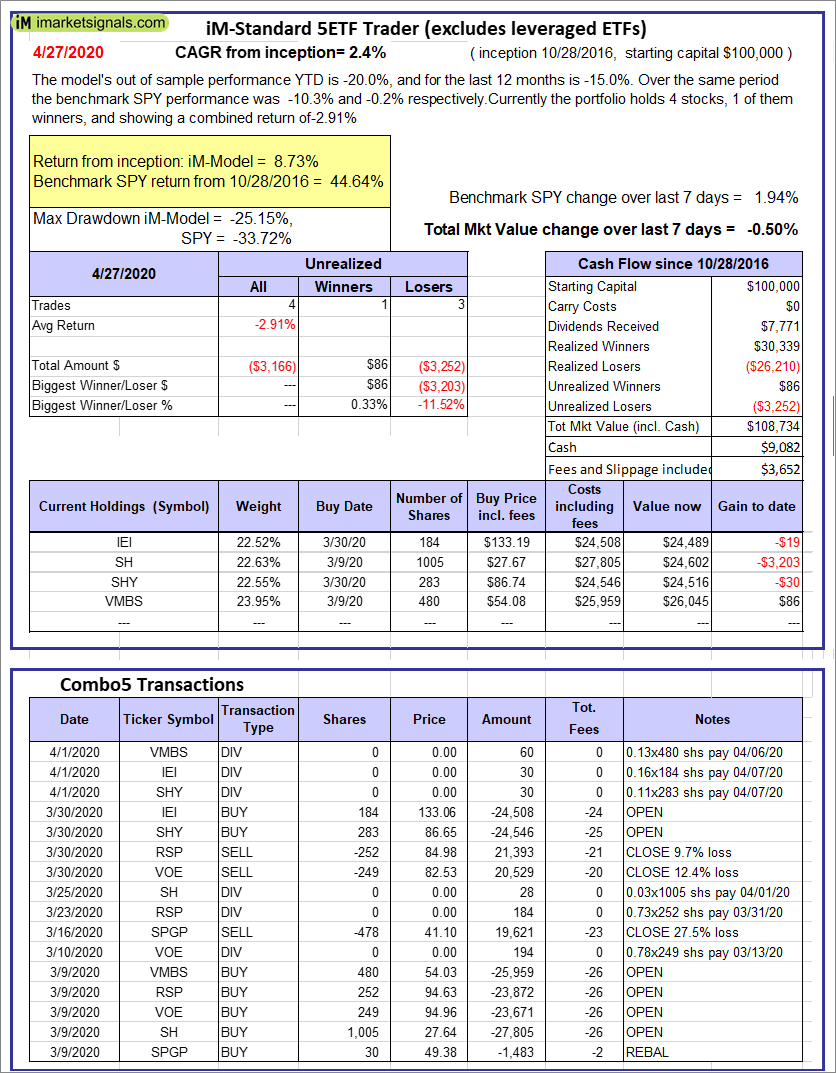 |
iM-Standard 5ETF Trader (excludes leveraged ETFs): The model’s out of sample performance YTD is -20.0%, and for the last 12 months is -15.0%. Over the same period the benchmark SPY performance was -10.3% and -0.2% respectively. Over the previous week the market value of the iM-Standard 5ETF Trader (excludes leveraged ETFs) gained -0.50% at a time when SPY gained 1.94%. A starting capital of $100,000 at inception on 10/30/2016 would have grown to $108,734 which includes $9,082 cash and excludes $3,652 spent on fees and slippage. |
iM-Best Reports – 4/27/2020
Posted in pmp SPY-SH
Leave a Reply
You must be logged in to post a comment.