
Bond-market:
 The BVR-model avoids high beta bonds (long-bonds) and also intermediate duration bonds.
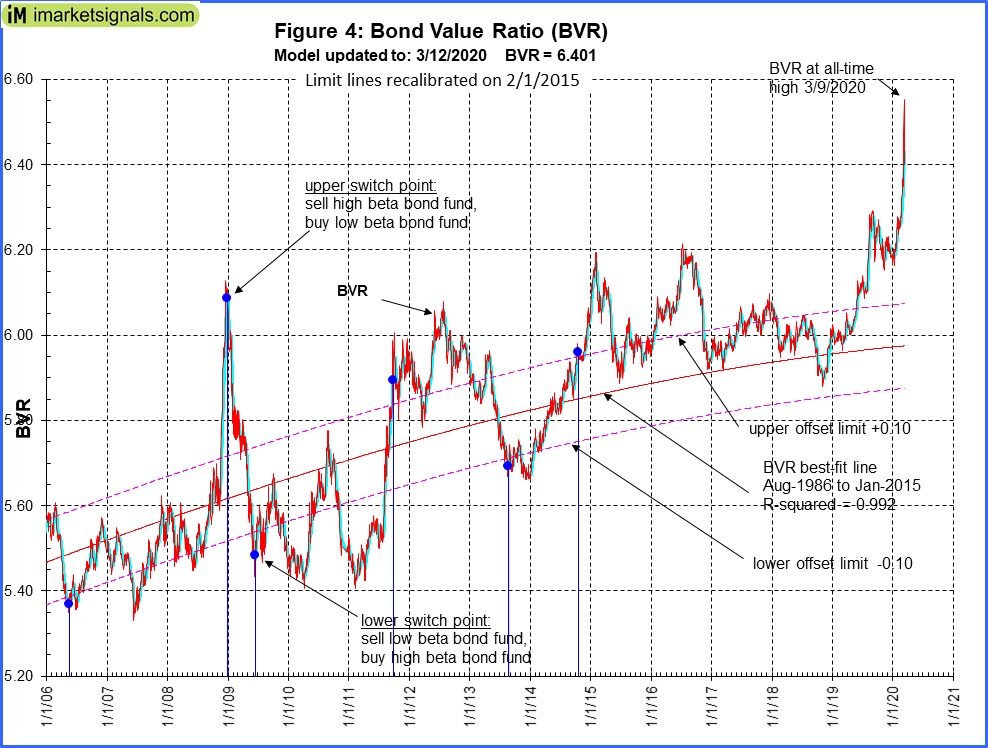
The Bond Value Ratio is shown in Fig 4. The BVR is again at a new record high. According to the model, only when BVR turns upward after having been lower than the lower offset-line should one consider long bonds again.
The Yield Curve:
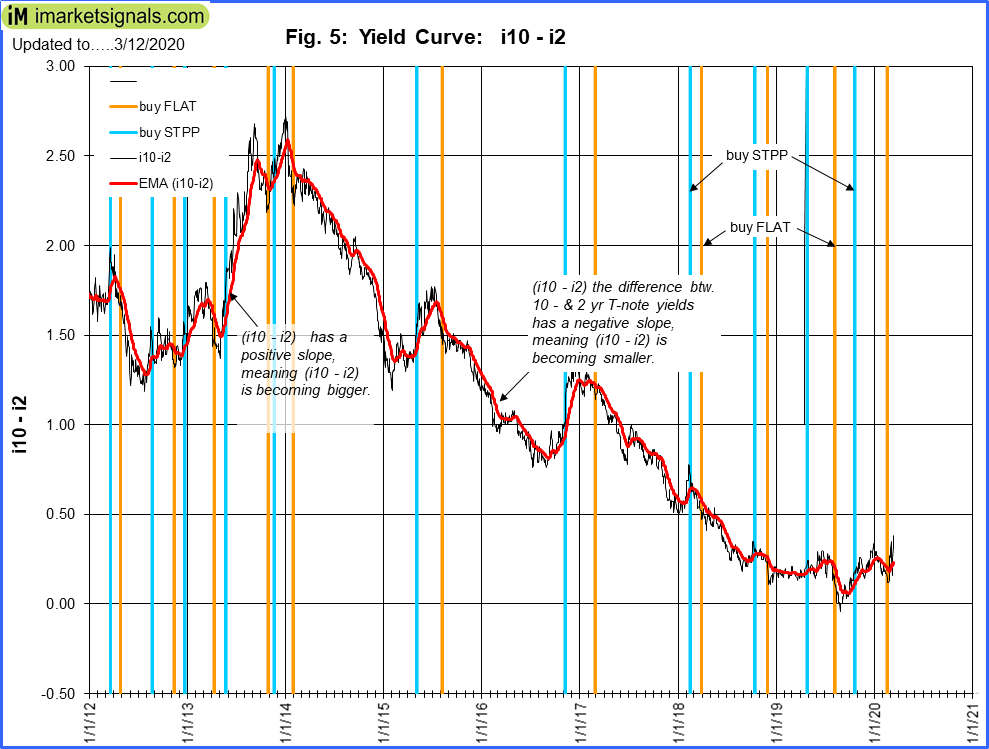 The yield curve model indicates the trend of the 10-year and 2-year Treasuries yield spread. Figure 5 charts (i10 – i2) shows that the yield curve is above last weeks level. FLAT and STPP are ETNs; STPP profits from a steepening yield curve and FLAT increases in value when the yield curve flattens. This model confirms the direction of the BVR.
Gold:
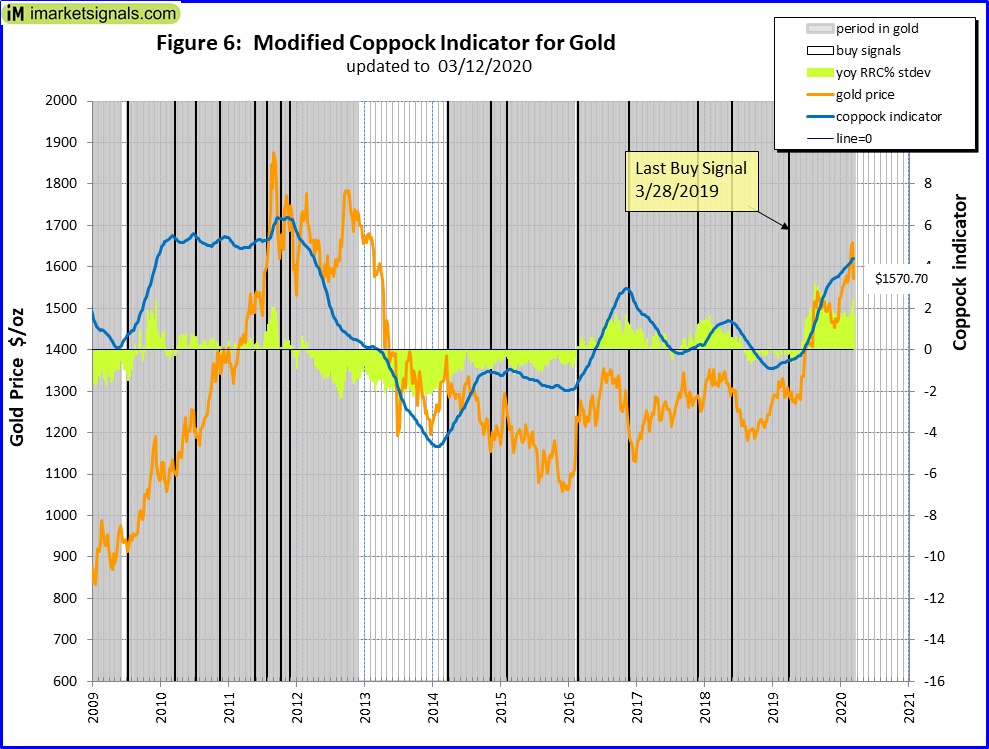 The modified Coppock Gold indicator shown in Fig 6. This model generated a new buy signal end March 2019 and is invested in gold.
This indicator is described in Is it Time to Buy Gold Again? – Wait for the buy signal …….
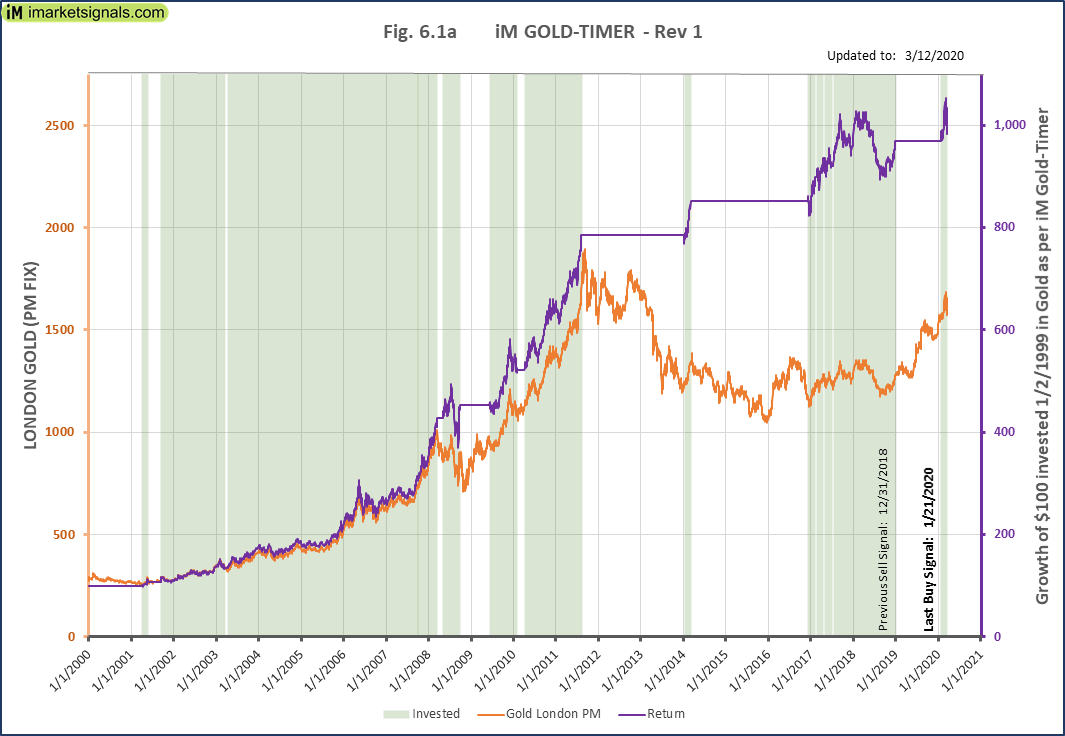 The iM GOLD-TIMER Rev-1 is invested in gold since 1/21/2020.
Silver:
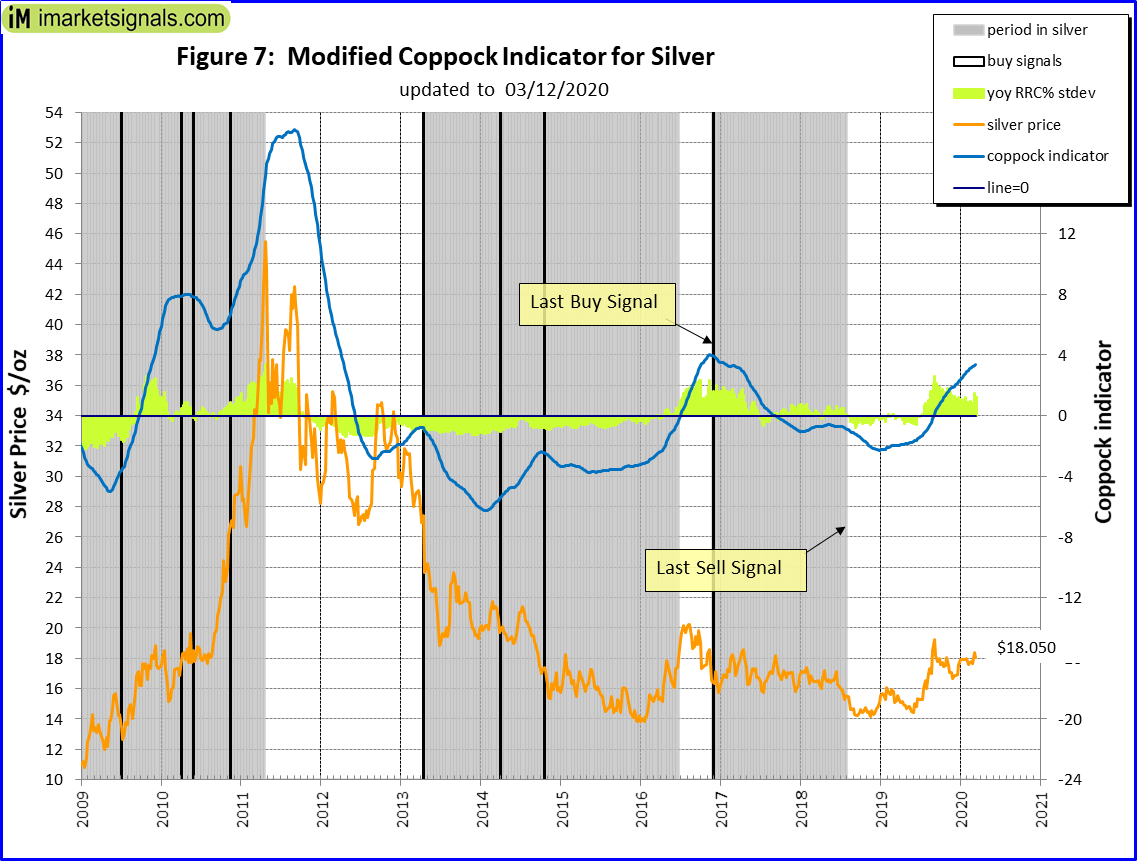 The modified Coppock Silver indicator shown in Fig 7. This model generated a sell signal early August 2018 and is in cash.
This indicator is described in Silver – Better Than Gold: A Modified Coppock Indicator for Silver.
Leave a Reply
You must be logged in to post a comment.