
  |
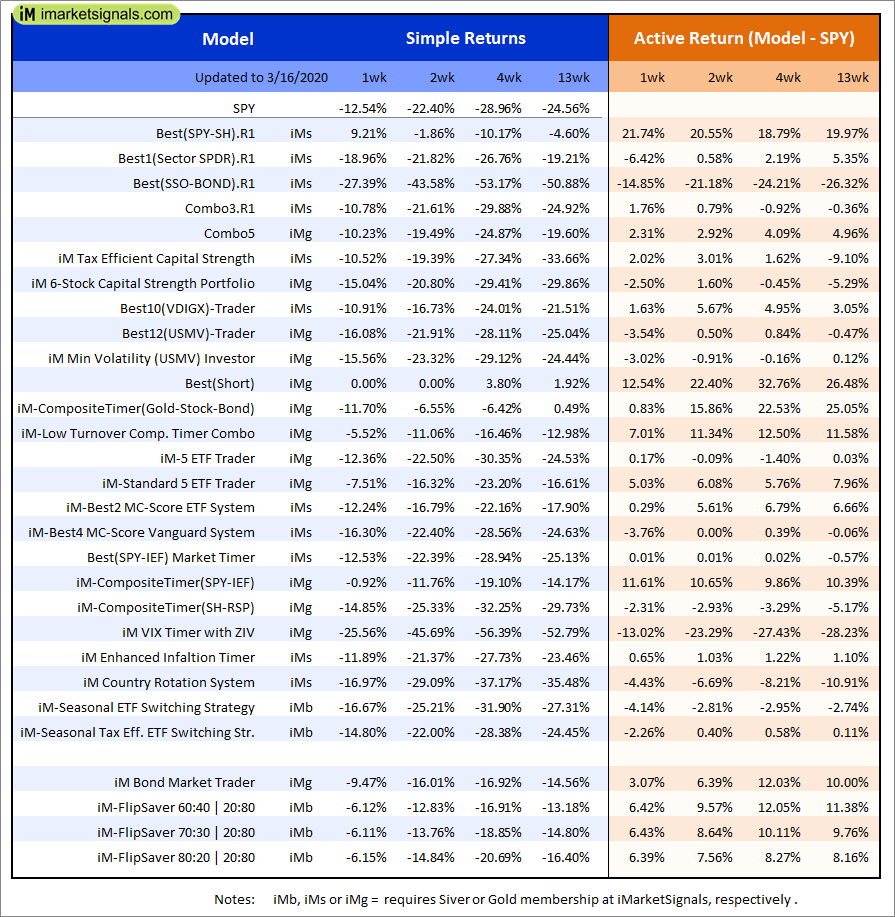
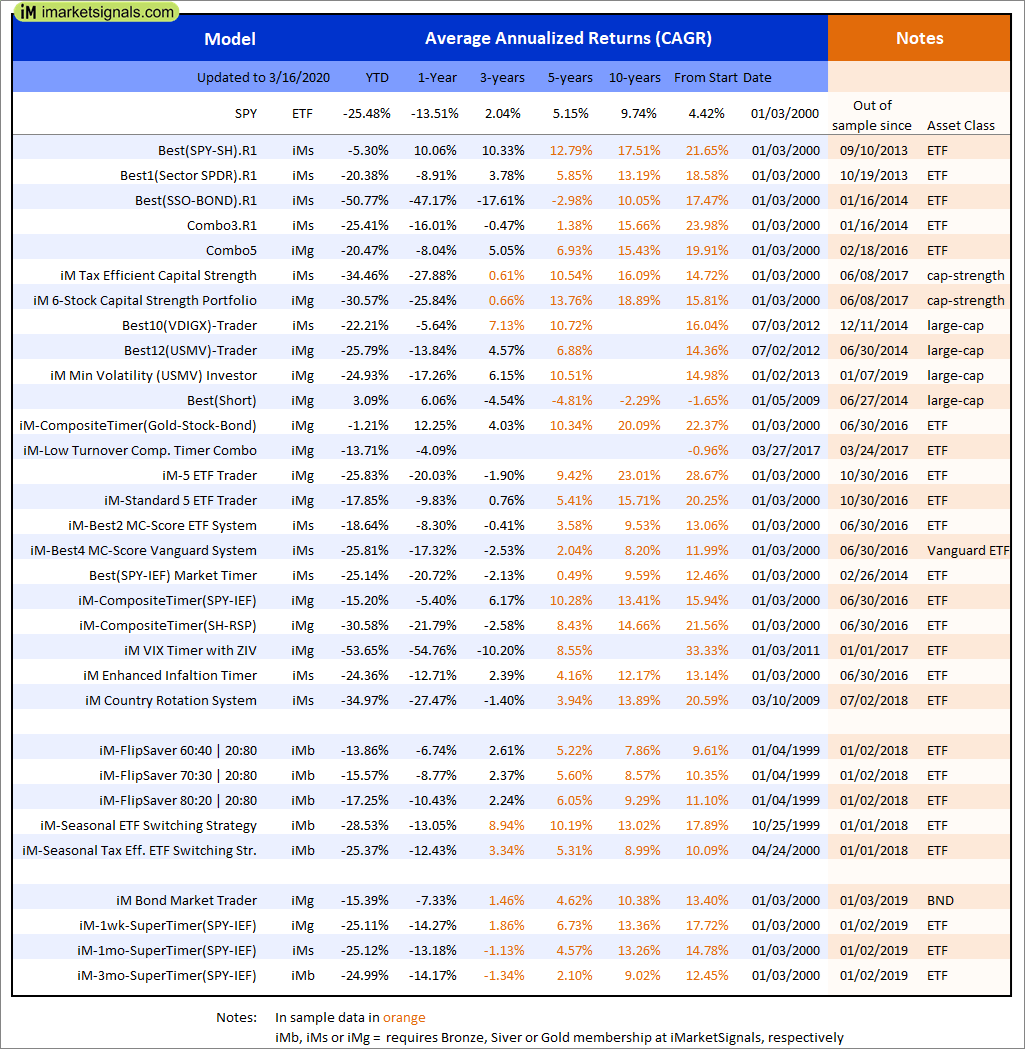
Out of sample performance summary of our models for the past 1, 2, 4 and 13 week periods. The active active return indicates how the models over- or underperformed the benchmark ETF SPY. Also the YTD, and the 1-, 3-, 5- and 10-year annualized returns are shown in the second table |
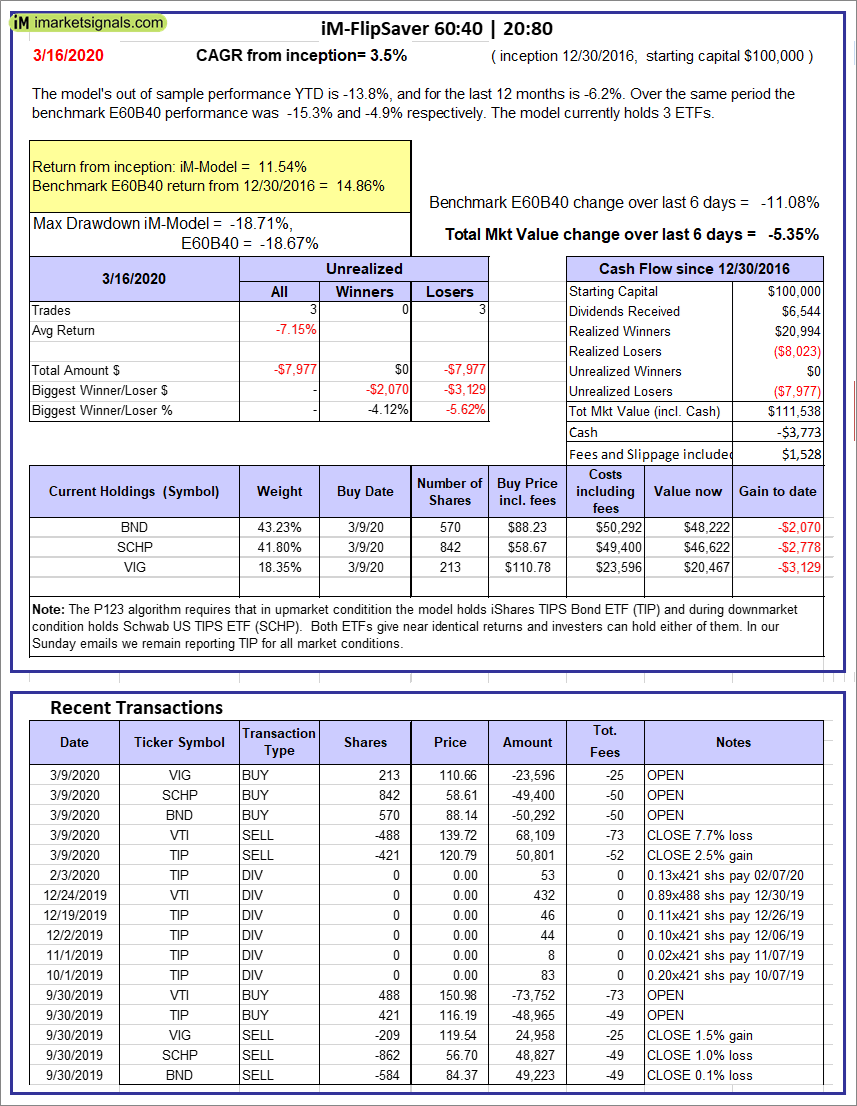 |
iM-FlipSaver 60:40 | 20:80 – 2017: The model’s out of sample performance YTD is -13.8%, and for the last 12 months is -6.2%. Over the same period the benchmark E60B40 performance was -15.3% and -4.9% respectively. Over the previous week the market value of iM-FlipSaver 80:20 | 20:80 gained -5.35% at a time when SPY gained -11.08%. A starting capital of $100,000 at inception on 7/16/2015 would have grown to $111,538 which includes -$3,773 cash and excludes $1,528 spent on fees and slippage. |
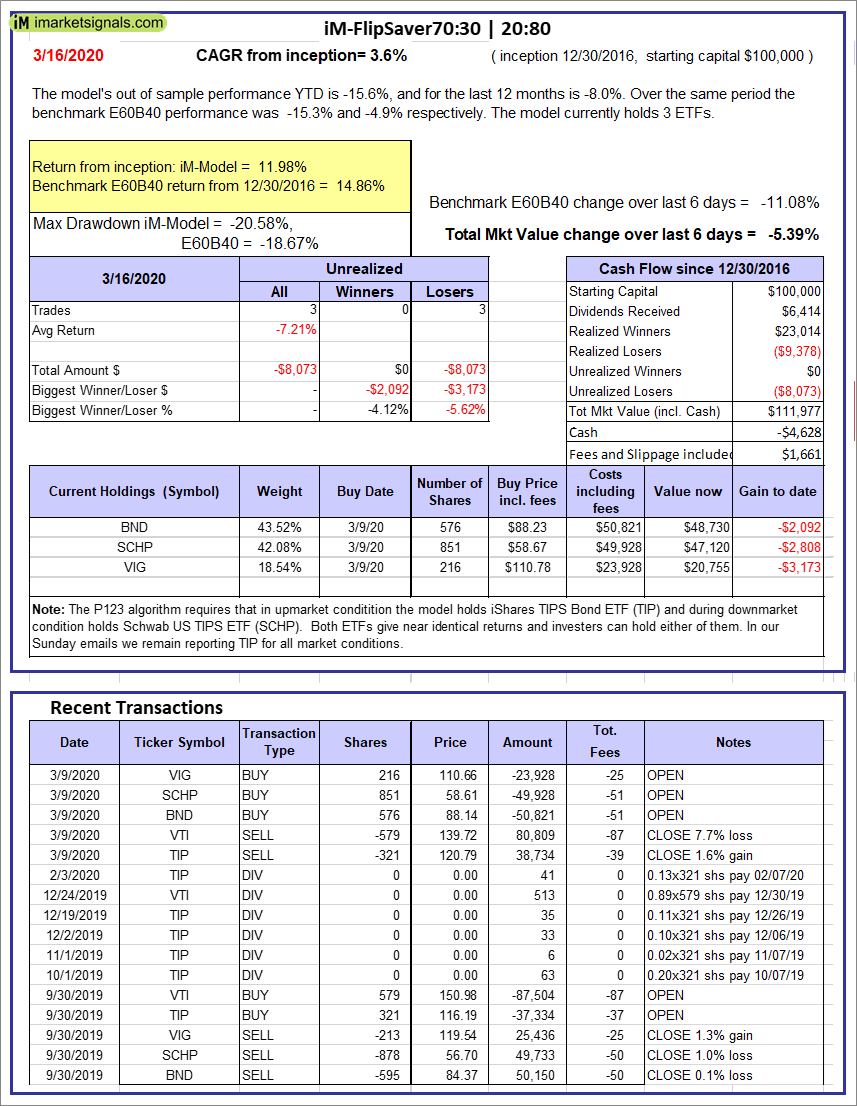 |
iM-FlipSaver 70:30 | 20:80 – 2017: The model’s out of sample performance YTD is -15.6%, and for the last 12 months is -8.0%. Over the same period the benchmark E60B40 performance was -15.3% and -4.9% respectively. Over the previous week the market value of iM-FlipSaver 70:30 | 20:80 gained -5.39% at a time when SPY gained -11.08%. A starting capital of $100,000 at inception on 7/15/2015 would have grown to $111,977 which includes -$4,628 cash and excludes $1,661 spent on fees and slippage. |
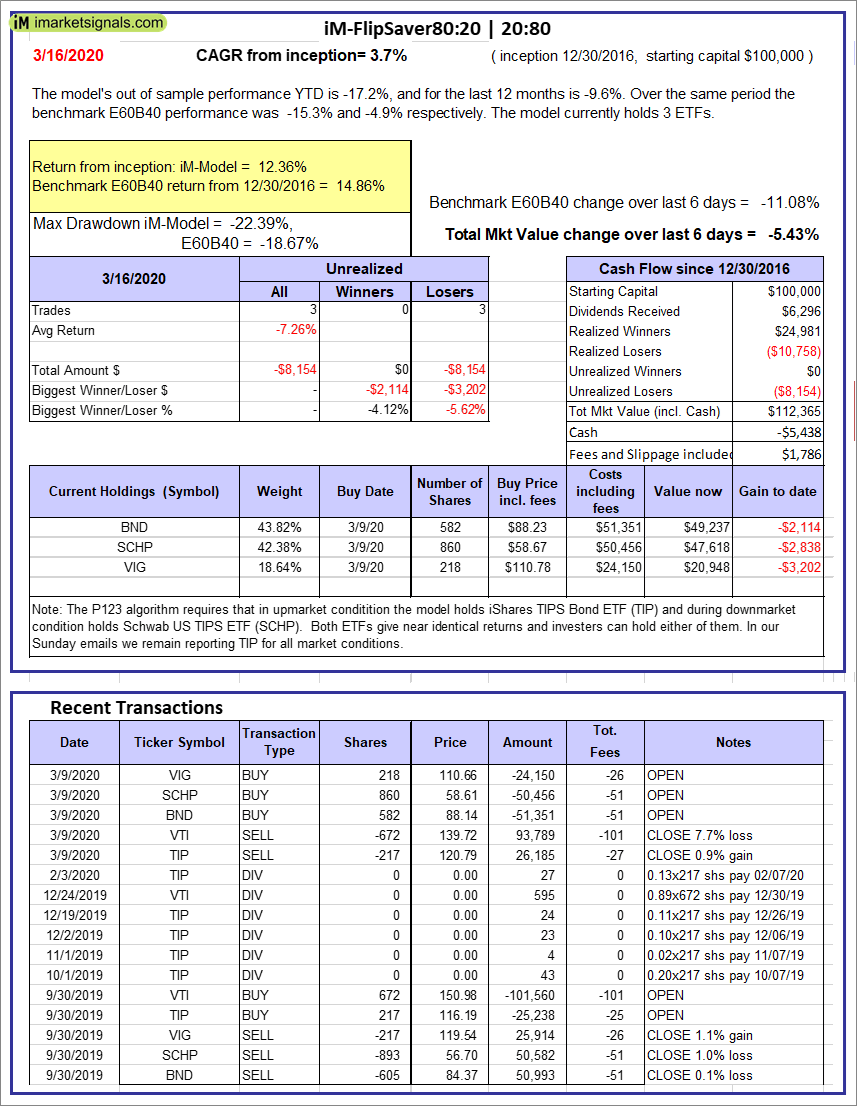 |
iM-FlipSaver 80:20 | 20:80 – 2017: The model’s out of sample performance YTD is -17.2%, and for the last 12 months is -9.6%. Over the same period the benchmark E60B40 performance was -15.3% and -4.9% respectively. Over the previous week the market value of iM-FlipSaver 80:20 | 20:80 gained -5.43% at a time when SPY gained -11.08%. A starting capital of $100,000 at inception on 1/2/2017 would have grown to $112,365 which includes -$5,438 cash and excludes $1,786 spent on fees and slippage. |
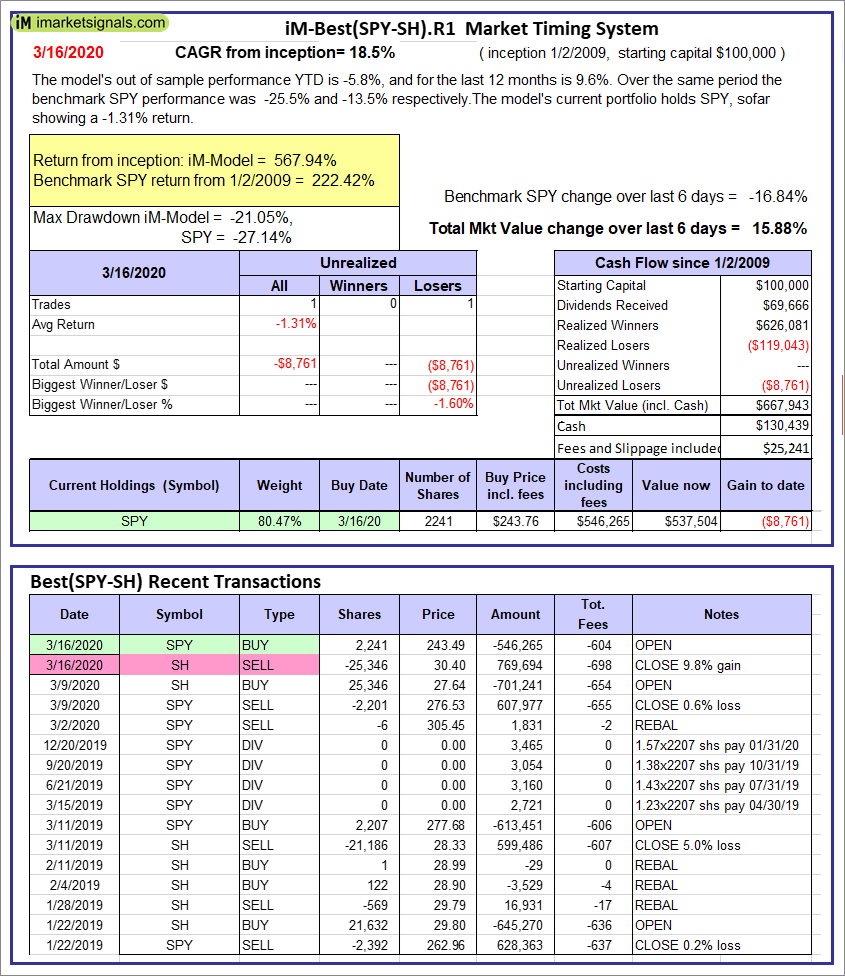 |
iM-Best(SPY-SH).R1: The model’s out of sample performance YTD is -5.8%, and for the last 12 months is 9.6%. Over the same period the benchmark SPY performance was -25.5% and -13.5% respectively. Over the previous week the market value of Best(SPY-SH) gained 15.88% at a time when SPY gained -16.84%. A starting capital of $100,000 at inception on 1/2/2009 would have grown to $667,943 which includes $130,439 cash and excludes $25,241 spent on fees and slippage. |
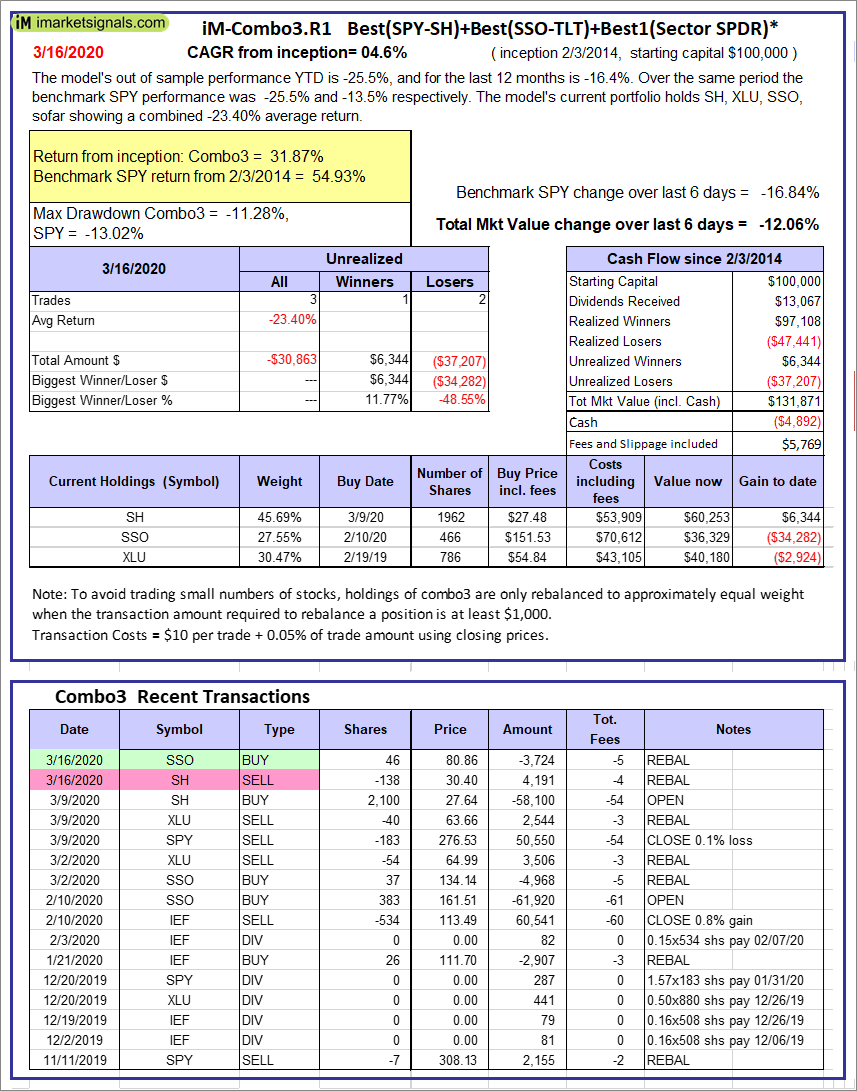 |
iM-Combo3.R1: The model’s out of sample performance YTD is -25.5%, and for the last 12 months is -16.4%. Over the same period the benchmark SPY performance was -25.5% and -13.5% respectively. Over the previous week the market value of iM-Combo3.R1 gained -12.06% at a time when SPY gained -16.84%. A starting capital of $100,000 at inception on 2/3/2014 would have grown to $131,871 which includes -$4,892 cash and excludes $5,769 spent on fees and slippage. |
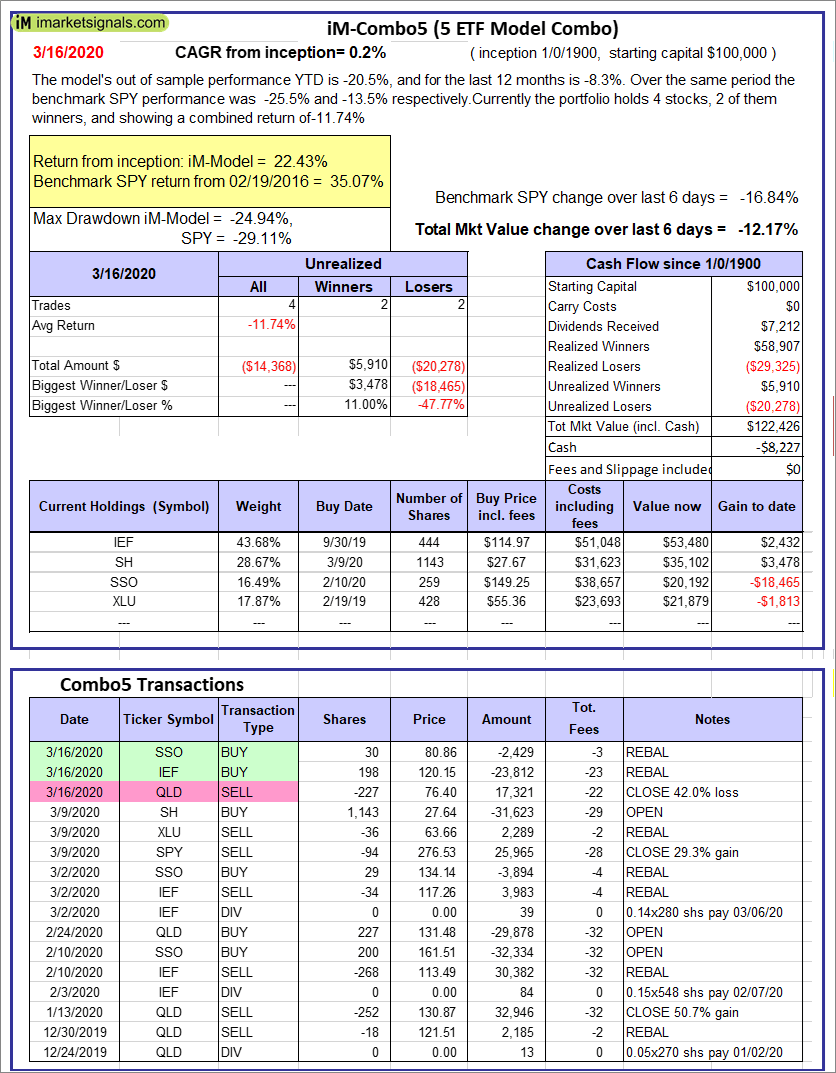 |
iM-Combo5: The model’s out of sample performance YTD is -20.5%, and for the last 12 months is -8.3%. Over the same period the benchmark SPY performance was -25.5% and -13.5% respectively. Over the previous week the market value of iM-Combo5 gained -12.17% at a time when SPY gained -16.84%. A starting capital of $100,000 at inception on 2/22/2016 would have grown to $122,426 which includes -$8,227 cash and excludes $0 spent on fees and slippage. |
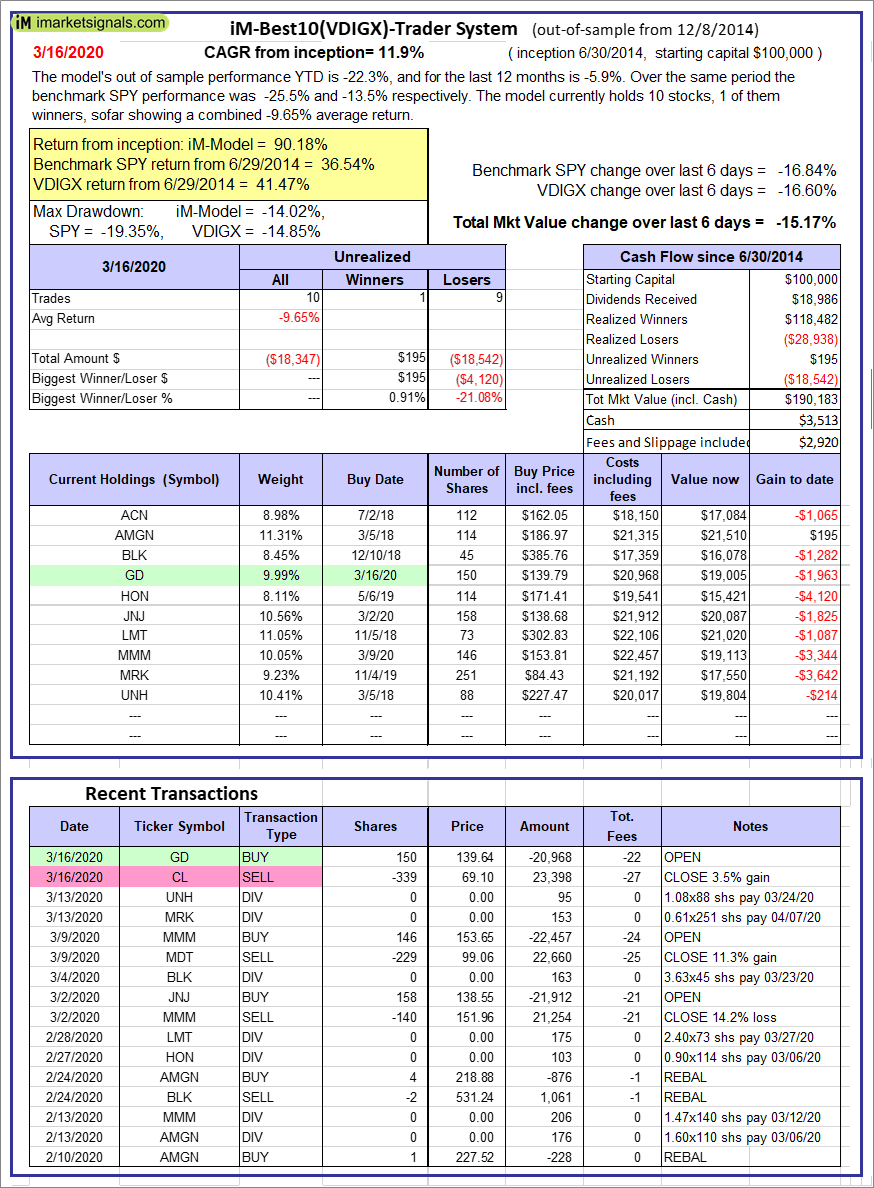 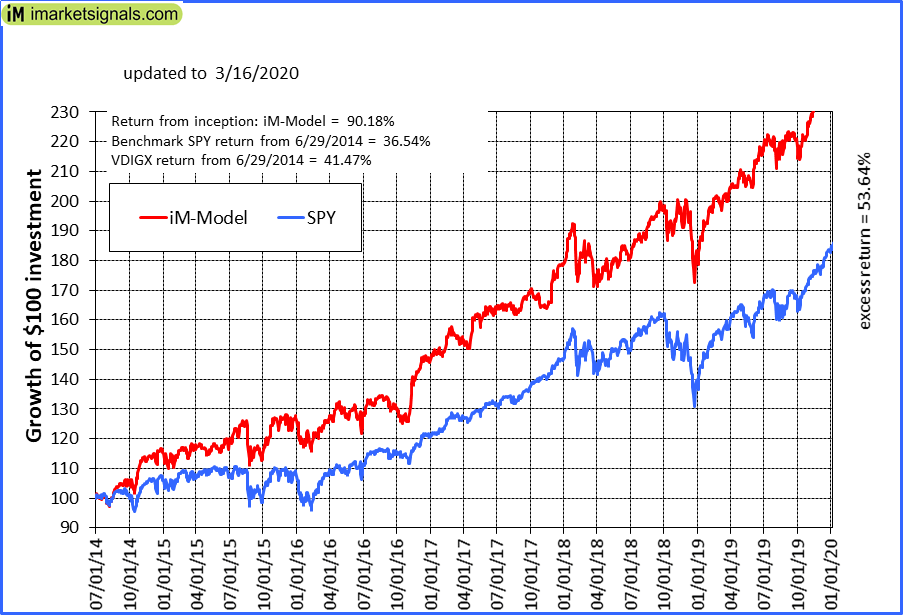 |
iM-Best10(VDIGX)-Trader: The model’s out of sample performance YTD is -22.3%, and for the last 12 months is -5.9%. Over the same period the benchmark SPY performance was -25.5% and -13.5% respectively. Since inception, on 7/1/2014, the model gained 90.18% while the benchmark SPY gained 36.54% and VDIGX gained 41.47% over the same period. Over the previous week the market value of iM-Best10(VDIGX) gained -15.17% at a time when SPY gained -16.84%. A starting capital of $100,000 at inception on 7/1/2014 would have grown to $190,183 which includes $3,513 cash and excludes $2,920 spent on fees and slippage. |
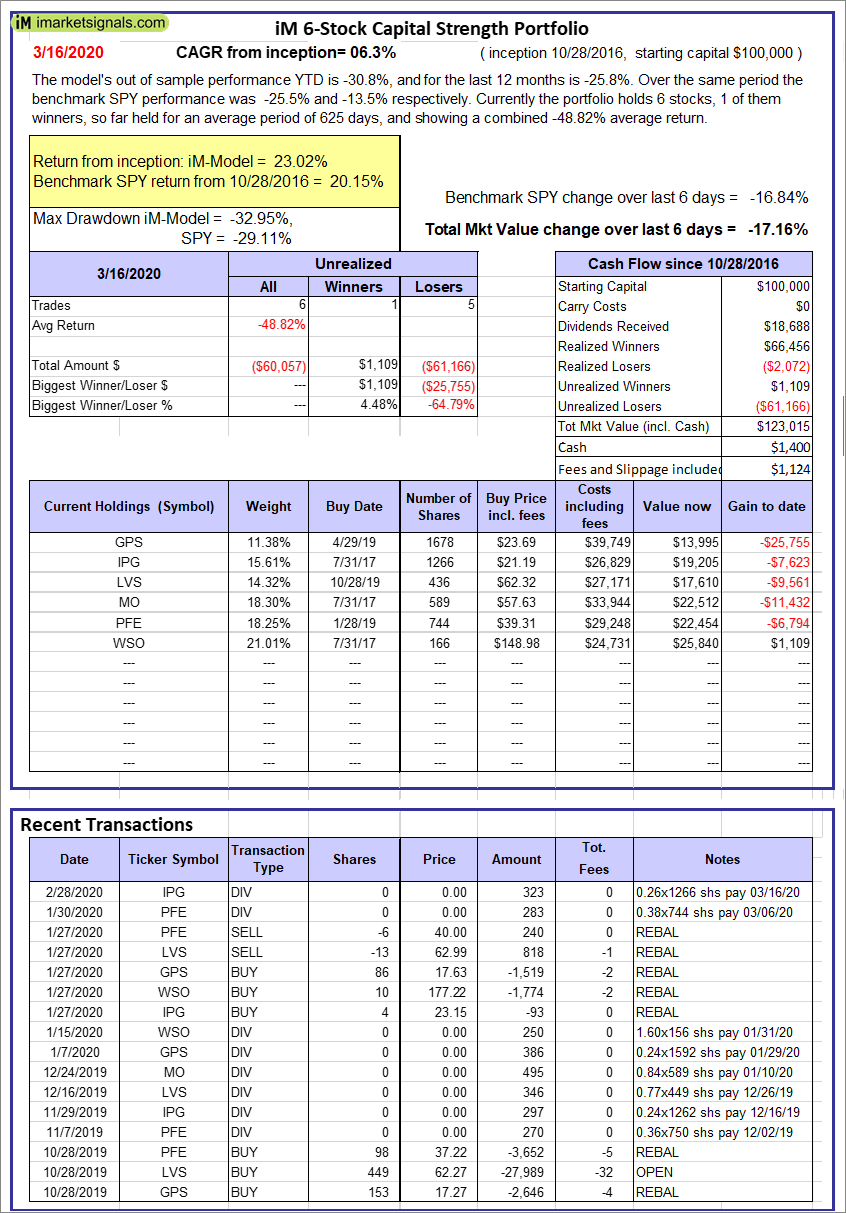 |
iM 6-Stock Capital Strength Portfolio: The model’s out of sample performance YTD is -30.8%, and for the last 12 months is -25.8%. Over the same period the benchmark SPY performance was -25.5% and -13.5% respectively. Over the previous week the market value of the iM 6-Stock Capital Strength Portfolio gained -17.16% at a time when SPY gained -16.84%. A starting capital of $100,000 at inception on 10/28/2016 would have grown to $123,015 which includes $1,400 cash and excludes $1,124 spent on fees and slippage. |
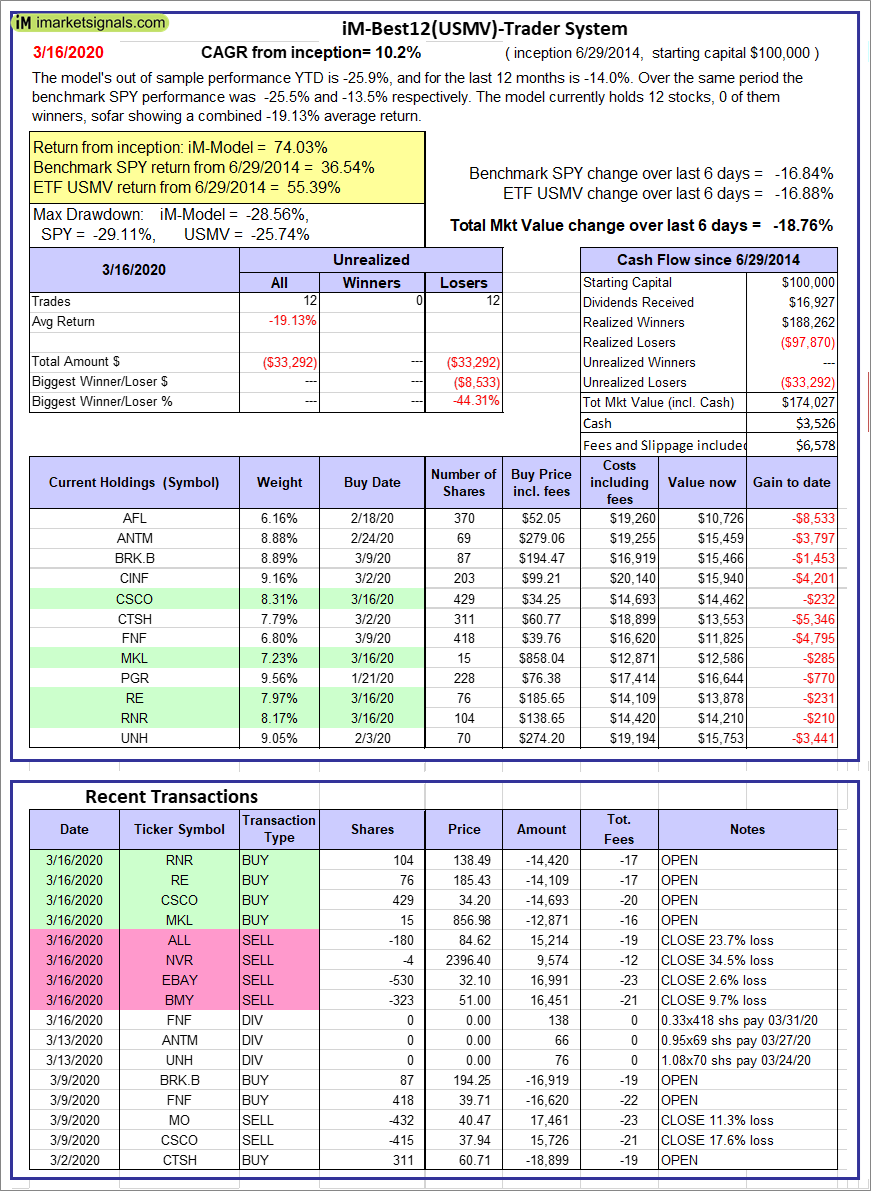 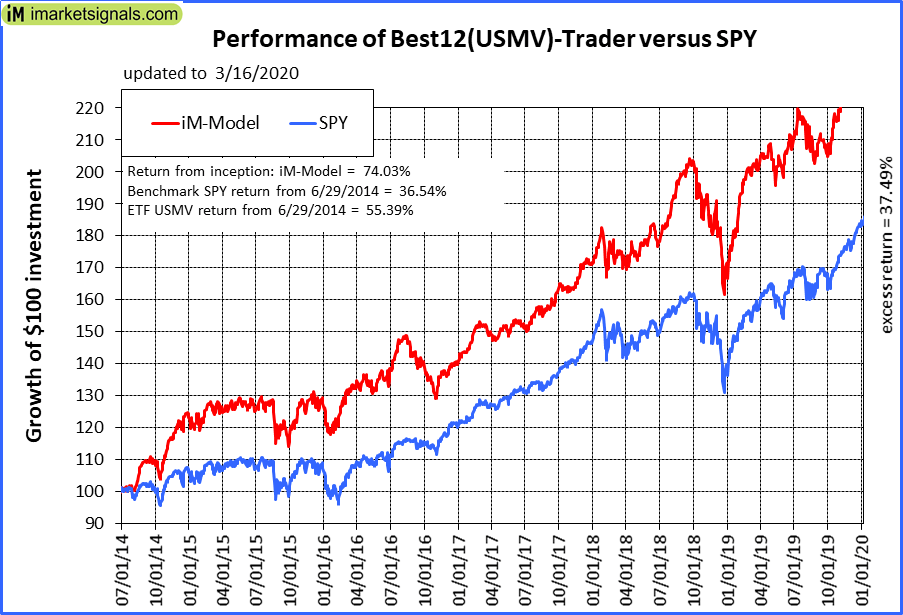 |
iM-Best12(USMV)-Trader: The model’s out of sample performance YTD is -25.9%, and for the last 12 months is -14.0%. Over the same period the benchmark SPY performance was -25.5% and -13.5% respectively. Since inception, on 6/30/2014, the model gained 74.03% while the benchmark SPY gained 36.54% and the ETF USMV gained 55.39% over the same period. Over the previous week the market value of iM-Best12(USMV)-Trader gained -18.76% at a time when SPY gained -16.84%. A starting capital of $100,000 at inception on 6/30/2014 would have grown to $174,027 which includes $3,526 cash and excludes $6,578 spent on fees and slippage. |
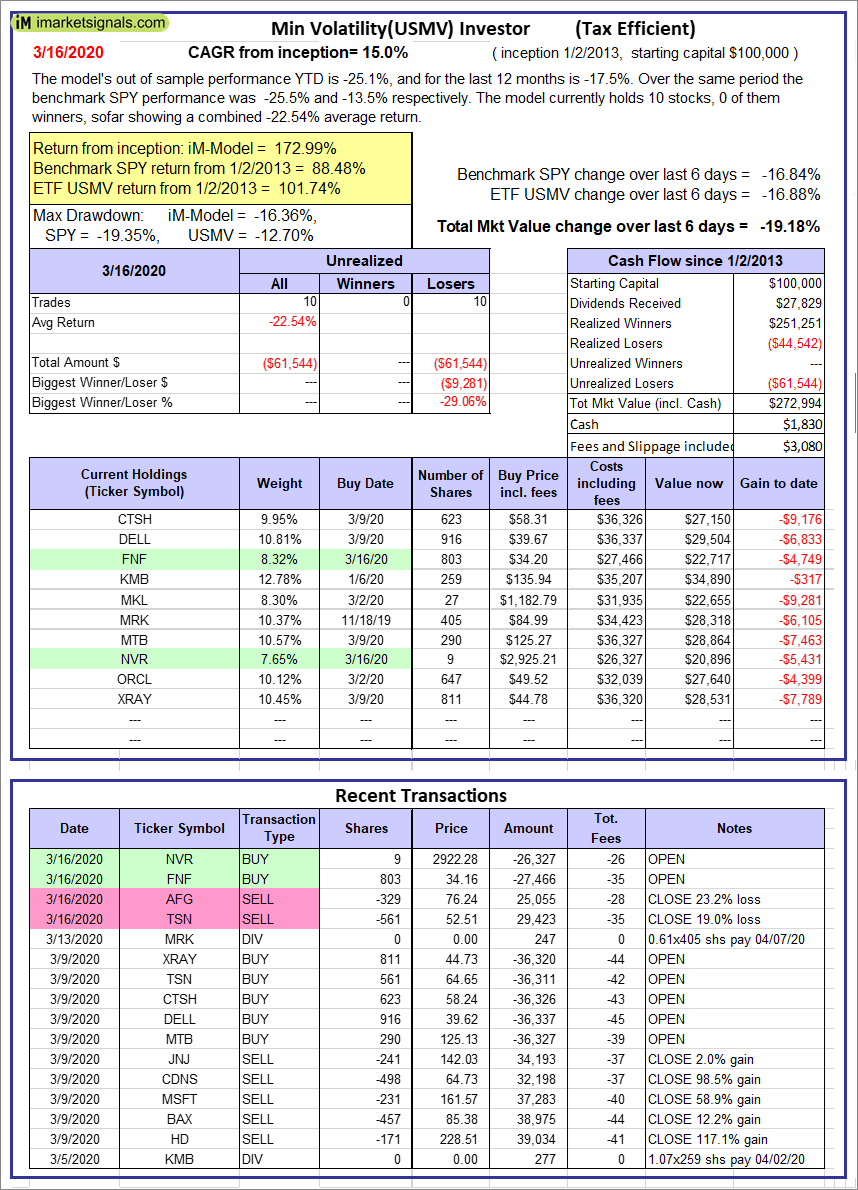 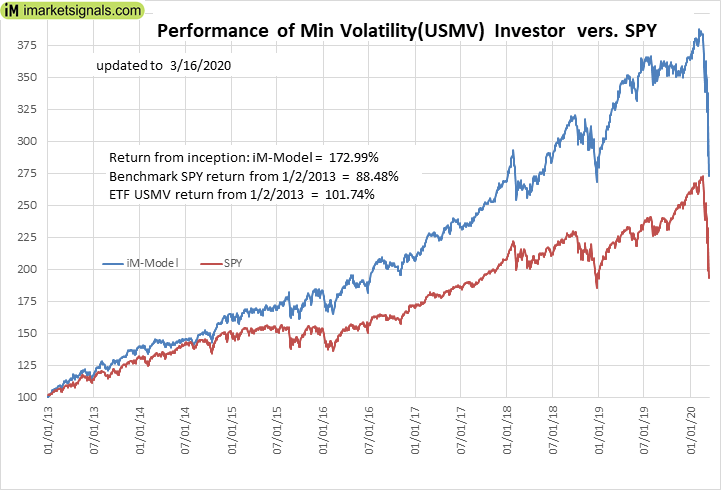 |
iM-Min Volatility(USMV) Investor (Tax Efficient): The model’s out of sample performance YTD is -25.1%, and for the last 12 months is -17.5%. Over the same period the benchmark SPY performance was -25.5% and -13.5% respectively. Since inception, on 1/3/2013, the model gained 172.99% while the benchmark SPY gained 88.48% and the ETF USMV gained 101.74% over the same period. Over the previous week the market value of iM-Best12(USMV)Q1 gained -19.18% at a time when SPY gained -16.84%. A starting capital of $100,000 at inception on 1/3/2013 would have grown to $272,994 which includes $1,830 cash and excludes $3,080 spent on fees and slippage. |
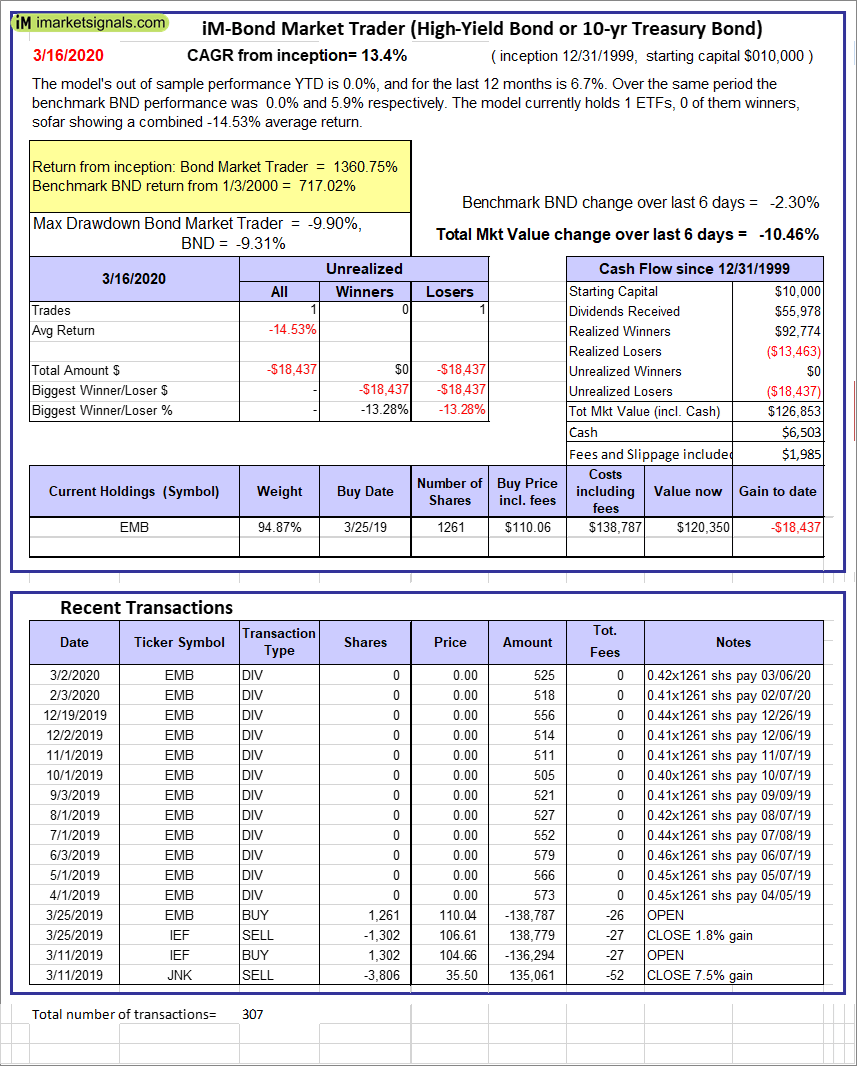 |
iM-Bond Market Trader (High-Yield Bond or 10-yr Treasury Bond): The model’s out of sample performance YTD is -25.9%, and for the last 12 months is -20.3%. Over the same period the benchmark SPY performance was -25.5% and -13.5% respectively. Over the previous week the market value of the iM-Bond Market Trader (High-Yield Bond or 10-yr Treasury Bond) gained -10.46% at a time when BND gained -2.30%. A starting capital of $100,000 at inception on 10/30/2016 would have grown to $126,853 which includes $6,503 cash and excludes $1,985 spent on fees and slippage. |
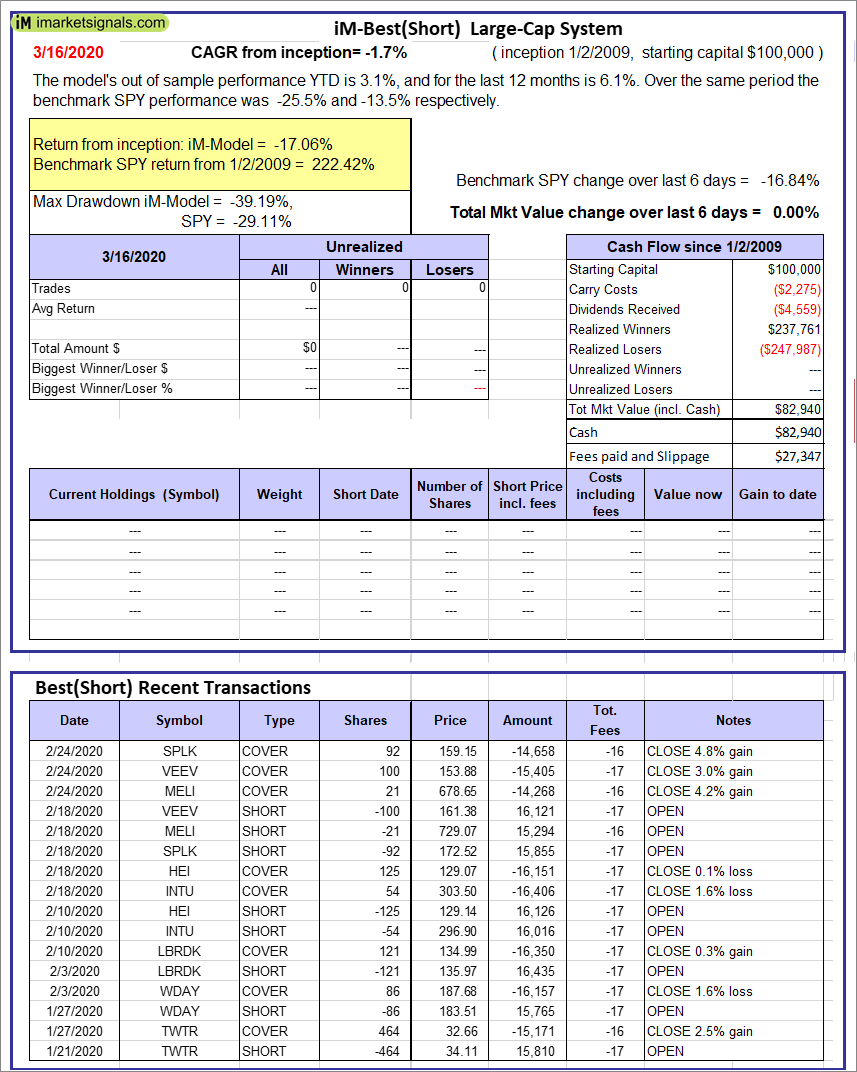 |
iM-Best(Short): The model’s out of sample performance YTD is 3.1%, and for the last 12 months is 6.1%. Over the same period the benchmark SPY performance was -25.5% and -13.5% respectively. Over the previous week the market value of iM-Best(Short) gained 0.00% at a time when SPY gained -16.84%. Over the period 1/2/2009 to 3/16/2020 the starting capital of $100,000 would have grown to $82,940 which includes $82,940 cash and excludes $27,347 spent on fees and slippage. |
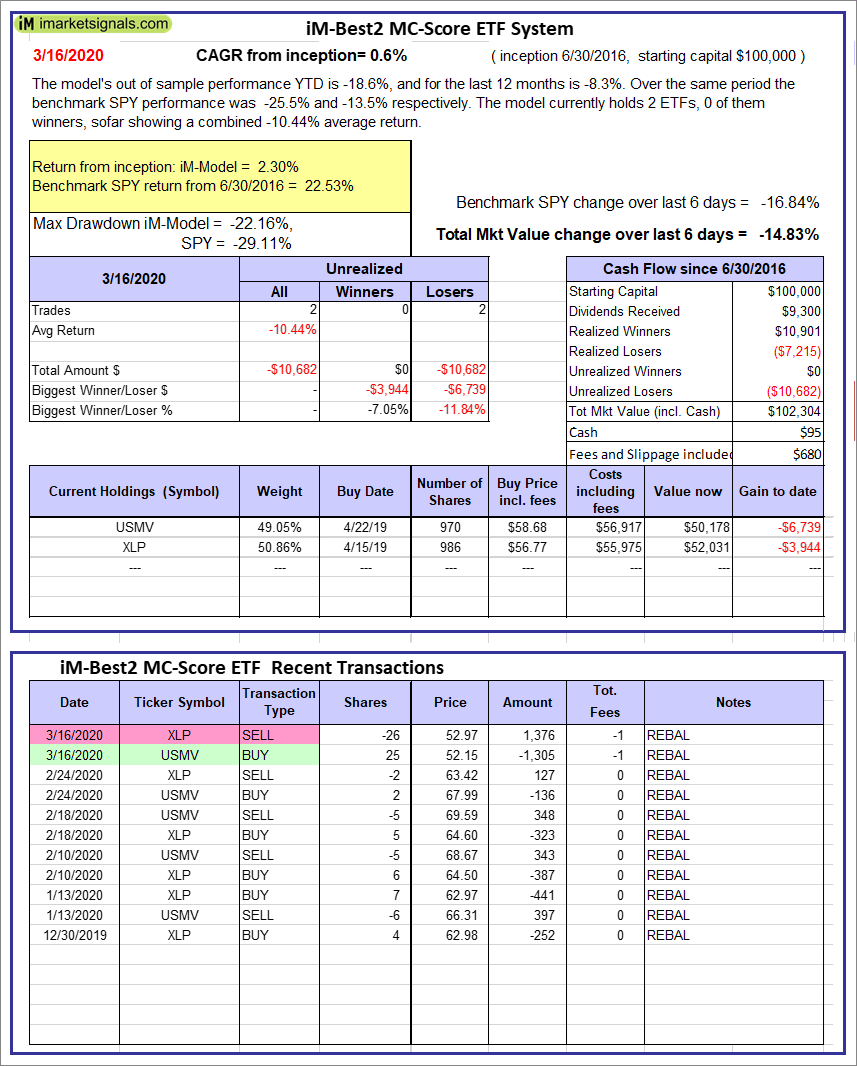 |
iM-Best2 MC-Score ETF System: The model’s out of sample performance YTD is -18.6%, and for the last 12 months is -8.3%. Over the same period the benchmark SPY performance was -25.5% and -13.5% respectively. Over the previous week the market value of the iM-Best2 MC-Score ETF System gained -14.83% at a time when SPY gained -16.84%. A starting capital of $100,000 at inception on 6/30/2016 would have grown to $102,304 which includes $95 cash and excludes $680 spent on fees and slippage. |
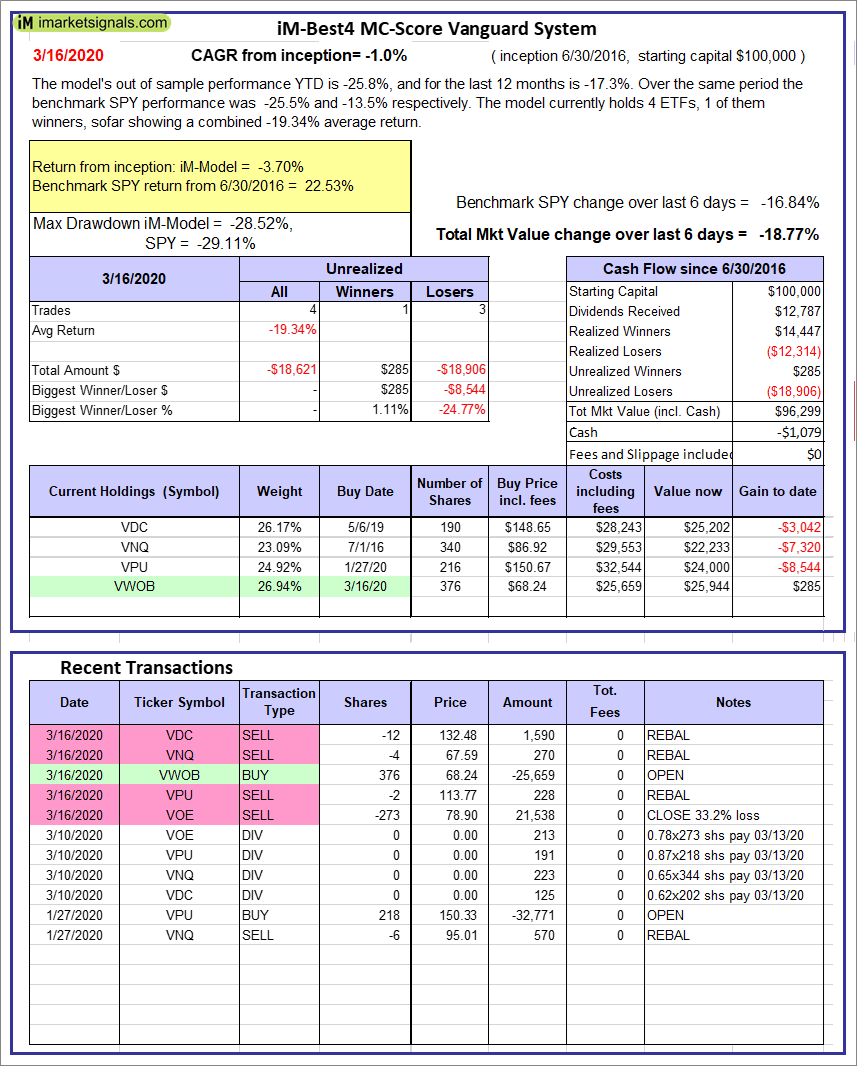 |
iM-Best4 MC-Score Vanguard System: The model’s out of sample performance YTD is -25.8%, and for the last 12 months is -17.3%. Over the same period the benchmark SPY performance was -25.5% and -13.5% respectively. Over the previous week the market value of the iM-Best4 MC-Score Vanguard System gained -18.77% at a time when SPY gained -16.84%. A starting capital of $100,000 at inception on 6/30/2016 would have grown to $96,299 which includes -$1,079 cash and excludes $00 spent on fees and slippage. |
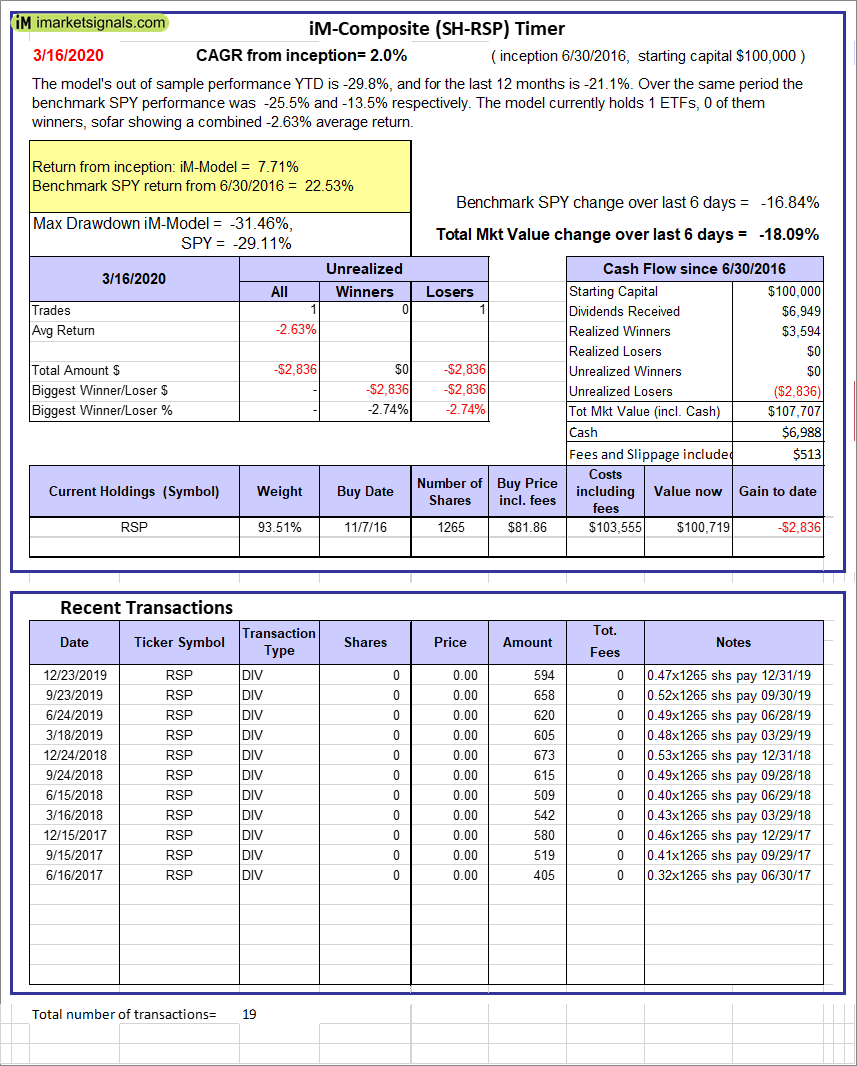 |
iM-Composite (SH-RSP) Timer: The model’s out of sample performance YTD is -29.8%, and for the last 12 months is -21.1%. Over the same period the benchmark SPY performance was -25.5% and -13.5% respectively. Over the previous week the market value of the iM-Composite (SH-RSP) Timer gained -18.09% at a time when SPY gained -16.84%. A starting capital of $100,000 at inception on 6/30/2016 would have grown to $107,707 which includes $6,988 cash and excludes $513 spent on fees and slippage. |
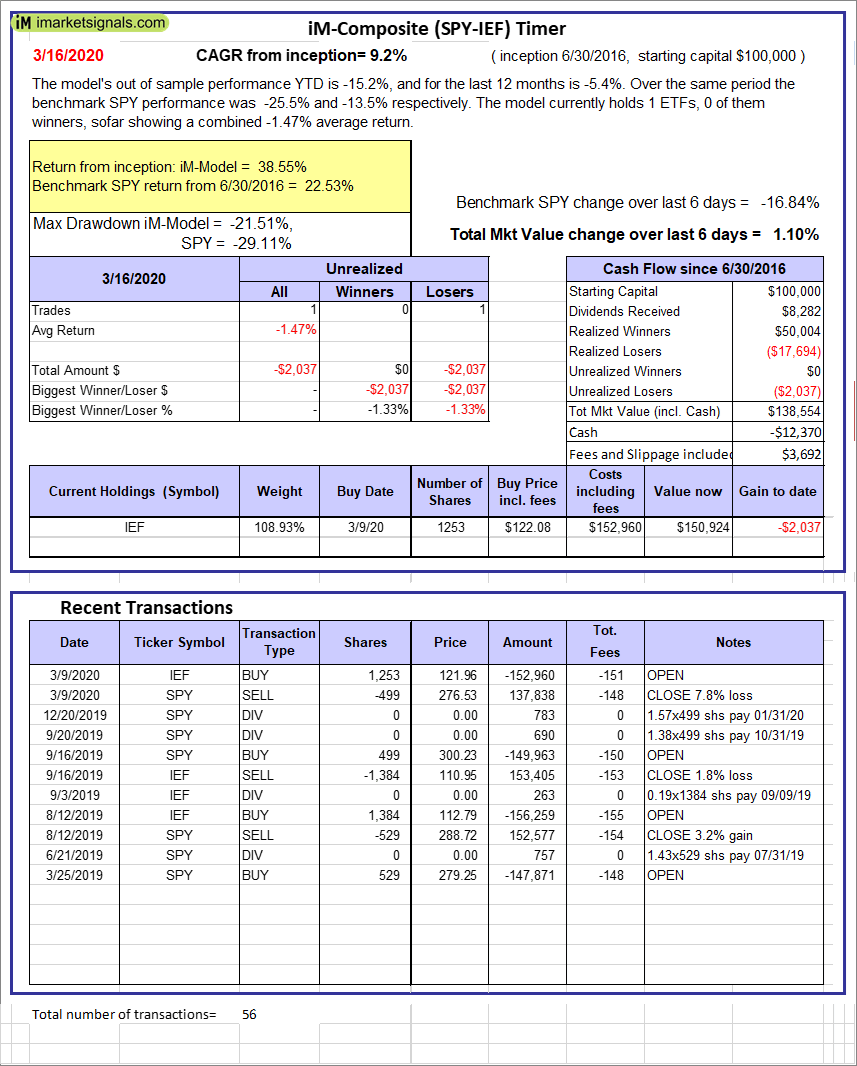 |
iM-Composite (SPY-IEF) Timer: The model’s out of sample performance YTD is -15.2%, and for the last 12 months is -5.4%. Over the same period the benchmark SPY performance was -25.5% and -13.5% respectively. Over the previous week the market value of the iM-Composite (SPY-IEF) Timer gained 1.10% at a time when SPY gained -16.84%. A starting capital of $100,000 at inception on 6/30/2016 would have grown to $138,554 which includes -$12,370 cash and excludes $3,692 spent on fees and slippage. |
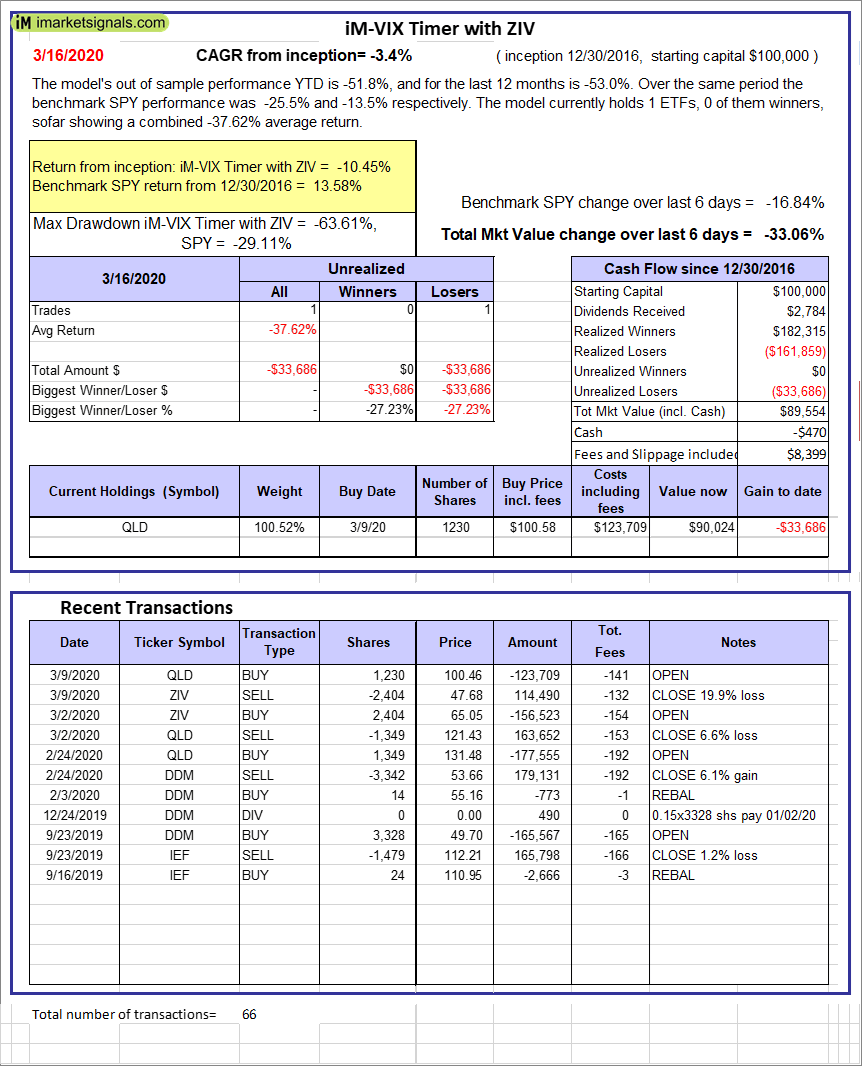 |
iM-VIX Timer with ZIV: The model’s out of sample performance YTD is -51.8%, and for the last 12 months is -53.0%. Over the same period the benchmark SPY performance was -25.5% and -13.5% respectively. Over the previous week the market value of the iM-VIX Timer with ZIV gained -33.06% at a time when SPY gained -16.84%. A starting capital of $100,000 at inception on 6/30/2016 would have grown to $89,554 which includes -$470 cash and excludes $8,399 spent on fees and slippage. |
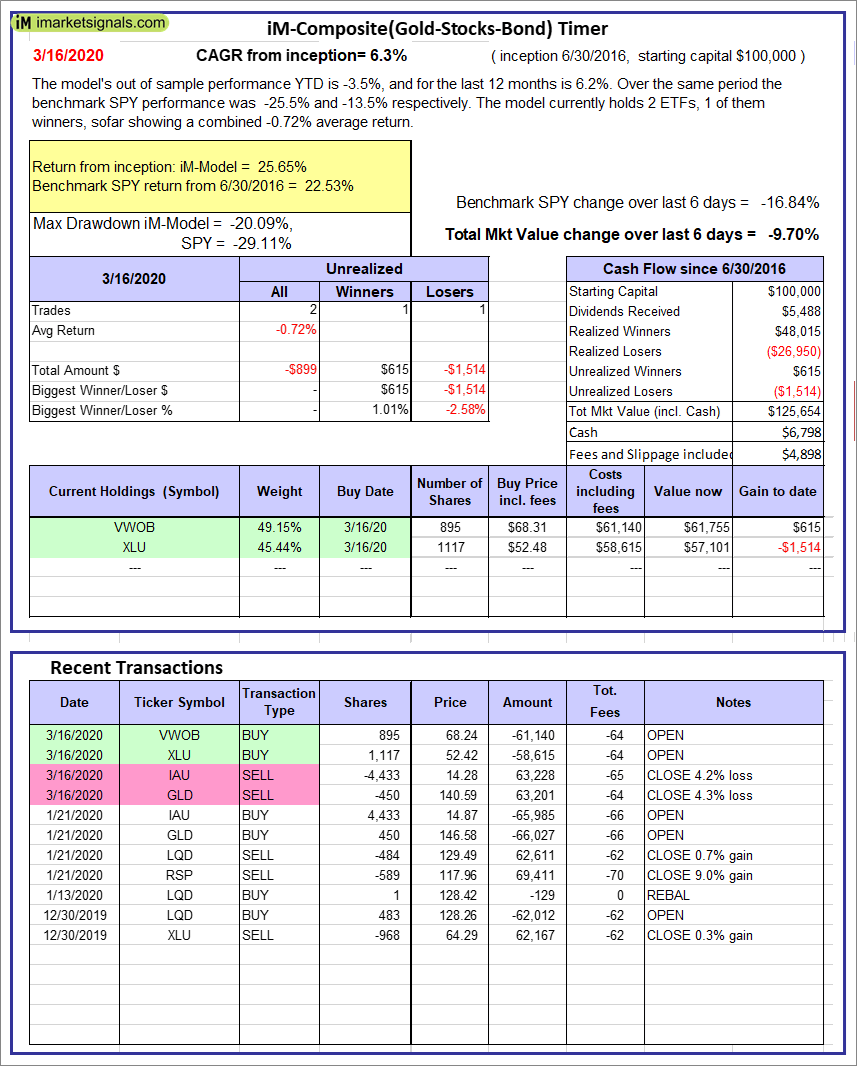 |
iM-Composite(Gold-Stocks-Bond) Timer: The model’s out of sample performance YTD is -3.5%, and for the last 12 months is 6.2%. Over the same period the benchmark SPY performance was -25.5% and -13.5% respectively. Over the previous week the market value of the iM-Composite(Gold-Stocks-Bond) Timer gained -9.70% at a time when SPY gained -16.84%. A starting capital of $100,000 at inception on 6/30/2016 would have grown to $125,654 which includes $6,798 cash and excludes $4,898 spent on fees and slippage. |
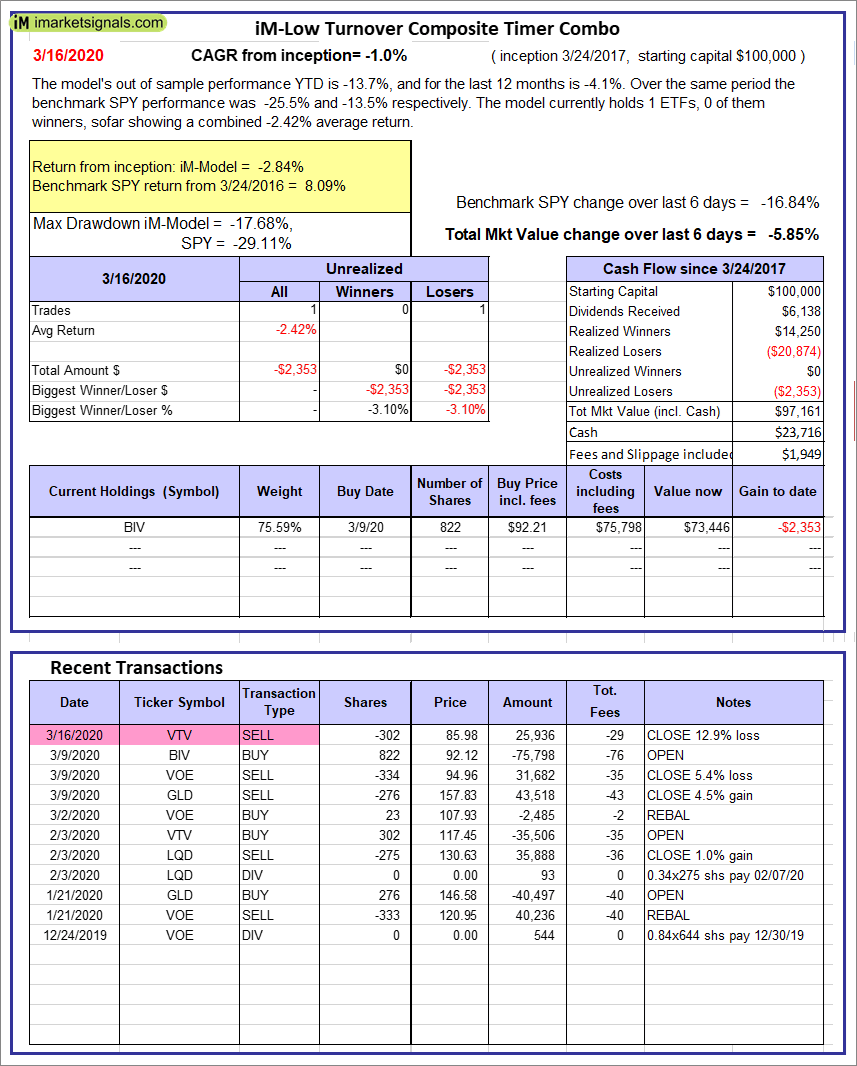 |
iM-Low Turnover Composite Timer Combo: The model’s out of sample performance YTD is -13.7%, and for the last 12 months is -4.1%. Over the same period the benchmark SPY performance was -25.5% and -13.5% respectively. Over the previous week the market value of the iM-Low Turnover Composite Timer Combo gained -5.85% at a time when SPY gained -16.84%. A starting capital of $100,000 at inception on 3/24/27 would have grown to $97,161 which includes $23,716 cash and excludes $1,949 spent on fees and slippage. |
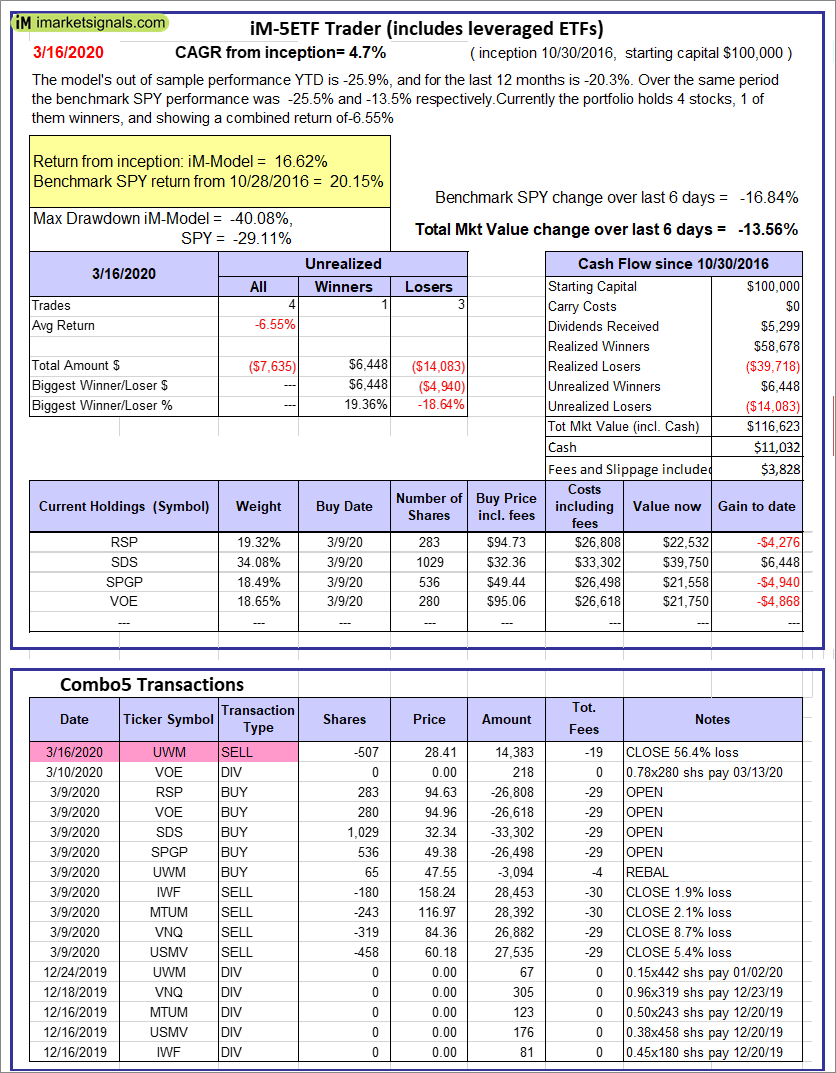 |
iM-5ETF Trader (includes leveraged ETFs): The model’s out of sample performance YTD is -25.9%, and for the last 12 months is -20.3%. Over the same period the benchmark SPY performance was -25.5% and -13.5% respectively. Over the previous week the market value of the iM-5ETF Trader (includes leveraged ETFs) gained -13.56% at a time when SPY gained -16.84%. A starting capital of $100,000 at inception on 10/30/2016 would have grown to $116,623 which includes $11,032 cash and excludes $3,828 spent on fees and slippage. |
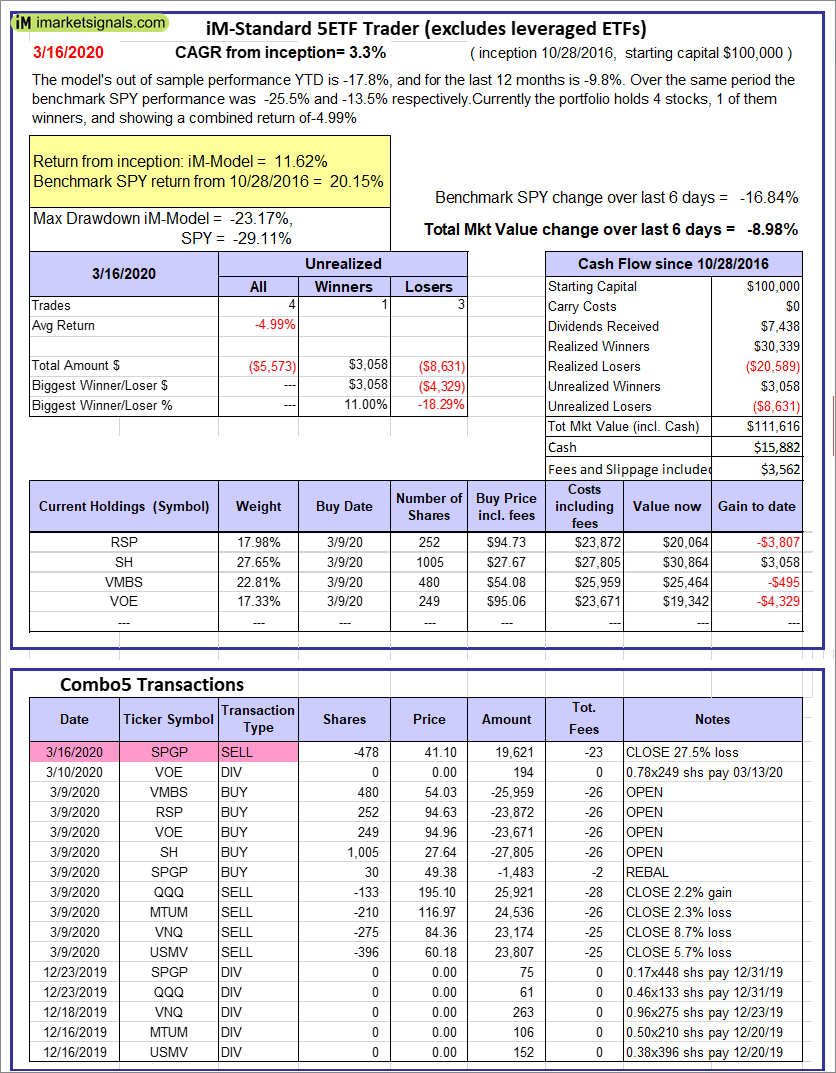 |
iM-Standard 5ETF Trader (excludes leveraged ETFs): The model’s out of sample performance YTD is -17.8%, and for the last 12 months is -9.8%. Over the same period the benchmark SPY performance was -25.5% and -13.5% respectively. Over the previous week the market value of the iM-Standard 5ETF Trader (excludes leveraged ETFs) gained -8.98% at a time when SPY gained -16.84%. A starting capital of $100,000 at inception on 10/30/2016 would have grown to $111,616 which includes $15,882 cash and excludes $3,562 spent on fees and slippage. |
iM-Best Reports – 3/16/2020
Posted in pmp SPY-SH
Leave a Reply
You must be logged in to post a comment.