- The new Federal Reserve Bank of Chicago Brave-Butters-Kelley Indexes (BBK) provide useful input for recession forecasting.
- We combine two BBK indexes with the Conference Board LEI and our Business Cycle Index BCIg to derive iMarketSignals’ new Long Leading Index (iM-LLI) for the US economy.
- Our analysis shows that the iM-LLI would have provided an average warning signal about eight months before the start of recessions, as observed for the last seven recessions since 1967.
- We are replacing the iM-Composite Index (COMP) with the new iM-LLI.
- Currently this Leading Index is not yet warning of an oncoming recession.
In this article we demonstrated that the new Federal Reserve Bank of Chicago Brave-Butters-Kelley Indexes provide good recession capturing indicators. The new iM-LLI, a robust long leading index, is constructed by combing the following data series:
- The BBK Coincident Index
- The BBK Leading Index
- The Conference Board LEI Growth
- The iM-Business Cycle Growth
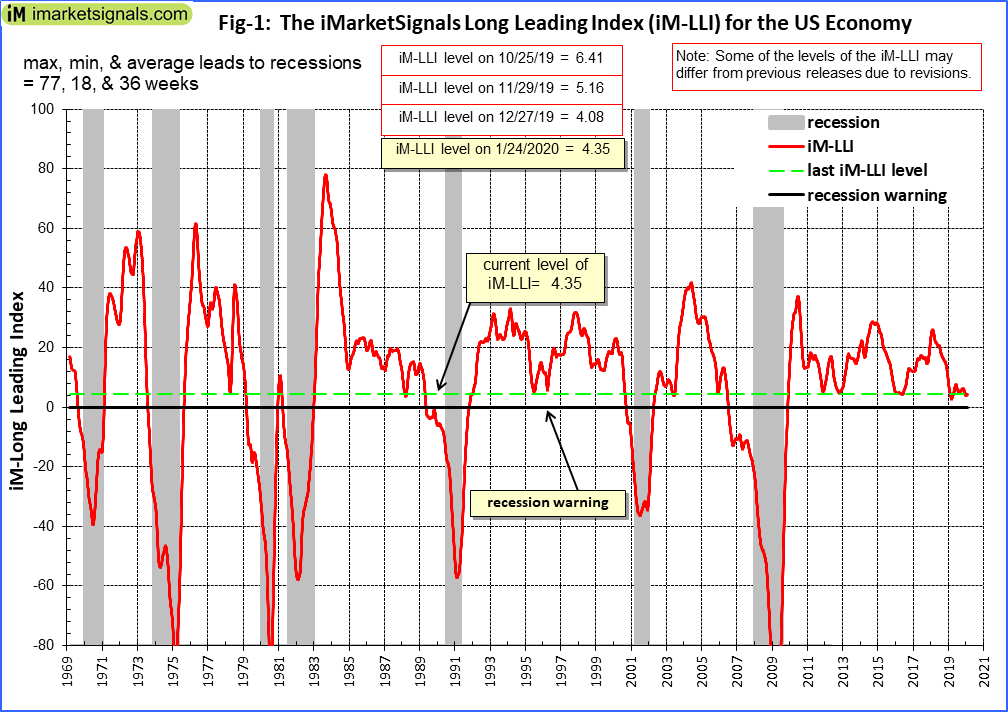
The plot in Figure-1 is the sum of the weighted normalized weekly values of the component indicators listed above. It is a point-in-time growth series which, when its level is below zero, forecasts recessions, as defined by the FRED recession series USREC. (This series indicates a recession start the first day of the month following a peak of the business cycle, and a recession end on the last day of the month of a trough.)
We analyzed the iM-LLI with our system for evaluating recession capturing indicators (described in Appendix 1 of this Feb-2012 article Evaluating Popular Recession Indicators) and obtained a high score of 0.89 to capture NBER recessions. (The maximum score is 1.00 for a perfect indicator.)
Applying the concept of likelihood ratios, the probability is 62% that this indicator can correctly identify recessions when it declines to, or is below a level of zero. This relatively low probability is due to the long lead times when the indicator is below zero, and no recession exists. However, as one can see from Figure-1 and the table below all the recession periods are captured in their entirety.
Leads to recession starts and ends (weeks) are shown in the table. Negative leads indicate late signals from the recession indicator.
| lead to recession start | lead to recession end | |
| 1970 | 19 | -11 |
| 1973 | 18 | -21 |
| 1980 | 35 | -20 |
| 1981 | 18 | -4 |
| 1990 | 63 | -30 |
| 2001 | 27 | -19 |
| 2008 | 77 | -20 |
| Average | 36 | -18 |
Conclusion
As can be observed from Figure-1, this indicator is currently not yet warning of a recession. Once it reaches zero, the minimum lead time to previous recessions was about four months.
The current level of iM-LLI is plus 4.35, as indicated by the green dashed line in the figure. It is apparent from the plot that in the past it never recovered to a higher value when the level was at, or near a level of 2.00, but it then always consistently continued to decline lower. It would then be advisable to track the path to recession by following a short leading indicator such as our BCI or the soon to be released iM-SLI a short leading indicator based on the same input data as for the iM-LLI but with different weightings of the component models.
It is evident that the business cycle is near a cycle peak, in the “Boom” phase of the cycle, but a recession is not yet indicated. Therefore it is not likely, absent of a “black swan” event, that there will be a business cycle peak (recession start) during the next six months.
The iM-LLI is updated every Friday on iMarketSignals, and will be replaced by the iM-SLI once the iM-LLI turns negative.


Usually the market peaks before the recession starts, so why not focus on the lead time to the market peak rather than the recession start?
That will be the function of the short leading index.
Georg,
another great tool in our arsenal. Well done !!
Looking forward to see the short term version.
Have you tried this as a timer for SPY or QQQ or any other major index?
Will an excel download of the LLI values be available as is the BCI?
This is indeed an exciting development, Georg. You have addressed some of the problems with delays in publication of the data, but with the base data incorporating 500 components reported monthly, I am curious about how the propensity for revisions to such a broad scope of economic data will affect the monthly real-time nature of your new LLI. Does the LLI’s lead-time (18-60+ weeks) give you enough confidence that revisions will be worked out quickly enough?