
- From November 2019 onward, the Federal Reserve Bank of Chicago is releasing new measures of monthly real GDP growth and its components, the Brave-Butters-Kelley Indexes.
- The data release is for four indicators constructed from a panel of 500 monthly macroeconomic time series and quarterly real gross domestic product growth.
- Our analysis shows that apart from the Leading Index, the other three indicators would have been extremely accurate identifying recessions were it not for the publication time-lag.
- This time-lag makes, on average, these indicators about two month late to signal the start and end of recessions in real-time, as observed for the last seven recessions since 1967.
- Currently none of the Brave-Butters-Kelley Index models are warning of a recession.
From November 2019 onward, the Federal Reserve Bank of Chicago is releasing new measures of monthly real GDP growth and its components, constituting what they are calling the Brave-Butters-Kelley Indexes (BBKI), on a monthly basis (Chicago Fed Letter, No. 422, 2019). The BBKI are constructed from a panel of 500 monthly macroeconomic time series and quarterly real gross domestic product (GDP) growth.
Here, we assess the usefulness to signal oncoming recessions for:
- The BBK Monthly GDP Growth Indicator
- The BBK Big Data Activity Index
- The BBK Coincident Index
- The BBK Leading Index
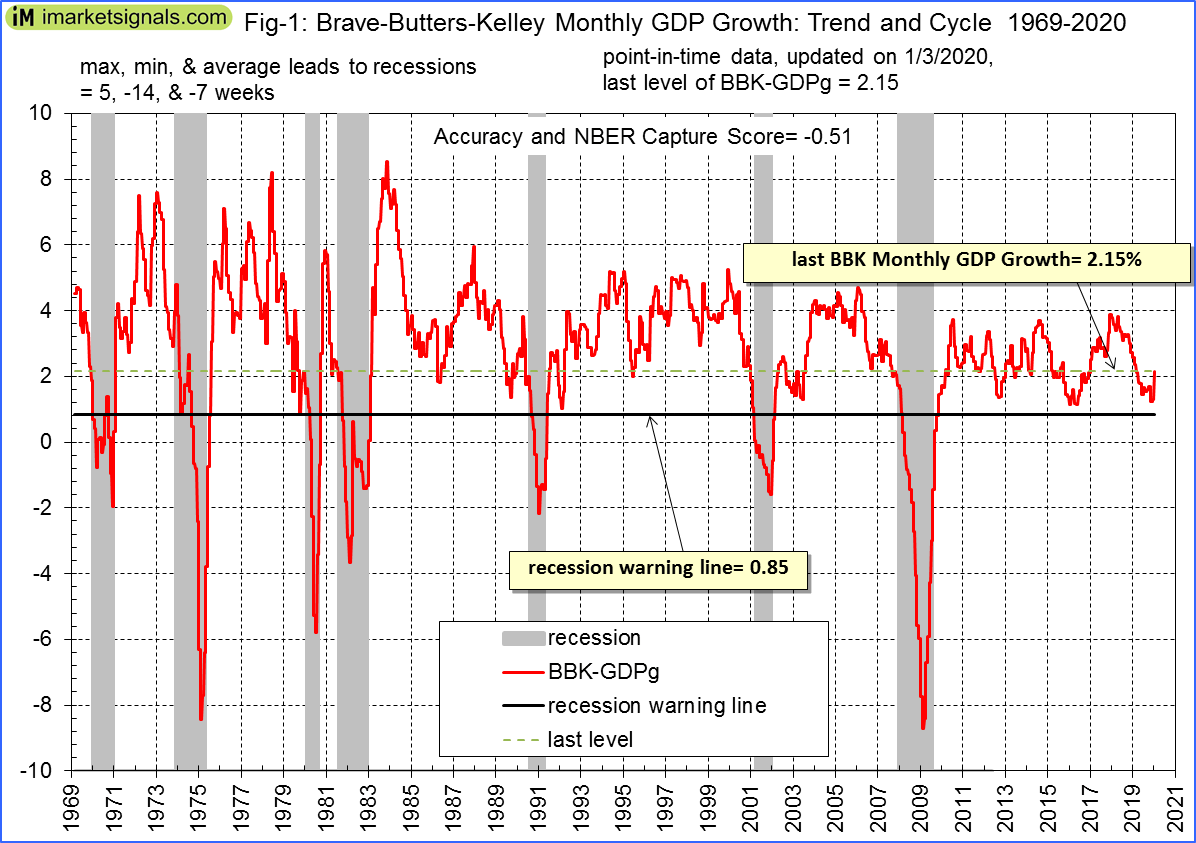
1. The BBK Monthly GDP Growth Indicator (BBK-GDPg)
The plot in Figure-1 is the sum of the estimated trend and cycle components for BBK Monthly GDP Growth.
To plot a point-in-time graph for BBK Monthly GDP Growth, one has to add two months to the series dates, because this is when one would for the first time have had the data update for this indicator.
We analyzed the BBK Monthly GDP Growth with our own system for evaluating recession capturing indicators (described in Appendix 1 of this Feb-2012 article Evaluating Popular Recession Indicators) using the FRED recession series USREC. The highest Capture Score was obtained by raising the recession indicator line by 0.85 annualized real gross domestic product (GDP) units.
The area under the curve (AUC) accuracy for this business cycle indicator based on its ability to correctly classify expansions and recessions is 90%, and it obtained an acceptable combined AUC Accuracy and NBER Capture Score of -0.51 from our evaluation system. (The maximum score is 1.00 for a perfect indicator. There is no downside limit for a bad one, but any score below -1.00 raises serious questions about an indicator’s usefulness.)
Applying the concept of likelihood ratios the probability is 78% that this indicator can correctly identify recessions when it declines to or is below a level of 0.85%.
Leads to recession starts and ends (weeks) are shown in the table below. Negative leads indicate late signals from the recession indicator.
lead to
|
lead to
|
|
| 1970 | -14 | -9 |
| 1973 | -12 | -17 |
| 1980 | -9 | -9 |
| 1981 | -8 | -9 |
| 1990 | -4 | -8 |
| 2001 | 5 | -12 |
| 2008 | -8 | -18 |
| Average | -7 | -12 |
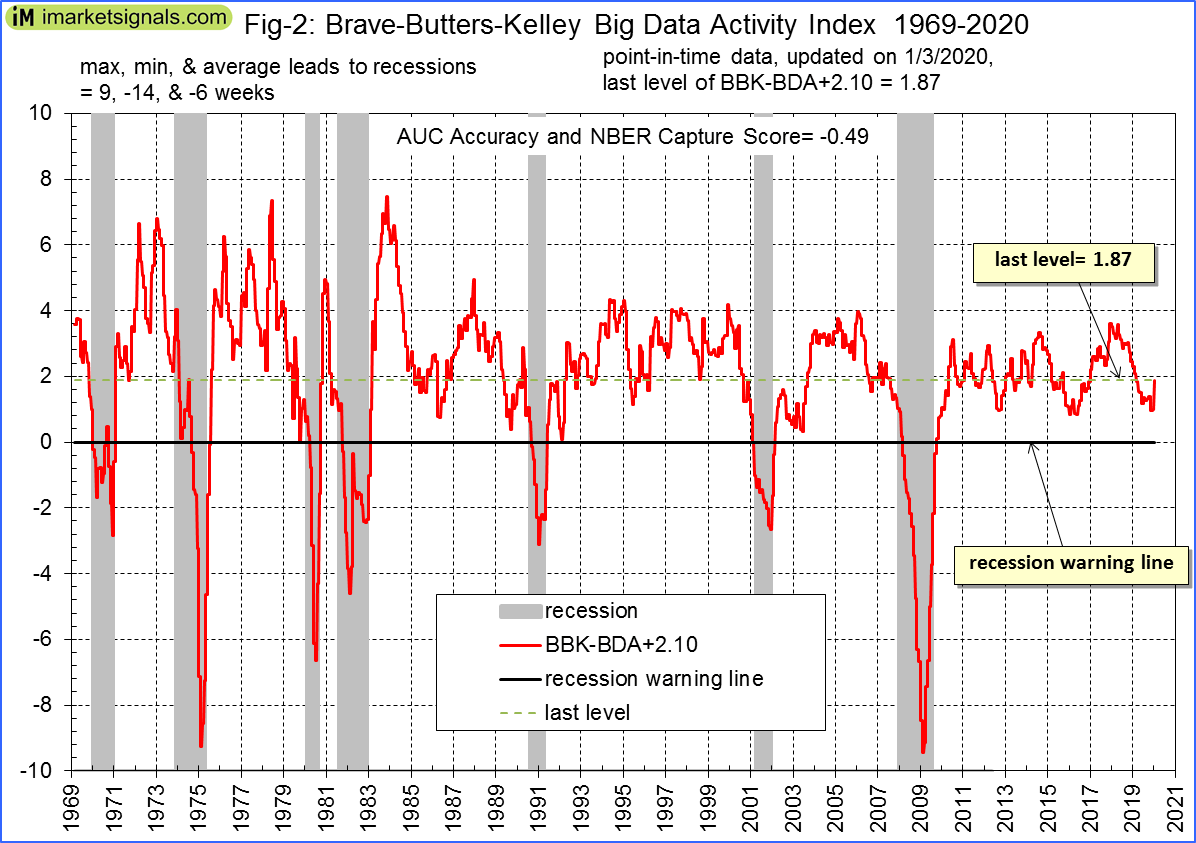
2. The BBK Big Data Activity Index (BBK-BDA)
The Chicago Fed Letter states that “The big data activity index …………..was shown to have several highly desirable properties, including being 99% accurate in aligning with historical U.S. recessions and expansions as defined by the National Bureau of Economic Research (NBER) since 1960”. (Note, the NBER recession series used by the authors was not identified in the Fed Letter.)
The correctness of the above statement was confirmed by our own system for evaluating recession capturing indicators. It requires raising the series values by 2.10 to make zero the recession indicator line and also ignoring the publication lag time. The area under the curve (AUC) accuracy would be a high 98%, and it would obtain a high combined AUC Accuracy and NBER Capture Score of 0.41. Likelihood ratios indicate a 94% probability that this indicator would correctly identify recessions when it declines to or is below zero, and also assuming the data to be point-in-time.
However, when the data applies to the actual time of publication, then the recession capturing ability becomes less impressive. The AUC becomes 90%, and it obtained a much lower, but still respectable, combined AUC Accuracy and NBER Capture Score of -0.49 from our system, all as shown in Figure-2. Likelihood ratios indicate a probability of 79% that this indicator in real-time would correctly identified recessions when it declines to or is below zero.
Leads to recession starts and ends (weeks) are shown in the table below. Negative leads indicate late signals from the recession indicator.
lead to
|
lead to
|
|
| 1970 | -14 | -9 |
| 1973 | -12 | -17 |
| 1980 | -9 | -9 |
| 1981 | -8 | -9 |
| 1990 | -4 | -8 |
| 2001 | 9 | -12 |
| 2008 | -8 | -13 |
| Average | -6 | -11 |
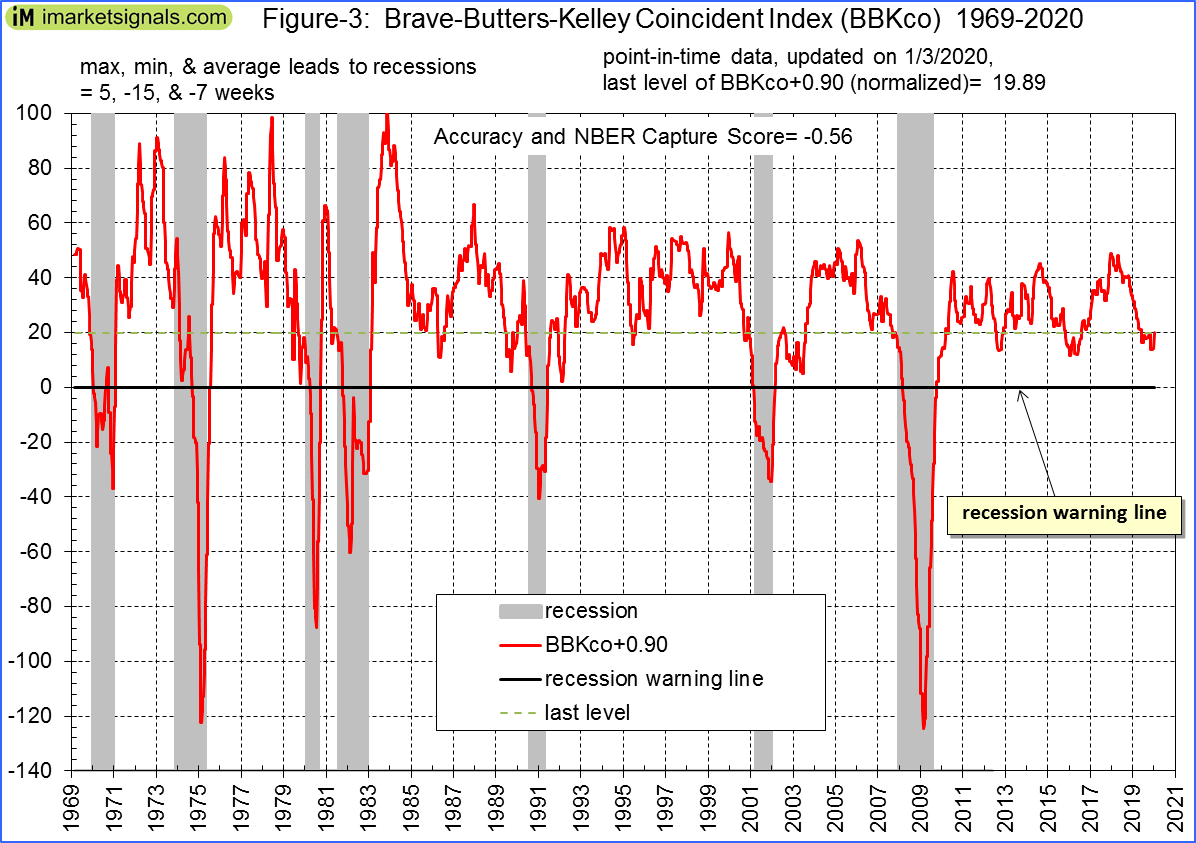
3. The BBK Coincident Index (BBKco)
When data is referenced to the actual time of publication and the series values raised by 0.90 (making zero the recession indicator line) to maximize the Capture Score, the AUC accuracy becomes 90%, and the combined AUC Accuracy and NBER Capture Score obtained from our systems is -0.56, all as shown in Figure-3. Likelihood ratios indicate a probability of 79% that this indicator in real-time would correctly identified recessions when it declines to or is below zero.
Leads to recession starts and ends (weeks) are shown in the table below. Negative leads indicate late signals from the recession indicator.
lead to
|
lead to
|
|
| 1970 | -15 | -9 |
| 1973 | -12 | -17 |
| 1980 | -9 | -9 |
| 1981 | -9 | -9 |
| 1990 | -5 | -9 |
| 2001 | 5 | -12 |
| 2008 | -8 | -14 |
| Average | -8 | -11 |
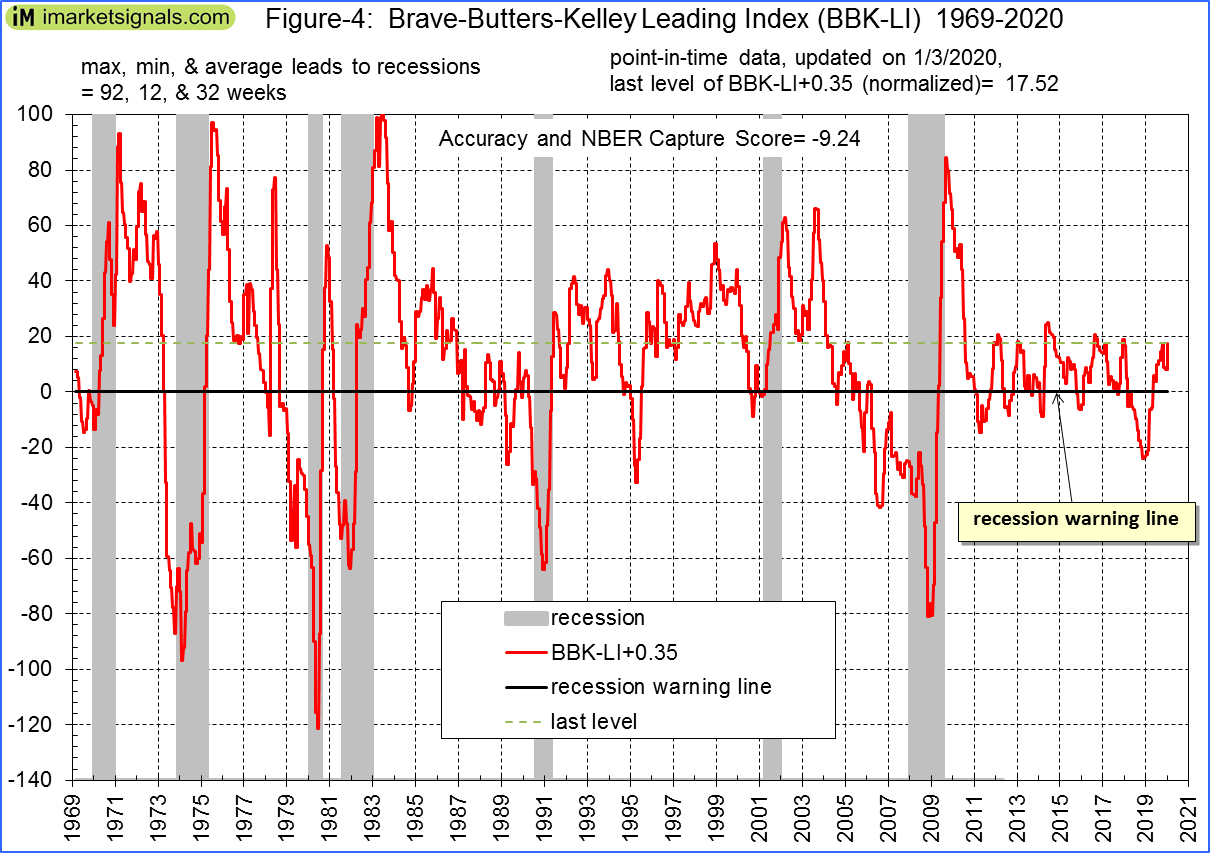
4. The BBK Leading Index (BBK-LI)
Quoting from the Chicago Fed Letter, “It is readily apparent from figure 4 that using this leading index to predict recessions is likely to produce many more false positive and false negative signals than the contemporaneous signal provided by the BBK Coincident Index (see figure 3)”.
(Note, for convenience the Figure-3 and -4 in this article correspond to the figure numbers in the Chicago Fed Letter.)
With data referenced to the actual time of publication and the series values raised by 0.35 (making zero the recession indicator line) to maximize the Capture Score, the combined AUC Accuracy and NBER Capture Score becomes -9.06, all as shown in Figure-4. Likelihood ratios indicate only a 50% probability that this indicator can correctly identify recessions when it declines to or is below zero.
Leads to recession starts and ends (weeks) are shown in the table below. Negative leads indicate late signals from the recession indicator. Although there were only positive leads to recession starts, the many false positives and false negative signals make this recession indicator unreliable.
lead to
|
lead to
|
|
| 1970 | 13 | 34 |
| 1973 | 31 | 4 |
| 1980 | 35 | -6 |
| 1981 | 21 | 26 |
| 1990 | 16 | -4 |
| 2001 | 13 | 35 |
| 2008 | 92 | 8 |
| Average | 32 | 14 |
Conclusion
Apart from the BBK Leading Index, the other three monthly released Brave-Butters-Kelley Indexes should provide useful information on the state of the business cycle. As can be observed from Figure-1 to -4 none of the four recession indicator models are currently warning of a recession.
Average leads to recession starts and ends (weeks) for the indicators depicted in Figures-1 to -3 are shown in the table below. On average these indicators were about two month late to signal the start and end of recessions in real-time; if it were not for the two month publication delay they would have been extremely accurate.
The next BBKI release will be on February 4, 2020 for the December 2019 data.
Average of Indicators 1, 2, & 3 |
||
lead to
|
lead to
|
|
| 1970 | -14 | -9 |
| 1973 | -12 | -17 |
| 1980 | -9 | -9 |
| 1981 | -8 | -9 |
| 1990 | -4 | -8 |
| 2001 | 6 | -12 |
| 2008 | -8 | -15 |
| Average | -7 | -11 |
Leave a Reply
You must be logged in to post a comment.